
Output Utilities and Data Visualization
Output Manager
The Output Manager allows you to create output devices to view output and model information in various ways:
• Plot Page: A plot within RiverWare showing various forms of data in a user configured layout. See “Plot Page”.
• RiverWare Data File (RDF): create an external file using RDF format. See “Creating RDF and CDF data files”.
• Comma-Delimited File: create an external file with one line per slot using commas as delimiters. See “Creating RDF and CDF data files”.
• Comma-Separated Values File: create an external file with one line per timestep value using commas as delimiters. See “Creating a Comma-separated Values File”.
• Tabular Series Slot Reports: Create an external HTML or text file that shows series data as tabular values. See “Creating a Tabular Series Slot Report”.
• Model Report: Create an external HTML file that shows information about the model, the data, the policy, or other output devices. See “Creating a Model Report”.
• Output Canvas: Create a highly customized canvas that can show teacup diagrams and other data visualization diagrams. See “Creating an Output Canvas”.
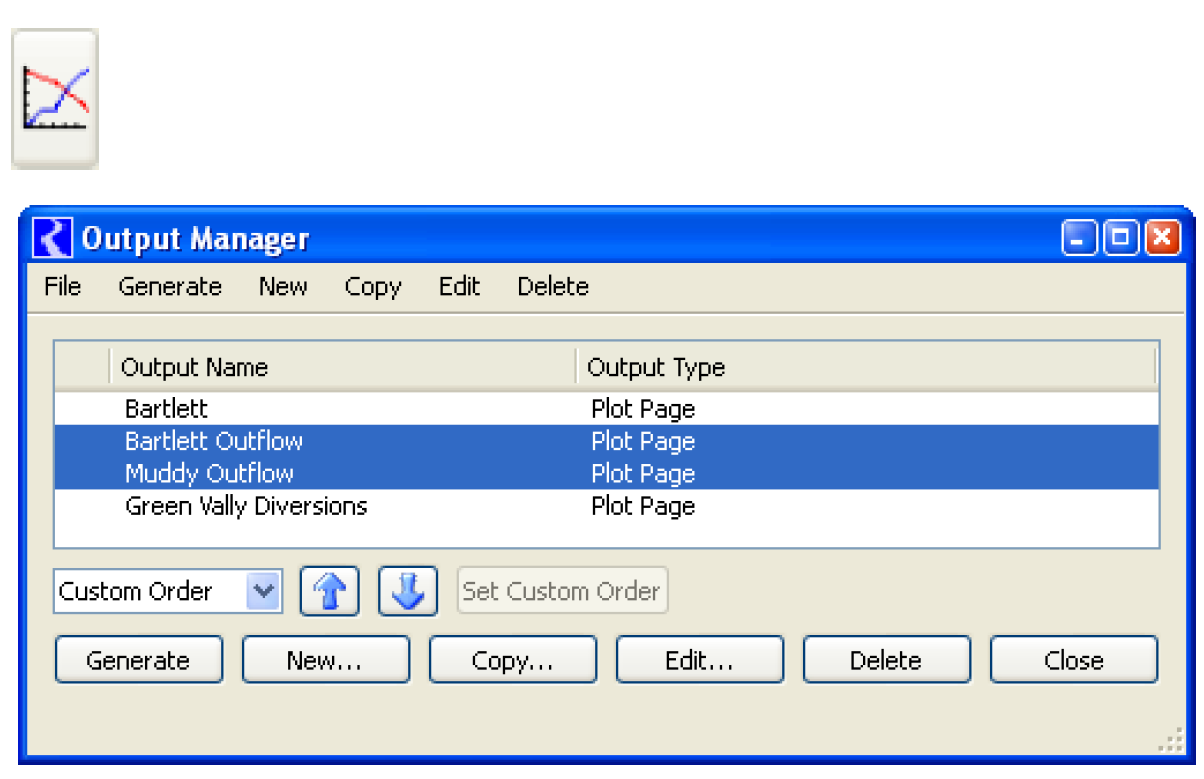
The Output Manager is accessed through the Utilities menu from the workspace or by selecting Output Manager on the main workspace toolbar. The Output Manager dialog appears.
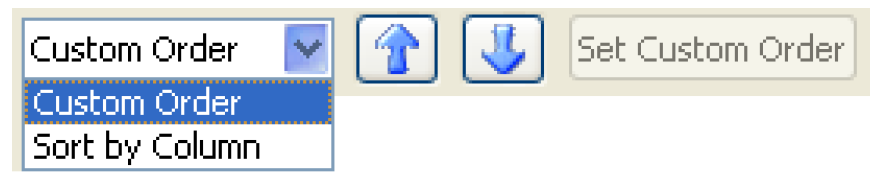
The Output Manager lists all of the currently existing output devices. Output devices are any defined format for generating data output.
Sorting
In the Output Manager, output devices can be reordered by selecting the buttons near the bottom of the window. The Up and Down arrows are used to move one or more selected objects up or down in the list. These buttons are only available for the Custom Order. When selecting Sort By Column, the Set Custom Order button is displayed and active. This button sets the currently displayed order as the new Custom Order, switches the sort menu to Custom Order, and enables the Up and Down buttons. A warning message dialog is presented to alert the user that the custom order will be overwritten. This functionality allows the user to first sort by one of the columns, save the order as custom, then make detailed changes by selecting the Up and Down arrows. Any further changes to the Custom Order are saved automatically.
Exporting and Importing Output Devices
Output devices can be exported to a file.
• Select the devices to be exported (devices can be of any type).
• Select the File, then Export Selected Outputs menu.
• Select or enter a desired file path and name in the resulting File Chooser dialog and select Save.
Output devices that have been saved to a file can then be imported into any model.
1. Select the File, then Import menu of the Output Manager dialog.
2. Select the import file in the resulting File Chooser dialog and select Open.
An informational dialog is displayed that summarizes the devices that were imported. Unique names are created (via a numbered suffix) for any devices with names that already exist as outputs in the model. Imported devices will appear in the Output Manager list.
If devices are created in one model, they can all be exported to a file and imported into the other model. If the same objects and slots are present in the second model, the devices will be fully specified with valid slot pointers in all the devices
If plots are exported from one model and imported into another one that does not have the same objects and slots, the curves will not have valid slots. In the Plot Page configuration, the following message is displayed.

You must generate the plots and then the curves will appear in the legend of the plot, but without any data for the curves. You can then configure and select new slots; see “Edit Menu” for details.
If non-plot output devices (Excel, RDF, CDF, Chart) are exported from one model and imported into another one that does not have the same objects and slots, the devices cannot currently be updated with slots from the new model. This will be addressed in the future.
Output Devices for Aggregated Values
All output devices support outputs at the model timestep size. But sometimes, you want or need to output data at a different timestep size. For example, if you are running an operations model with a 1 Hour timestep, perhaps you would like to output daily totals in a model report. Certain output devices can optionally summarize data; for example, Tabular Series Slot Reports will show you specified statistics (Min, Mean, Max) at fixed intervals (E.g. every 24th timestep) or at 1 Month intervals. These values are shown in addition to the single interval values. But, time series of aggregated information is not directly available from any of the devices. The general approach used in RiverWare is that you must create slots that represent the aggregated values. This section provides some guidance and approach for creating aggregated slots and then showing them in output device.
A general approach for showing aggregated values is to create slots that represent the aggregated values and then include them in your report. There are two types of slots that can be used, as follows:
• Time Aggregation Series Slots. Create a Time Aggregation Series Slot. This slot references a smaller timestep series slot in your model and aggregates (Sum, Avg, Min, Max, Last, First) the values to a larger timestep (1 Day, 1 Month, 1 Year). See “Time Aggregation Series Slots” in User Interface.
• Series Slots with Expression. Create an expression slot and develop a RPL expression that performs the aggregation. There are many RPL predefined functions and operators that can be used in the expression, such as SumSlot function, SumFlowsToVolume function, SUM operator, and the AVE operator. See “Series Slots With Expression” in User Interface.
It is usually easier and quicker to configure Time Aggregation Series Slots. But Expression Slots provide flexibility and customization if the aggregation function or time range that you wish to use is different than the provided functions.
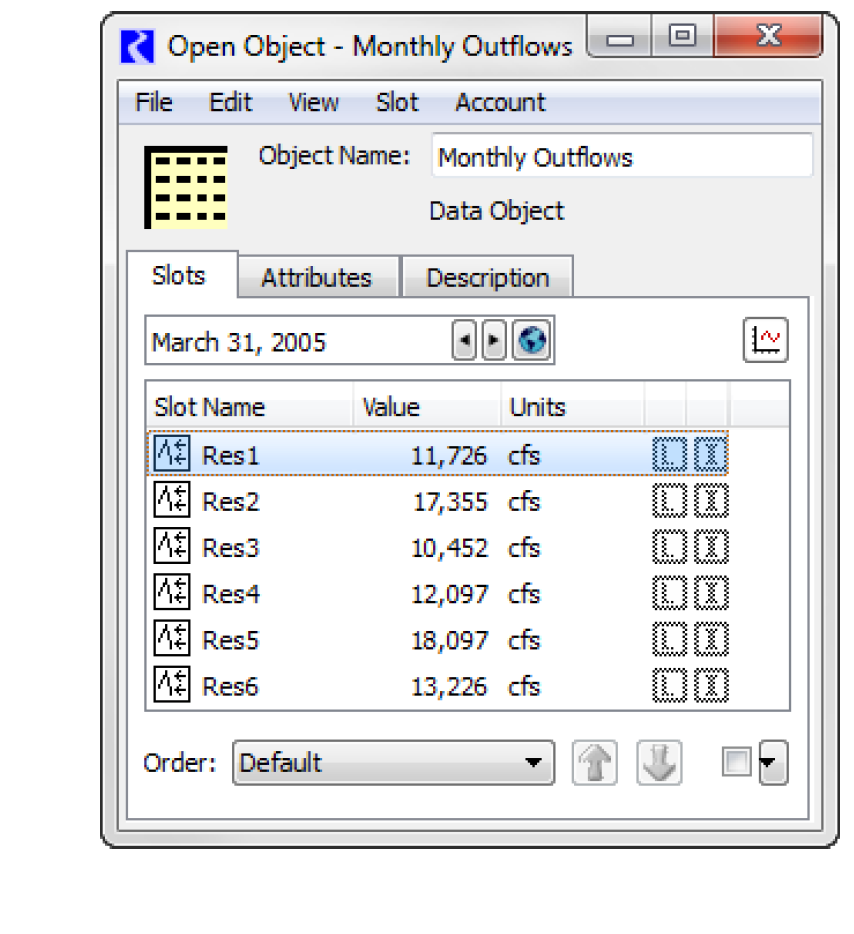
Often, for output devices, you wish to show the same aggregated slots for many different objects. Let’s assume we wish to show the average monthly flow (in a model with a timestep of 1 Day) for six different reservoirs. In this example, we will show Time Aggregation Series slots. There are two main approaches to organize the aggregated slots for this calculation as shown in Table 1.1. Also shown are advantages and disadvantages for both.
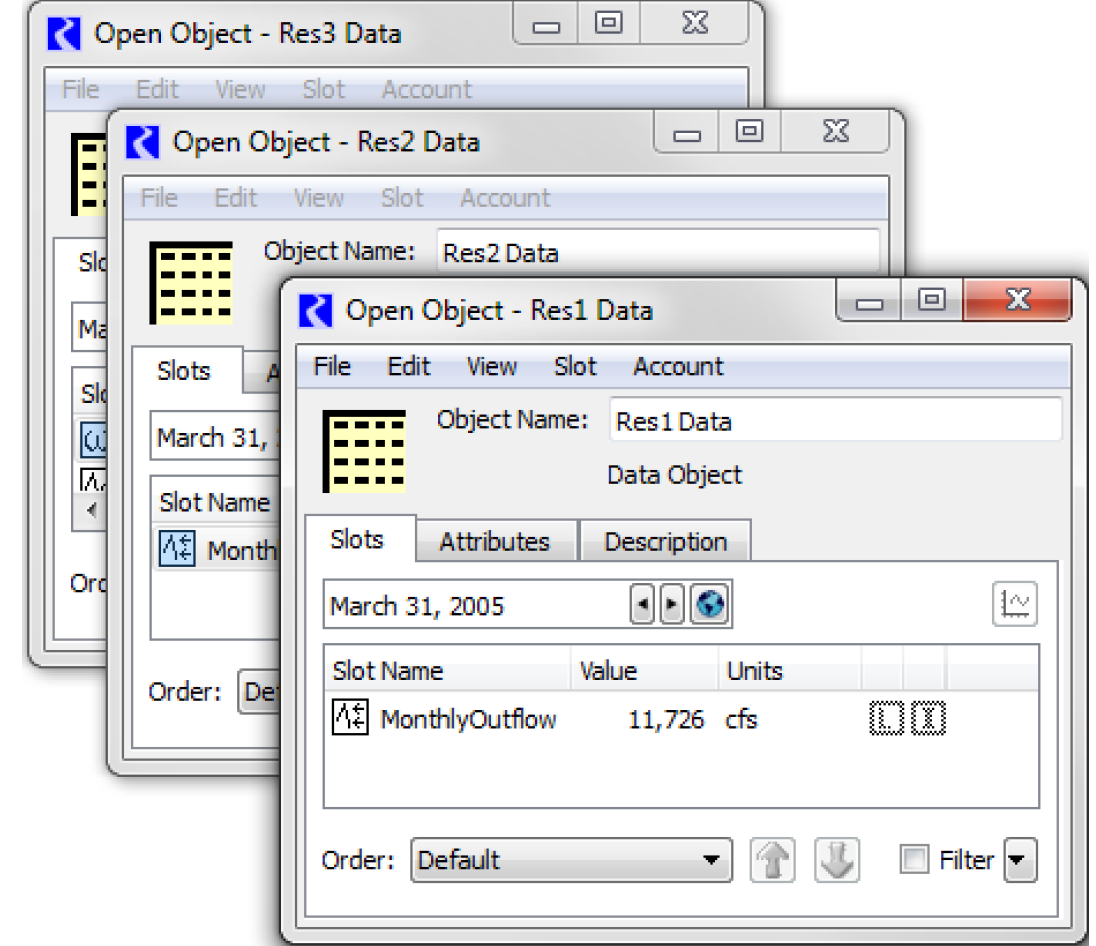
A. One data object that contains one aggregation slot per reservoir. | B. Create custom aggregation slots on accompanying data objects or directly on the simulation object. |
 |  |
Advantages | |
This structure keeps all the data in one place. In addition, for Time Aggregation Series Slots, you can use the Create Similar Slots for Different Objects functionality. This setup works especially well for Tabular Series Slot Reports. See “Creating Similar Time Aggregation Series Slots for Different Objects” in User Interface for details. | Having one data object per object provides a place for all user defined data in one location. Creating custom slots directly on the simulation object keeps all the data in one place. Either format works well for Charts and the Output Canvas. |
Disadvantages | |
This structure does not support Charts or the Output Canvas. These two devices assume data is on each objects or an associated data object. | It is harder to create or add a slot to many objects once they are created. This can be mitigated by selecting Copy Slots to Objects functionality. See “Copy Slots to Objects” in User Interface for details. |
Naming Conventions | |
Make sure to use the same naming convention for the slots as you do for the Objects | Make sure to use a consistent naming convention for slot names so they are accessible by the Output devices. |
Output Types
The following outputs can be generated by RiverWare:
• Plot Page
• RiverWare Data File (.rdf); see “RiverWare Data Format (RDF)” for details.
• Comma-Delimited File (.cdf)
• Comma-separated Values File (.csv)
• Excel spreadsheet
• Tabular Series Slot Report (text or html)
• Model Report
• Chart
• Output Canvas
Plot Page
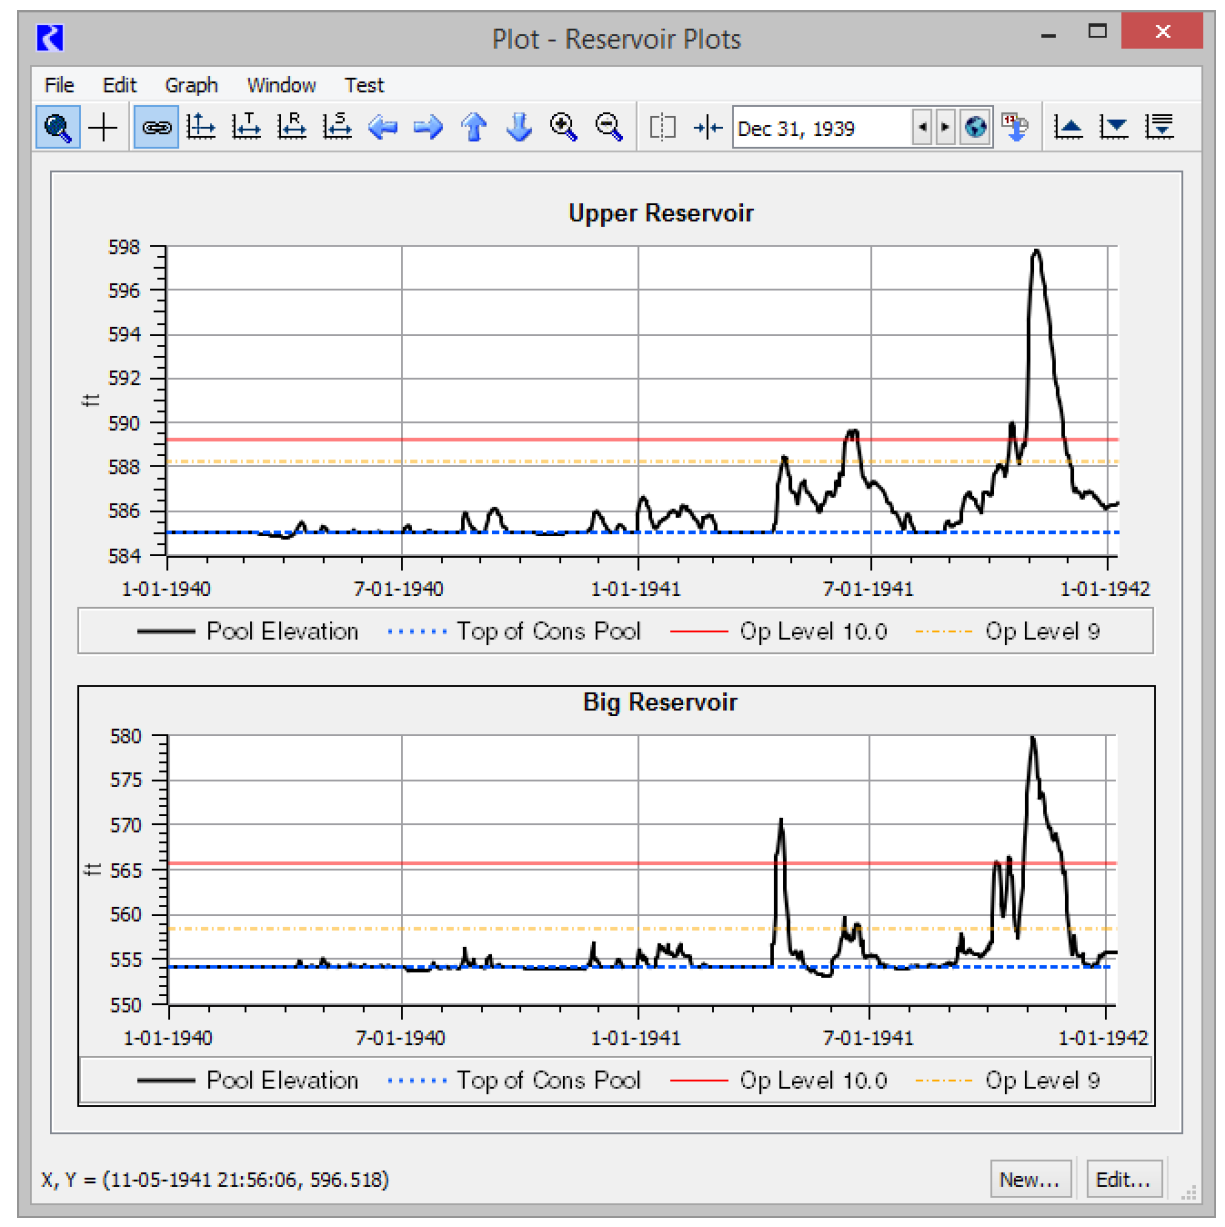
The Plot Page output device allows you to plot data. Figure 1.1 is a sample. See “Plotting” for additional information.
Figure 1.1 Sample 2X1 plot page
Creating a New Plot Page
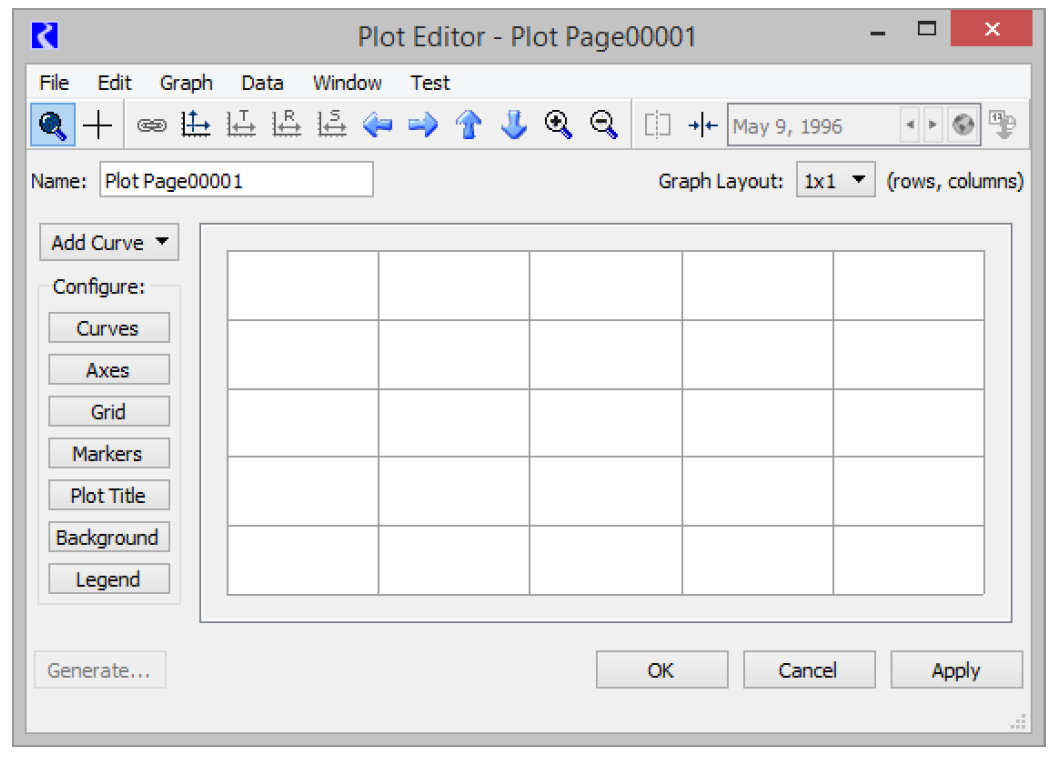
To create a new plot page, select New, then New Plot Page from the Output Manager dialog. A blank Plot Page Editor dialog appears. See “Plot Page Editor” for details on adding curves and configuring plots.
Creating RDF and CDF data files
The steps for generating RDF and CDF files are similar, so we will explore creating only the RiverWare Data File. To create a Comma-Delimited File (one line per slot), use the following steps and generate a .cdf file instead of a .rdf file.
1. In the Output Manager select New, then New Riverware Data File from the menu bar at the top of the dialog. A new Riverware Data File: window appears with the name Riverware Data File: Riverware Data File00001. Notice that in the Output Type: selector the RiverWare Data Format File is chosen.
2. Select the appropriate slots
3. In the Output File: field type a path and file name. These files should end in .rdf as the .rdf extension is for RiverWare Data File.
4. Select Save. The output device window closes and its name turns black in the Output Manager.
5. In the Output Manager dialog, select the device then select Generate. A new output file has been created in the specified directory.
Use the Slots menu to show slots in an SCT. The Slots, then SCT, then More selections are available for these Output Devices. These two operations show the items selected within the Output Device’s slot list in an SCT, either in a new SCT or in the single open SCT. The latter operation is available only if exactly one open SCT is visible (not minimized
Creating a Comma-separated Values File
Following are the steps to create a Comma-separated Values (CSV) file. The CSV file has one line per timestep and includes many other fields, some automatically and some optionally. This CSV format is designed to be used in Excel or the Tableau software.
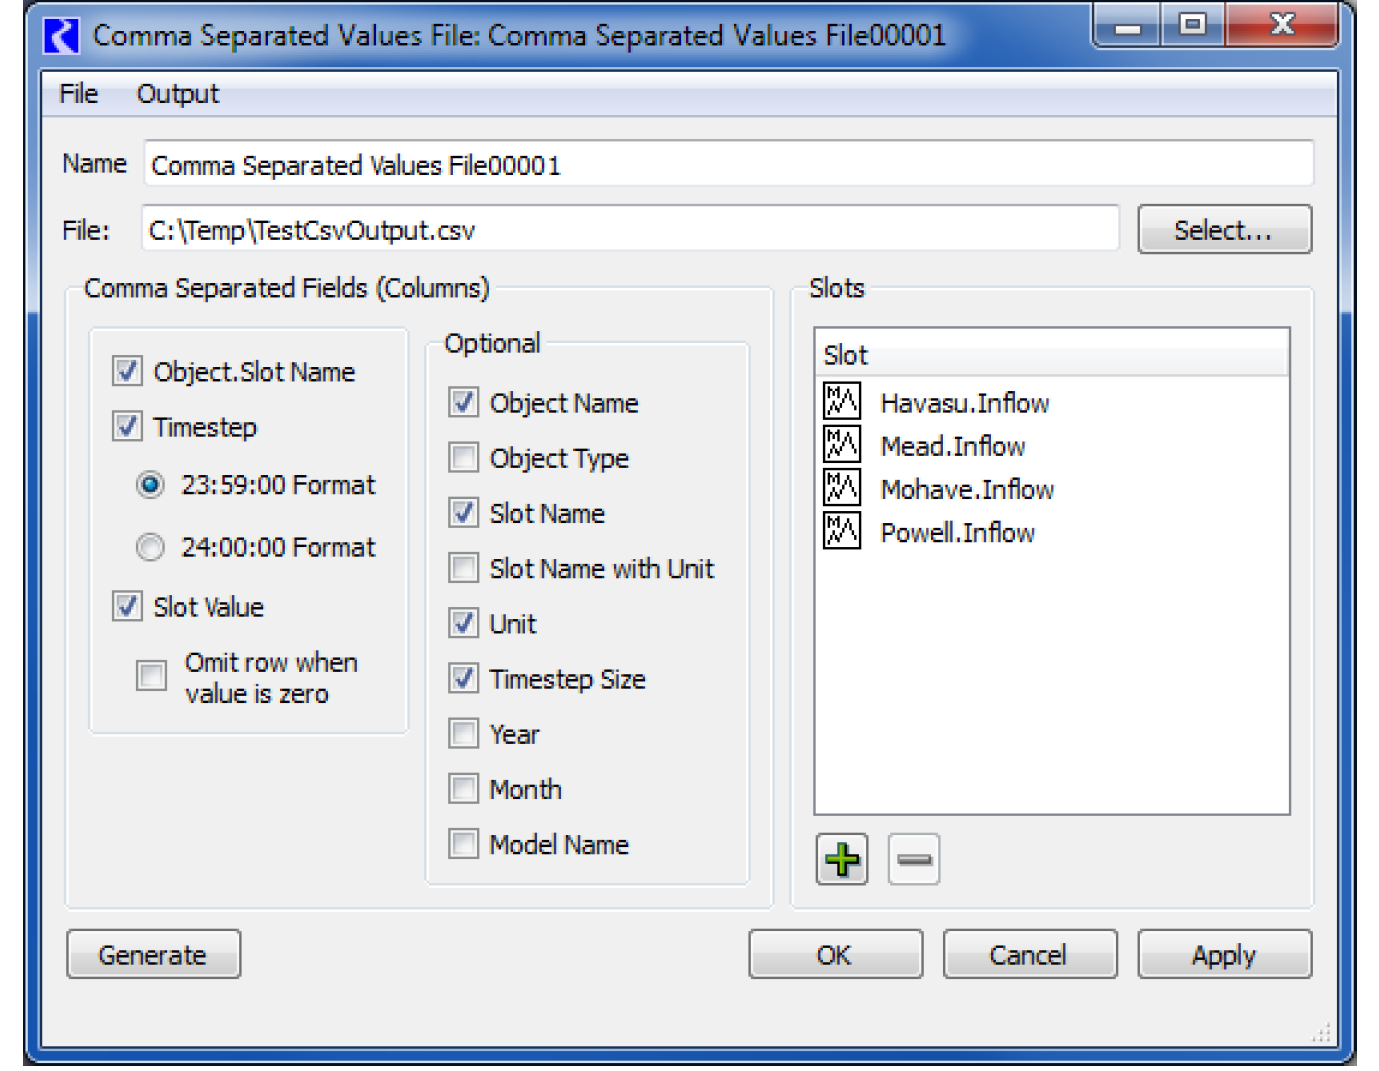
1. In the Output Manager select New, then New Comma-Separated Values File from the menu bar at the top of the dialog.
A new Comma Separated Values File window appears with the name Comma Separated Values File00001. The fields in the left list always remain checked for output as columns to the file.
2. Select a timestep option for the format of the written time. RiverWare uses end of timestep format for all datetime references. Thus for a 1 Month timestep, July 2014 would be fully specified as 7/31/2014 24:00. Tableau and Excel do not have a concept of 24:00 as a time but would instead use 8/1/2014 00:00 for the same point in time. Therefore with the proper timestep option selected in the dialog, one minute is subtracted from all timestep values (e.g. 7/31/2014 23:59) to assure that they appear with the appropriate day and month references in Excel and Tableau.
3. If desired, check the option to Omit rows when value is zero. When selected, rows are not written to the output file when the slot’s value for that row is zero. The value is considered zero, in this case, if the absolute value is less than 1 x 10⁻⁸.
4. Check any of the Optional fields for output as additional columns in the file.
5. Select the desired slots for output by selecting +.
6. In the File: field type a path and file name or select a file. The file should end in .csv to indicate a comma-separated values file.
7. Select OK.
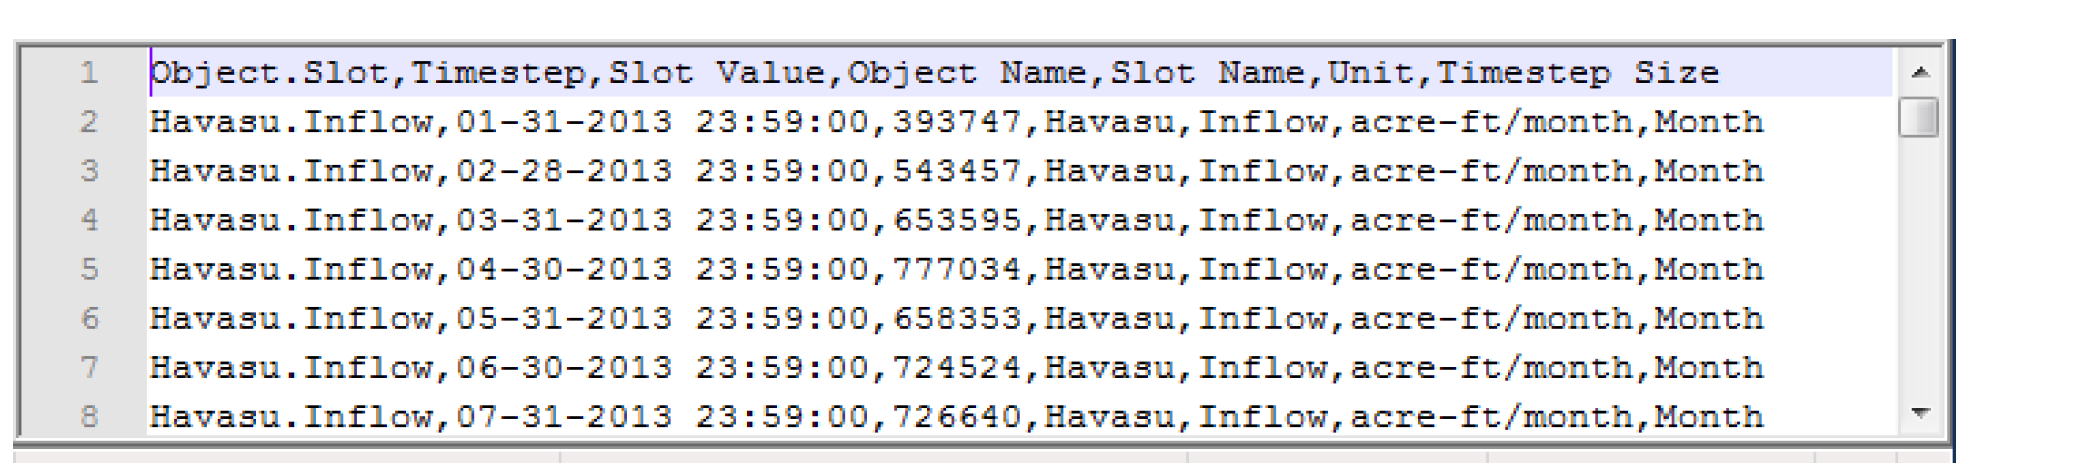
8. In the Output Manager dialog, select the device then select Generate. A new output file is created in the specified directory. Figure 1.2 shows an example format.
Figure 1.2
Creating an Excel Spreadsheet
Following are the steps to create an Excel spreadsheet.
1. In the Output Manager select New, then New Excel File from the menu bar at the top of the dialog.
A new Excel File: window appears with the name Excel File00001. In the Output Type: selector the Excel File is chosen.
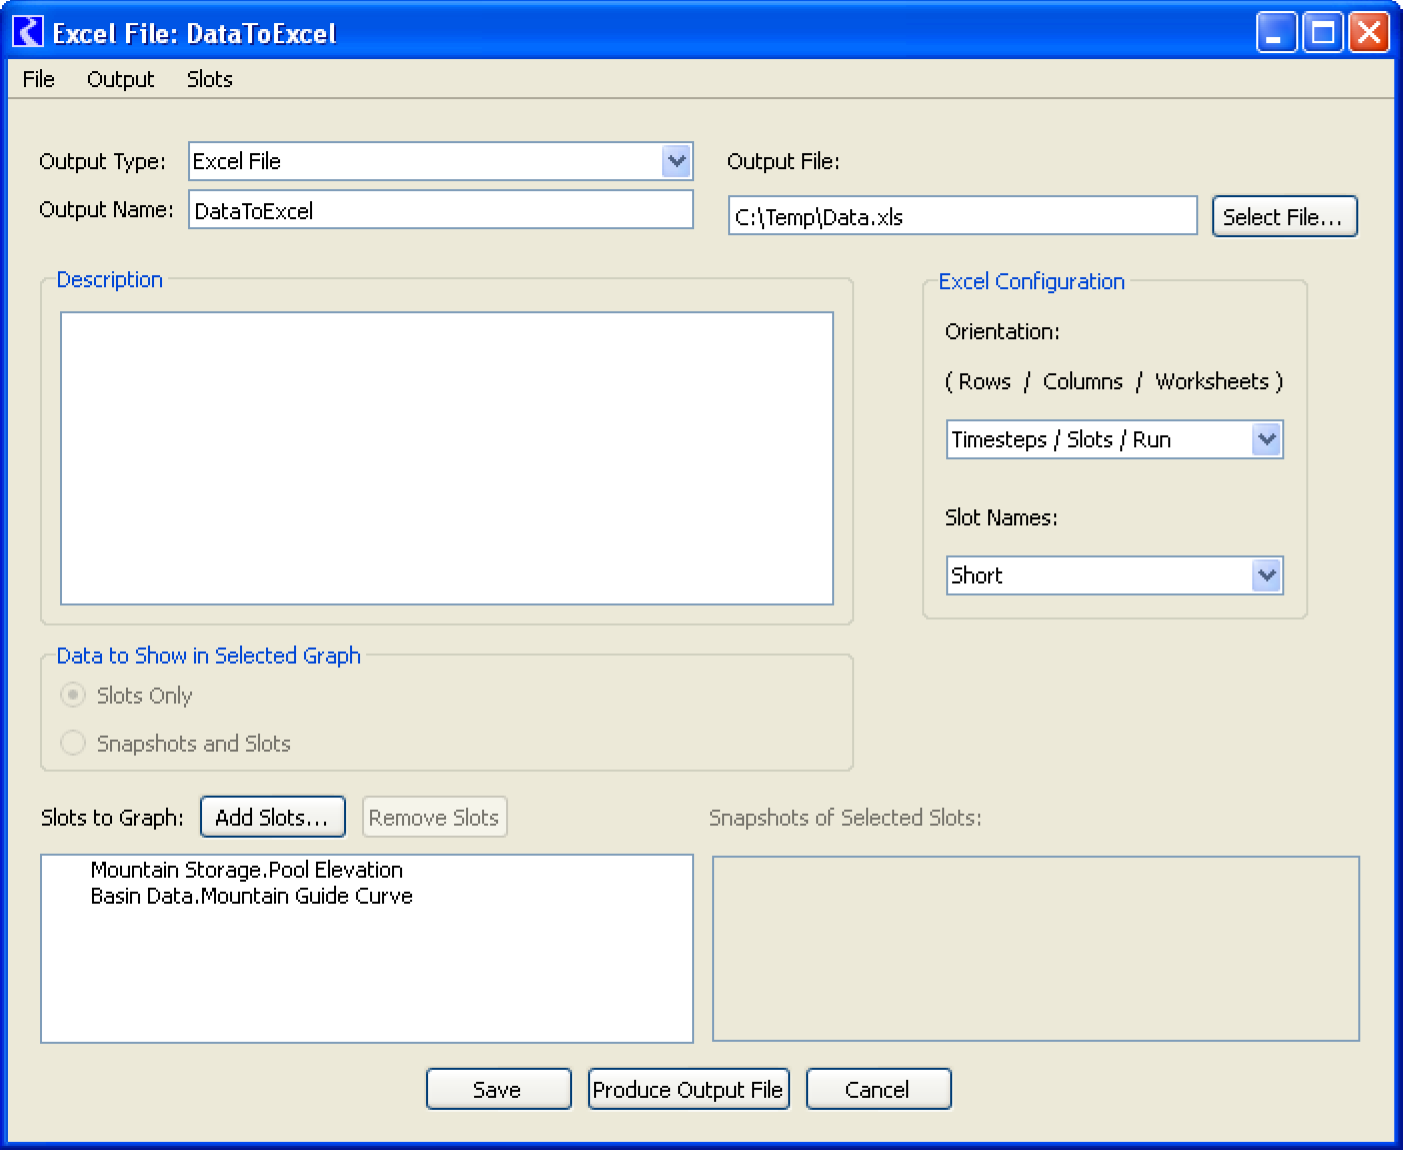
2. Select the appropriate slots.
3. In the Output File: field type a path and file name or select a file. These files should end in .xls or .xlsx to indicate it is an Excel spreadsheet.
4. Select from the Orientation drop-down box. This configures how slots, timesteps, and runs are translated into rows, columns, and worksheets in Excel.
5. Select from the Slot Names drop-down box. This configures how slot names are written into the Excel data sheets. Options are as full names, automatically shortened names (lower case vowels removed), or index names (Slot0, Slot1, etc.).
6. Select Save. The output device window closes and its name turns black in the Output Manager.
7. In the Output Manager dialog highlight the new device, select Generate. A new output file has been created in the specified directory.
Creating a Tabular Series Slot Report
A Tabular Series Slot Report is an output device which generates a plain text or HTML document showing, in a table or multiple tables, series values for a set of slots. See “Tabular Series Slot Report” for details.
New report configurations are created within the Output Manager dialog. Use the following steps to create a new report.
1. In the Output Manager select New, then New Tabular Series Slot Report from the menu bar at the top of the dialog.
A new Tabular Series Slot Report: window appears with the name Slot Report00001.
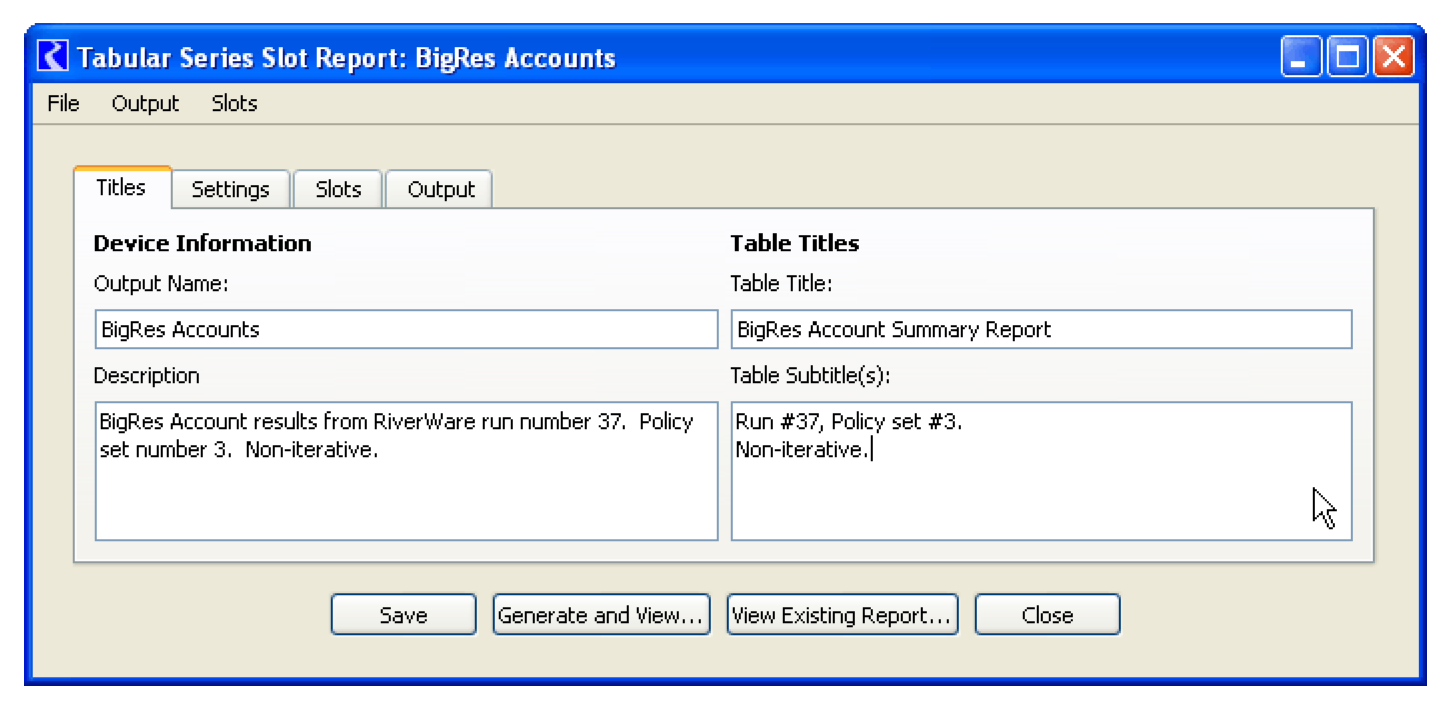
2. Configure the new report using the dialog. See “Configuring Tabular Series Slot Reports” for details.
3. Once configured, select Save (The output device window closes and its name turns black in the Output Manager) or select Generate and View to see the resulting file.
4. Alternatively, to generate and view the report, from the Output Manager dialog, highlight the new device, select Generate.
See “Tabular Series Slot Report” for additional information.
Creating a Model Report
A Model Report is an output device which generates an HTML document showing information about a model including slots, selected methods, run range, and subbasin membership. See “Model Report” for details.
New report configurations are created within the Output Manager dialog. Use the following steps to create a new report in the Output Manager.
1. Select New, then New Model Report from the menu bar at the top of the dialog.
A new Model Report: window appears.
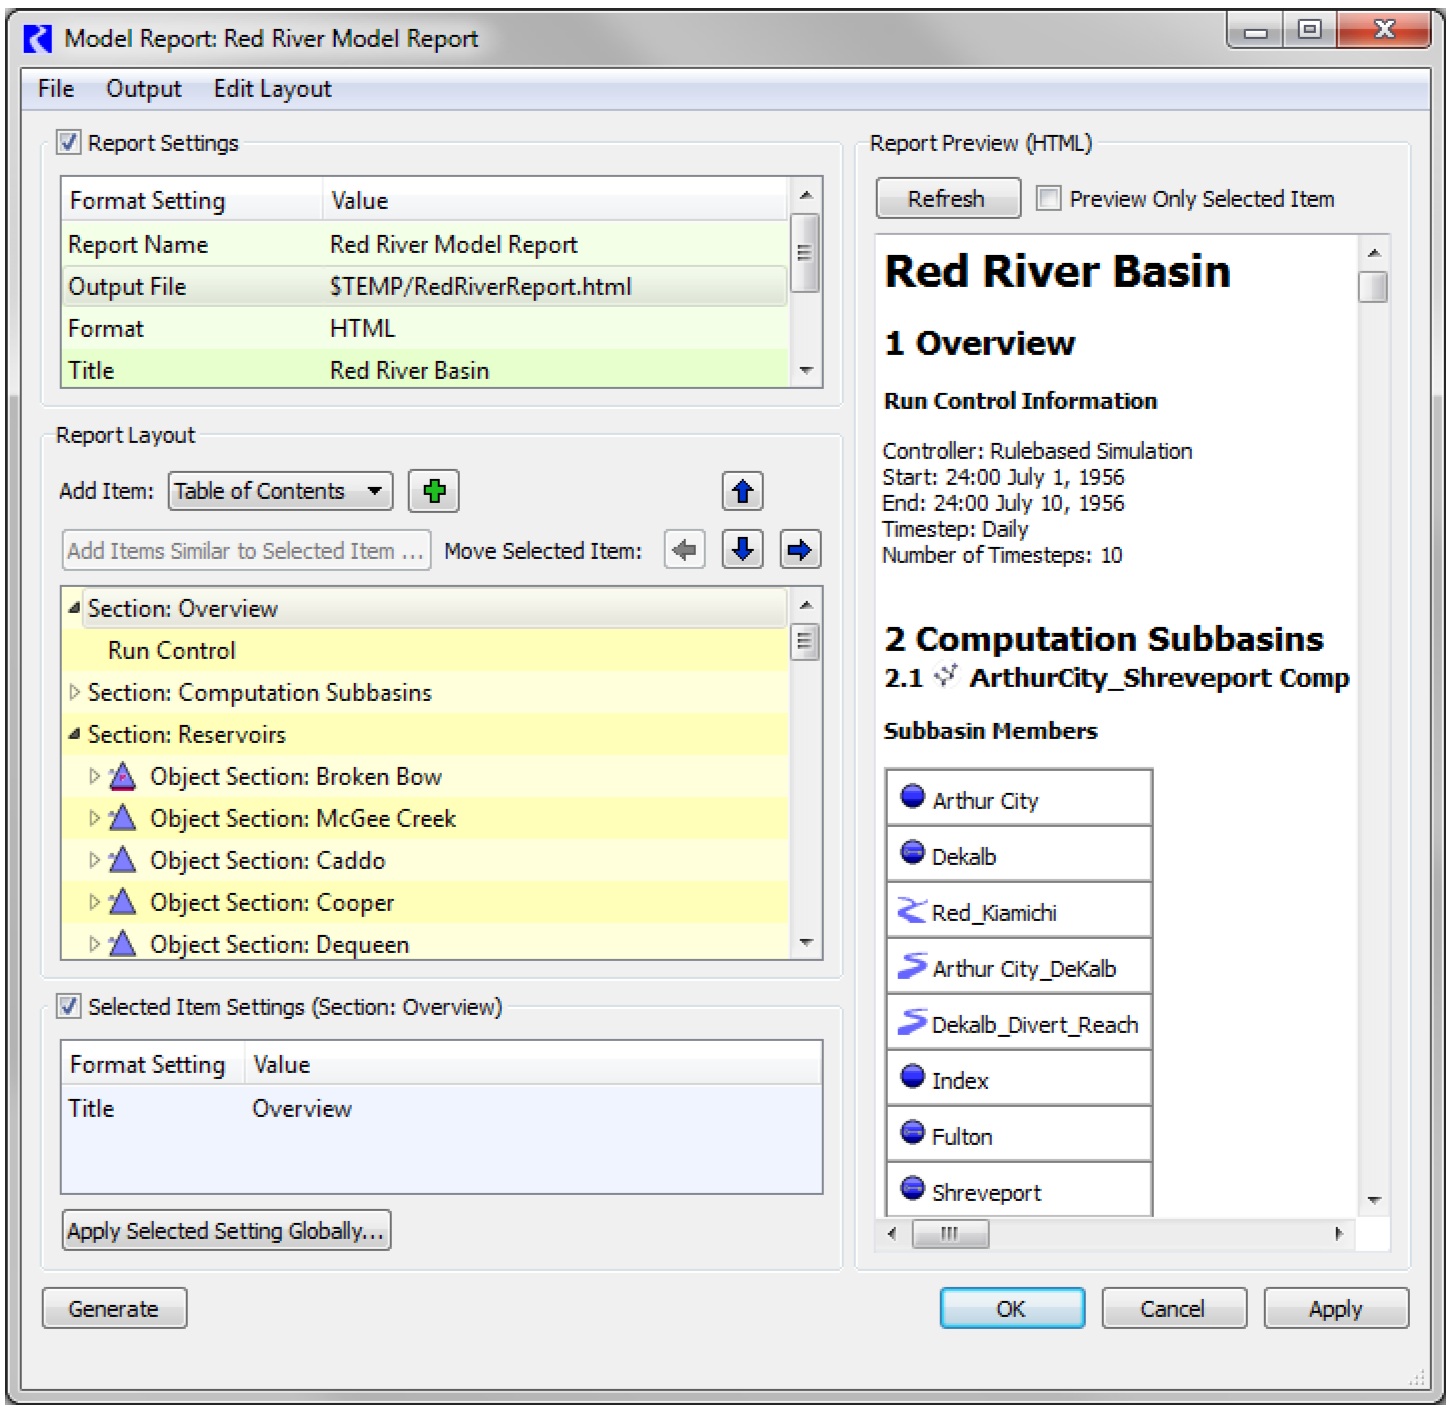
2. Configure the new report using the dialog. See “Configuring Model Reports” for details.
3. Once configured, select Ok. The output device window closes and its name turns black in the Output Manager.
4. Alternatively, to generate and view the report, from the Output Manager dialog, highlight the new device, select Generate.
See “Model Report” for additional information.
Creating a Chart
A Chart is an output device which generates a pie chart of data from specified slots. See “Chart” for details.
New chart configurations are created within the Output Manager dialog. Use the following steps to create a new chart.
1. In the Output Manager select New, then New Chart from the menu bar at the top of the dialog.
A new Chart: window appears with the name Chart00001.
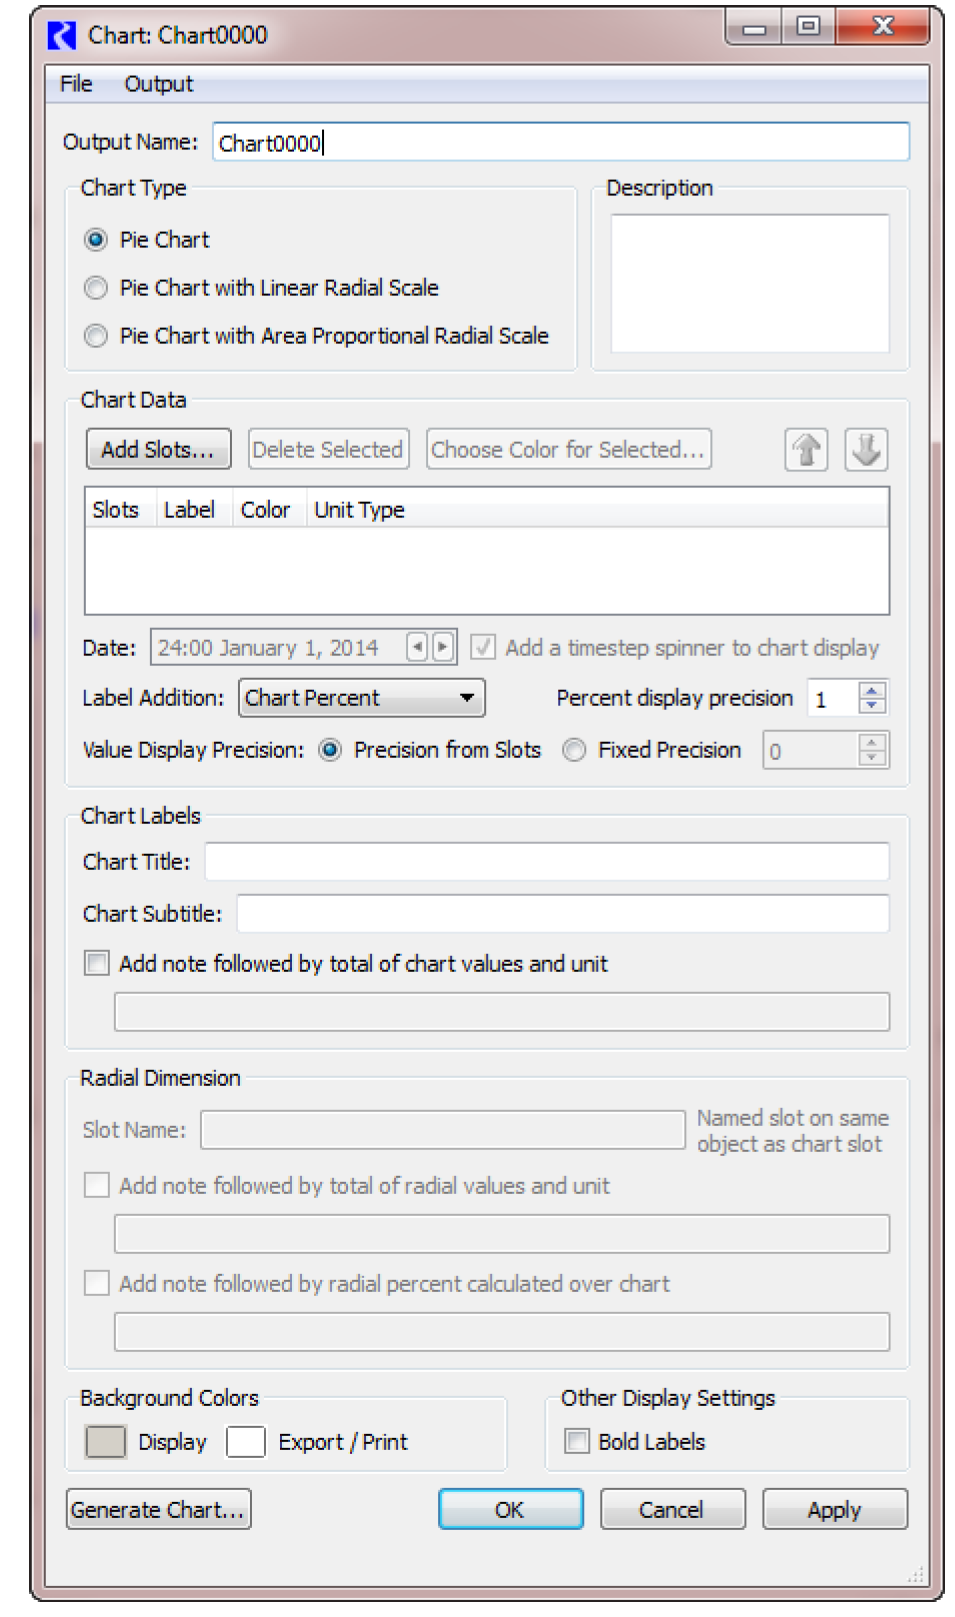
2. Configure the new chart using the dialog. See “Configuring Charts” for details.
3. Once configured, select Ok (The output device window closes and its name turns black in the Output Manager) or select Generate Chart to see the resulting chart.
4. Alternatively, to generate and view the chart, from the Output Manager dialog, highlight the new device, select Generate.
See “Chart” for additional information.
Creating an Output Canvas
An Output Canvas is an output device which generates Teacup diagrams and other data visualization utilities. See “Output Canvas” for details.
New Output Canvas configurations are created within the Output Manager dialog. Use the following steps to create a new Output Canvas.
1. In the Output Manager select New, then New Output Canvas from the menu bar at the top of the dialog.
A new Output Canvas window appears.
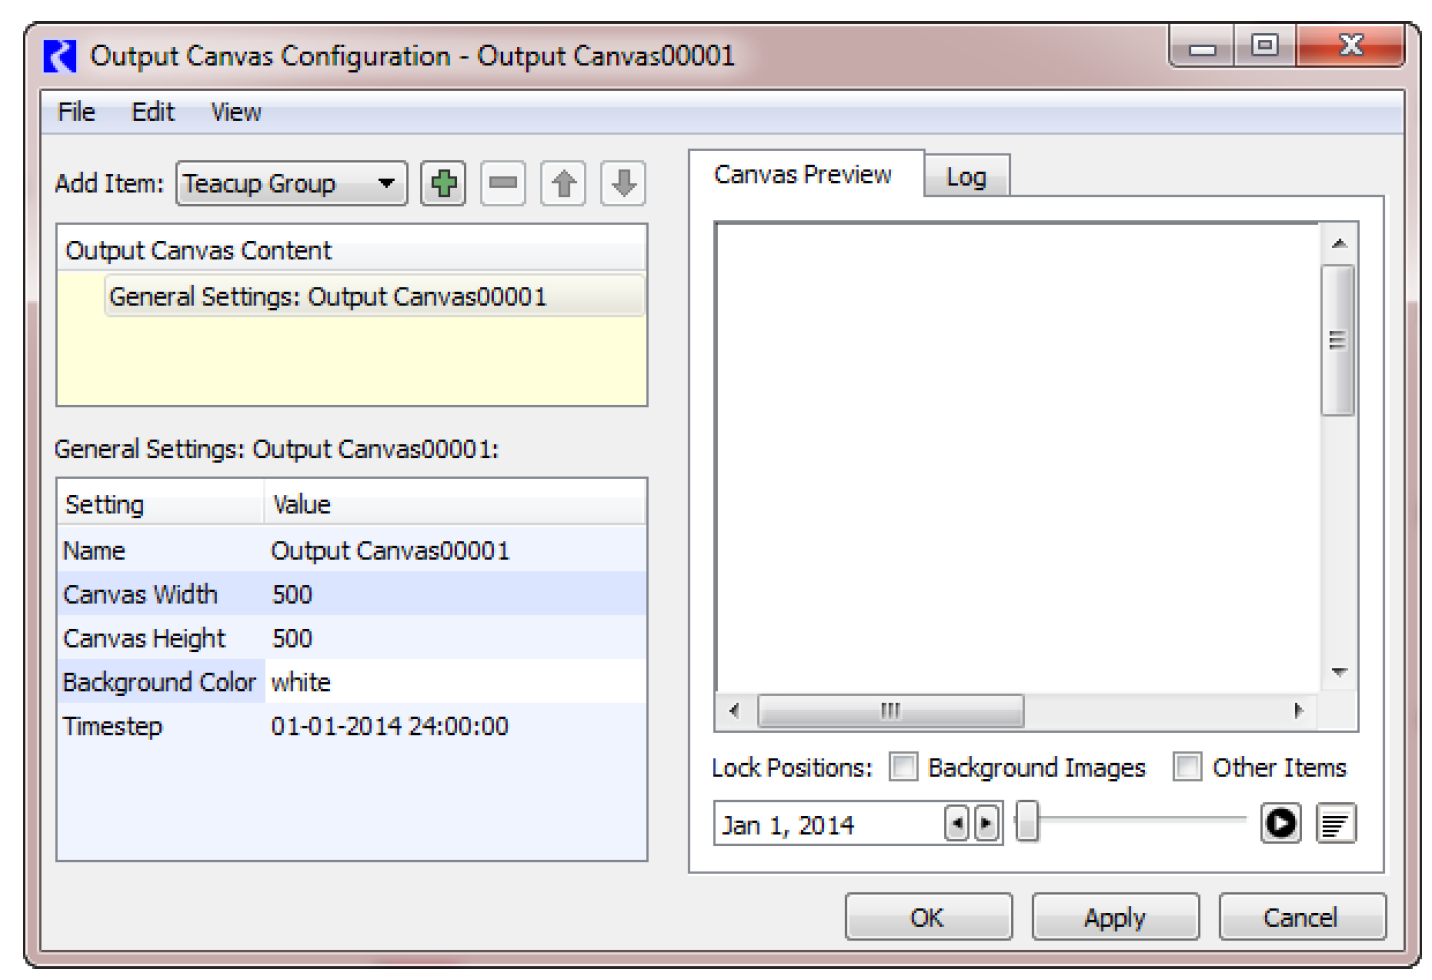
2. Configure the new canvas using the dialog. See “Configuring an Output Canvas” for details.
3. Once configured, select Ok (The output device window closes and its name turns black in the Output Manager).
4. Alternatively, to generate and view the canvas, from the Output Manager dialog, highlight the new device, select Generate.
See “Output Canvas” for additional information.
Revised: 11/11/2019