
Output Utilities and Data Visualization
Chart
The Chart is an output device that generates a chart for data stored in series, periodic, and scalar slots. You can show this for a single timestep or include a date slider which you can also animate. You can even export the chart to an image file or a movie of the animation.
Four types of charts are available for generation from the chart device.
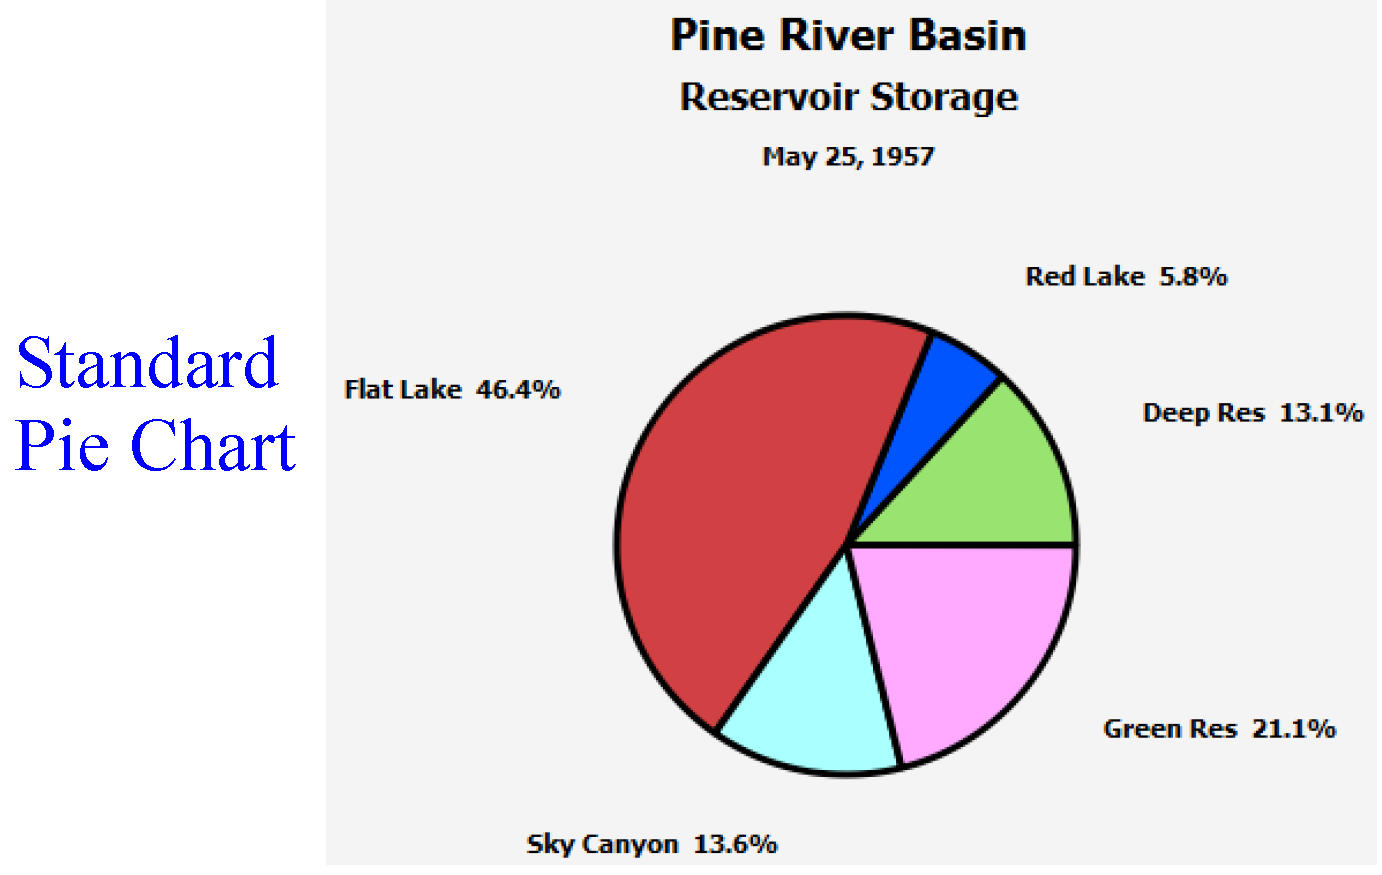
Standard Pie Chart
The slices are drawn and colored in proportion to each slot’s part of the total.
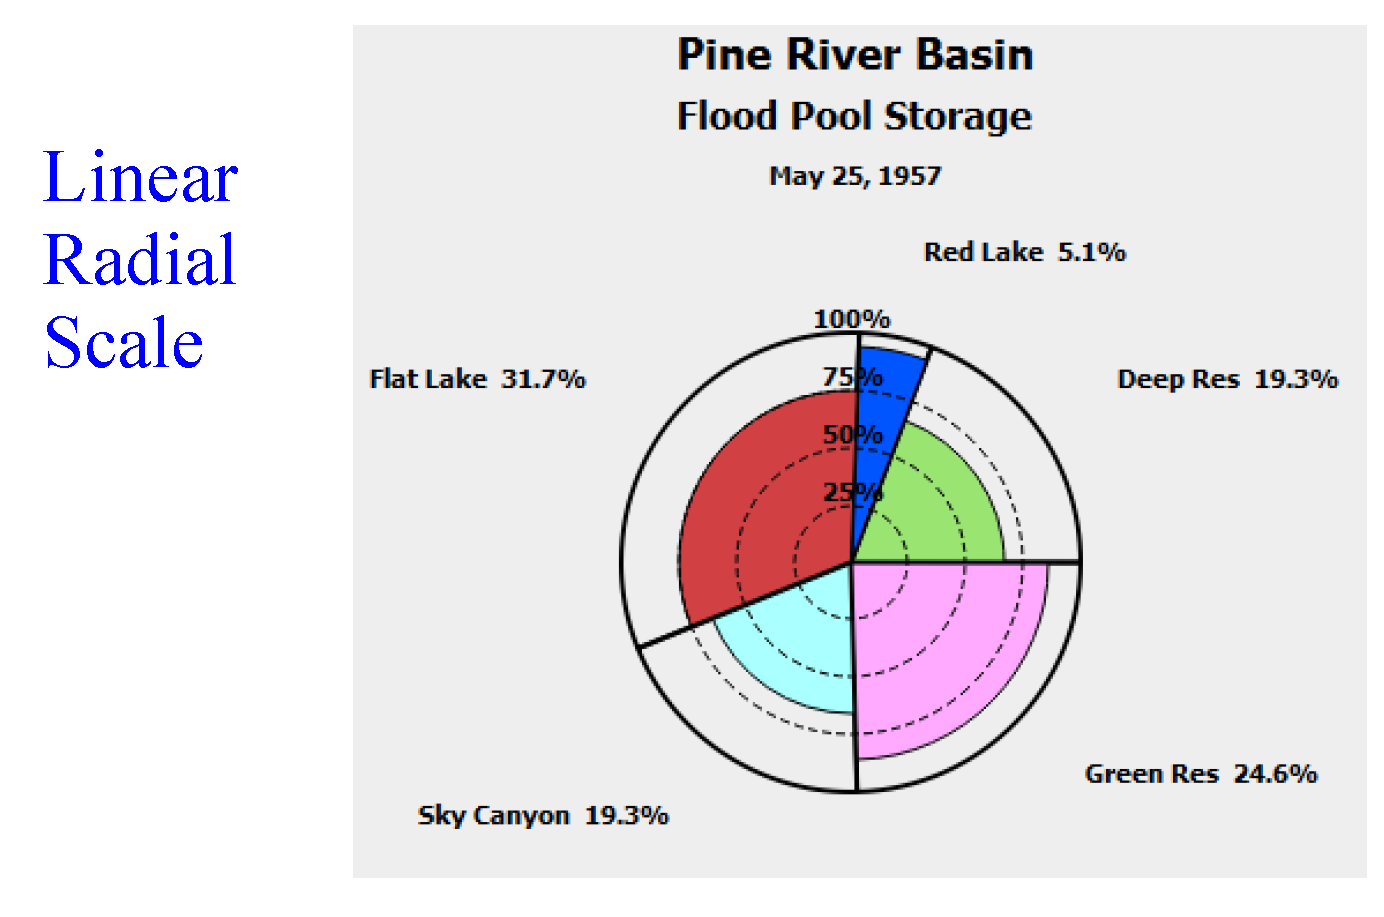
Pie Chart with Linear Radial Scale
The chart shows a radial dimension of data in addition to the data creating the pie slices. For example, the pie slices could show each reservoir’s portion of the total flood pool storage that exists in the basin if all flood pools were filled. The radial dimension could show how much of each reservoir’s flood pool is actually filled at a certain timestep. Only the actual storage part of the pie slice is colored. The radial dimension has a linear scale.
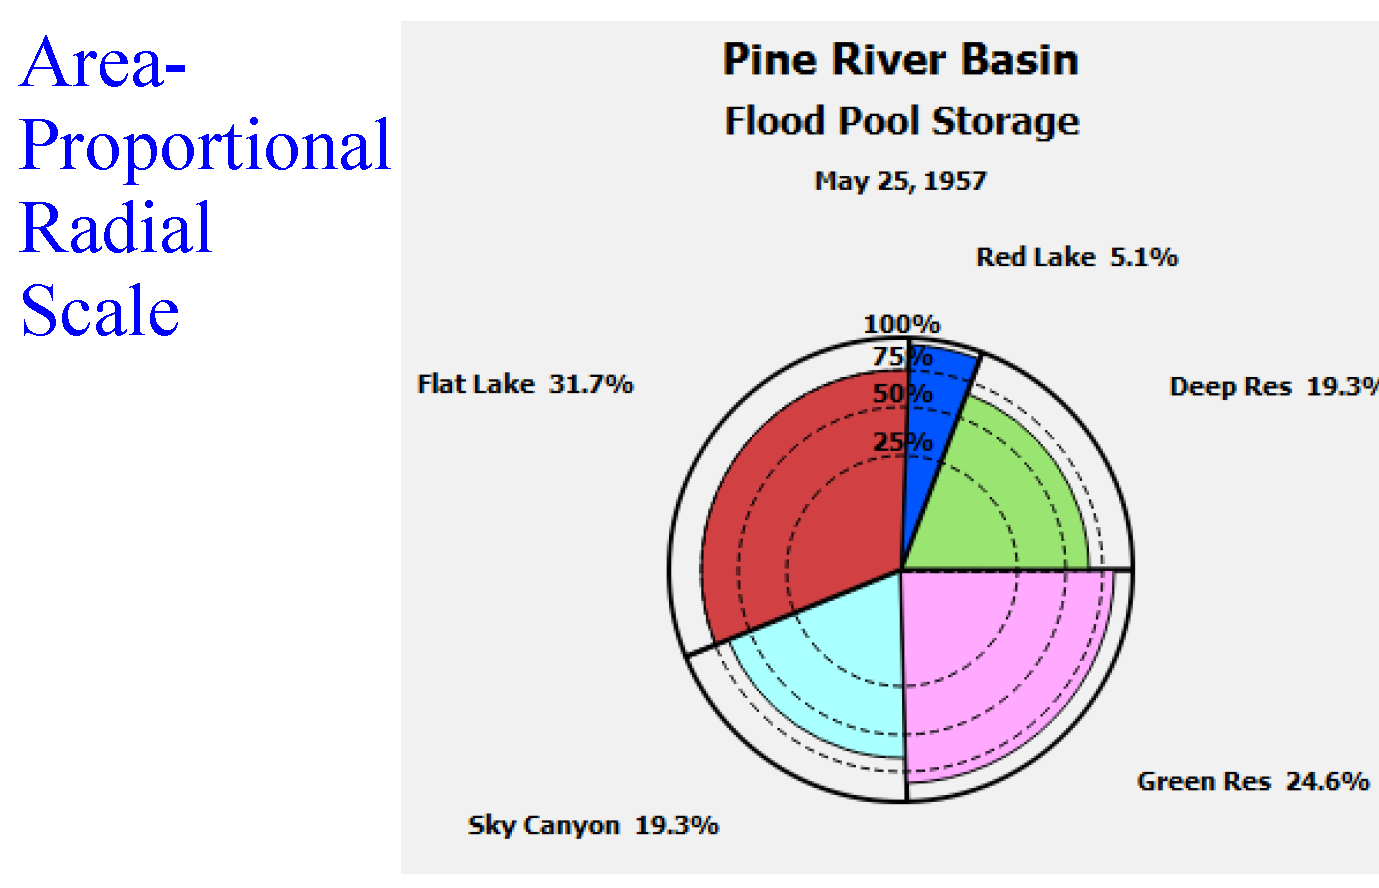
Pie Chart with Area-proportional Radial Scale
This pie chart option is similar to the linear scale but displays the radial dimension as an area-proportional scale.
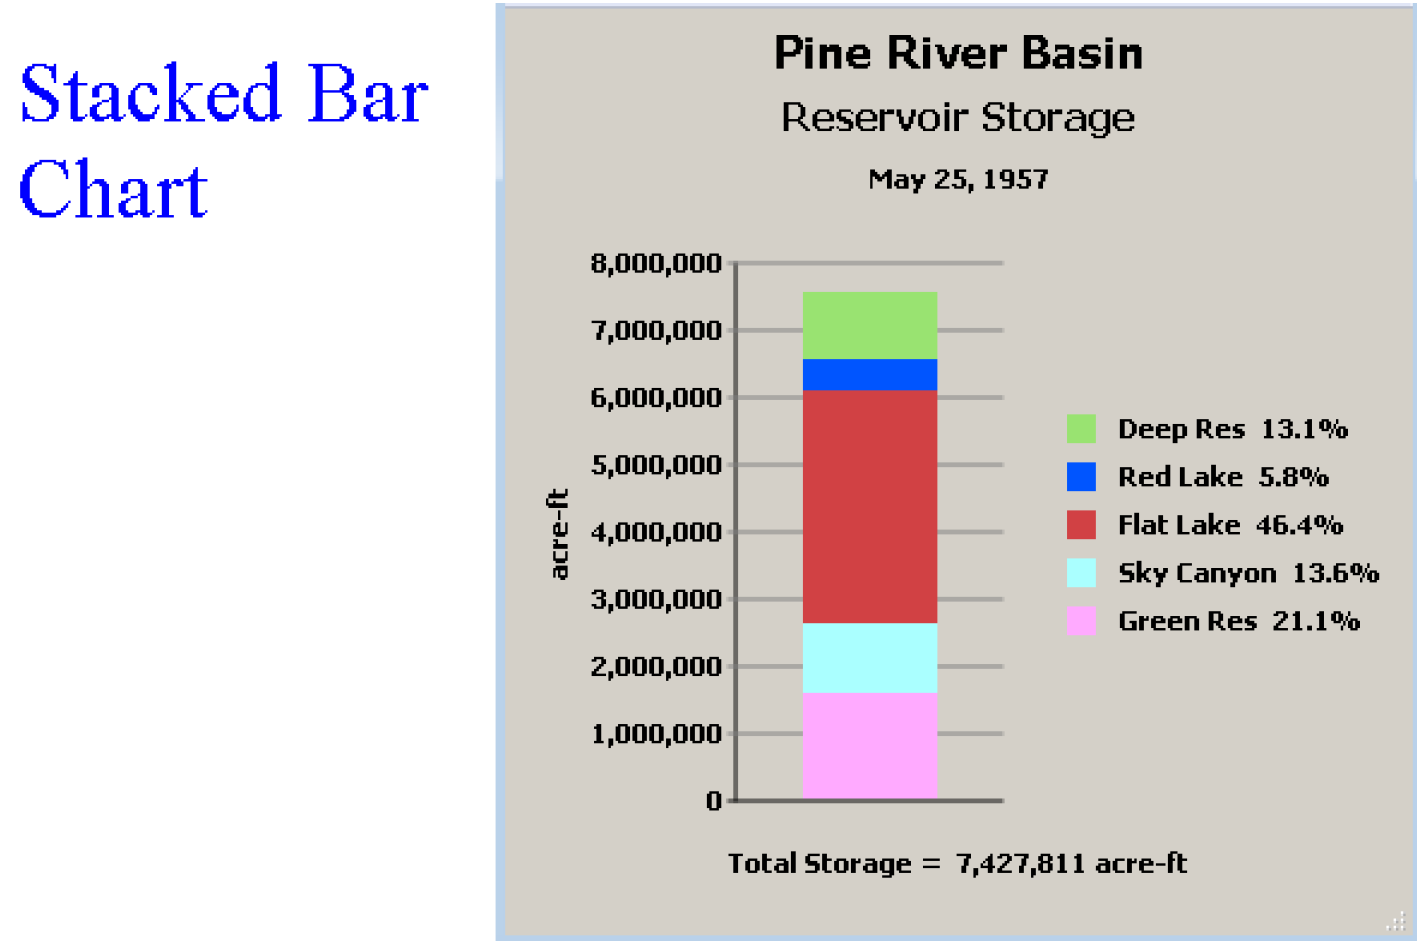
Stacked Bar Chart
A single bar is drawn and colored in proportion to each slot’s part of the total. The chart can accommodate negative values and will display values both above and below a zero line.
Creating a New Chart Configuration
Chart configurations are Output Devices (i.e. like a Plot Page, RiverWare Data File, Comma-Delimited File or Excel File).Chart configurations are created within the Output Manager dialog.
Use the following steps to create a new chart.
1. From the RiverWare workspace menu, select Utilities, then Output Management.
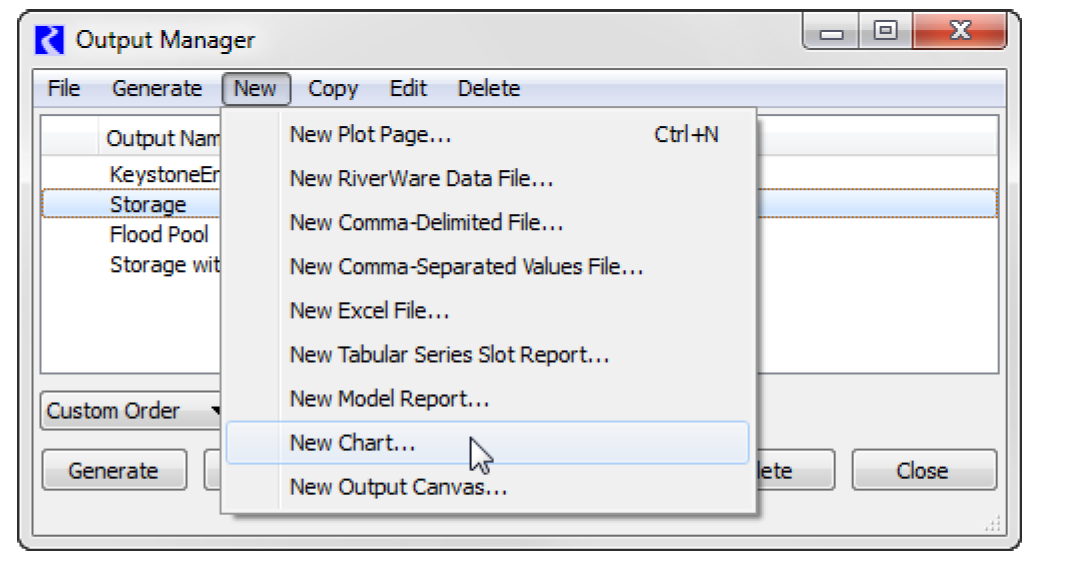
2. From the Output Manager dialog menu, select New, then New Chart.
3. Complete the full configuration for the new chart and select Save. See “Configuring Charts” for details.
Configuring Charts
When creating (or editing) a Chart configuration, the configurable properties of a chart include the following. See Figure 5.1.
• Name of Output Device
• Description
• Chart Type
• Data, including:
– Slots
– Labels
– Colors
– Label Location
– Label Addition
– Display Precision
• Radial Data, if applicable, including:
– Radial Slot Name
– Note for Radial Total
– Note for Radial Percent
• Chart Settings
– Chart Title
– Chart Subtitle
– Note for Chart Total
– Background Color for display and printing
– Other settings including Bold Labels
– Display Date
– Option to show timestep controls and timestep
• Fonts, used to control the size and font used for all text shown on the chart.
Figure 5.1
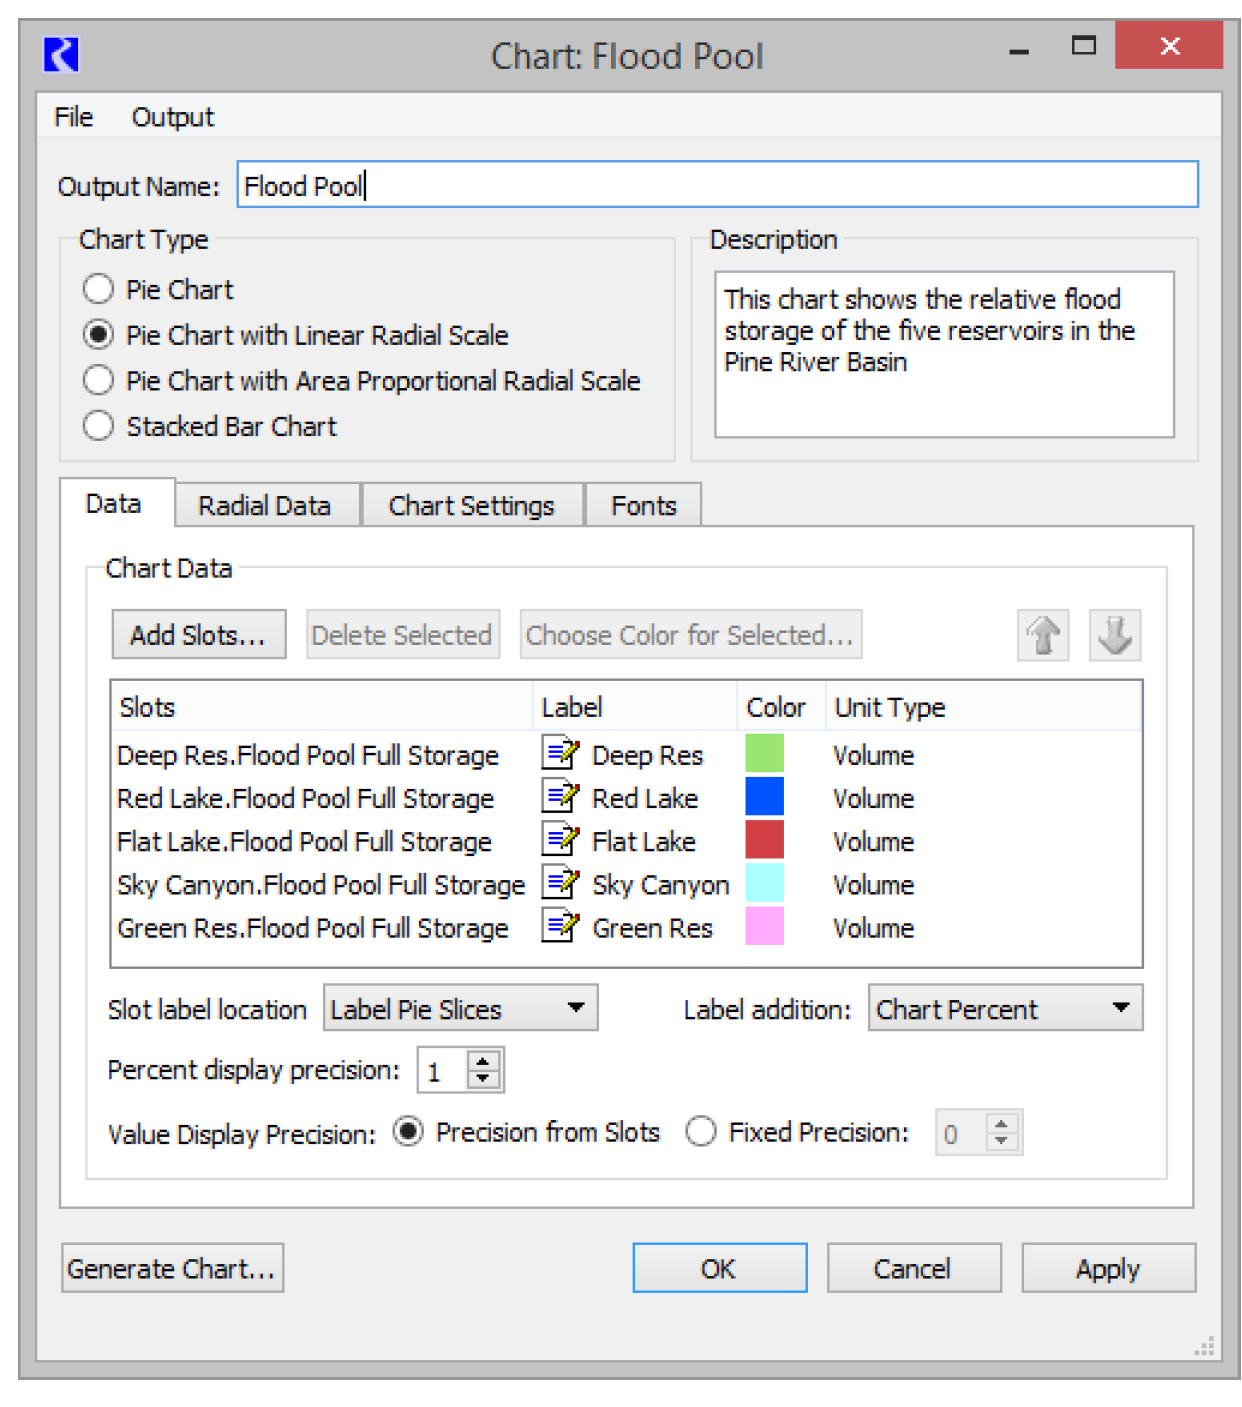
Following are descriptions of these options.
Output Name
Output Name is the name of the device that will appear in the Output Manager’s list of devices.
Description
The Description box allows text describing the chart to be saved with the device - this text does not appear on the chart itself.
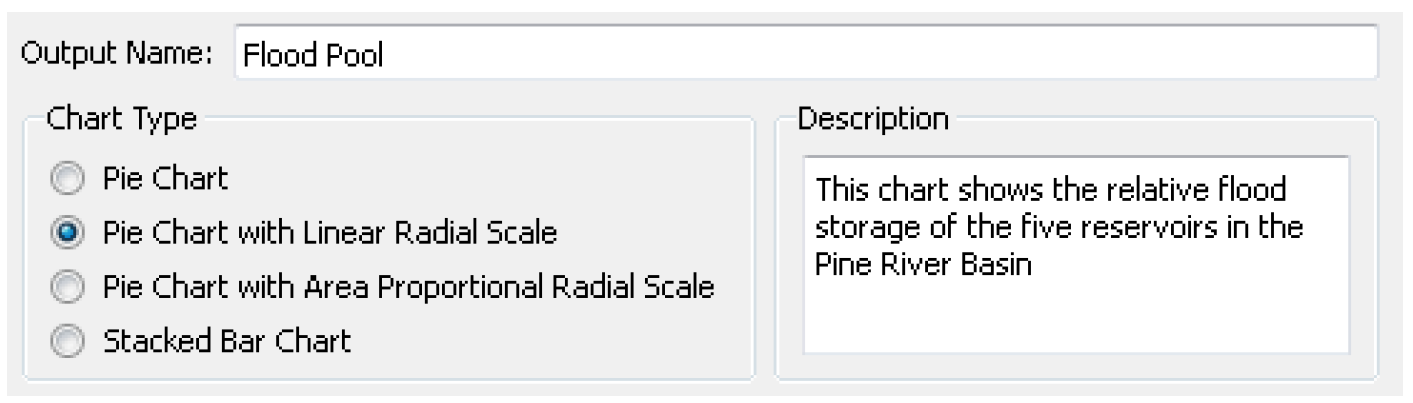
Chart Type
Chart Types specify one of the chart types as shown. See “Chart” for descriptions.
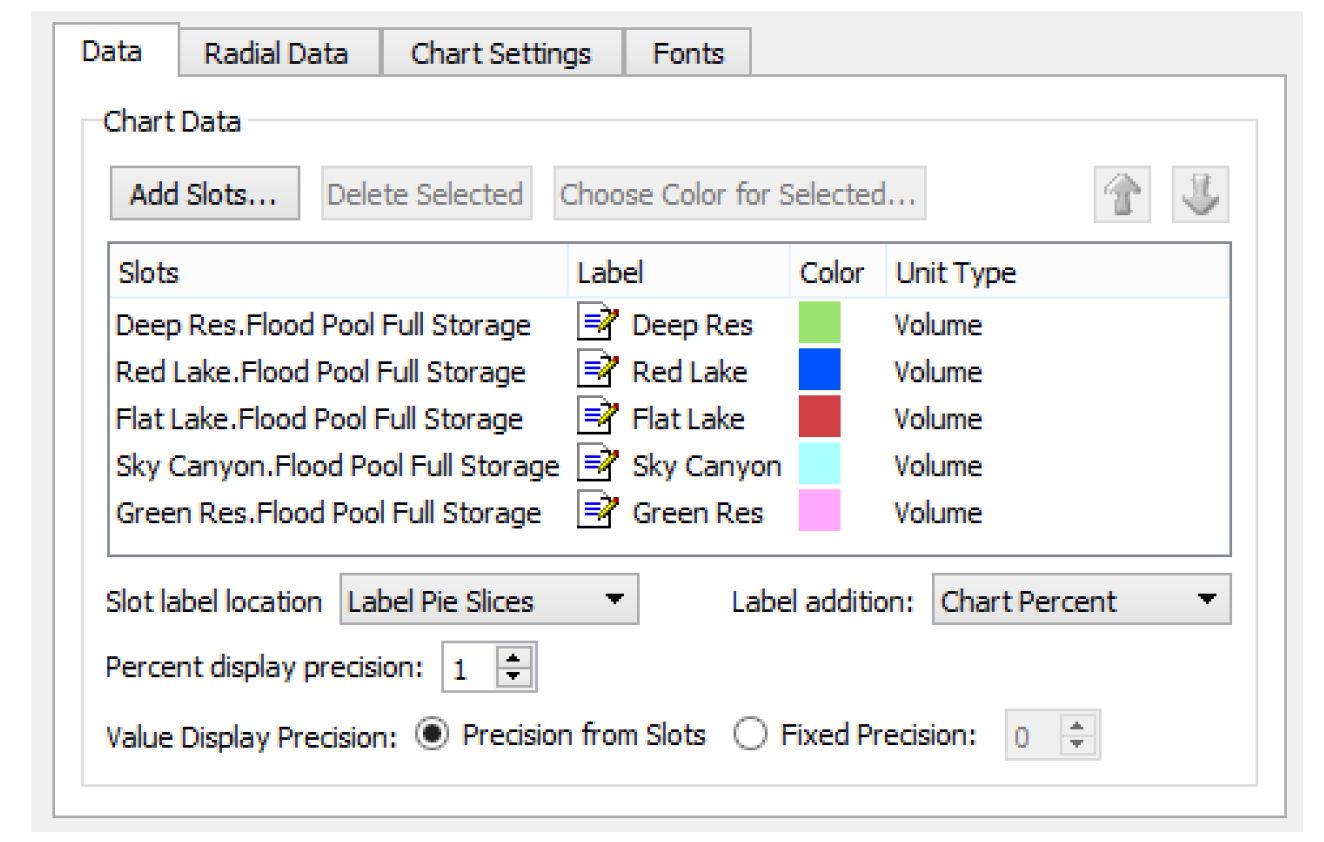
Data Tab
The Chart Data frame contains the slots to be shown as the main dimension of the chart. Select Add Slots to open a slot selector to select series, periodic, or scalar slot data for inclusion in the chart. The slot/row is given a default Label that will appear on the chart. Selecting or double-clicking the label allows editing of the text. Colors can be changed by selecting a row and selecting Choose Color for Selected. The Unit Type of the slot is shown for reference. If unit types do not match for selected slots, a warning dialog is generated as a chart cannot be created from slots with mismatched unit types.
Figure 5.2
Note: See “Output Devices for Aggregated Values” for details on creating aggregated data for display in this or other output devices.
Slots are ordered in the chart by the order in the slot list. The slot order can be rearranged by selecting rows and selecting the Up and Down arrows. In a pie chart the first piece of the pie starts at 3 o’clock and then proceeds counterclockwise (anticlockwise).
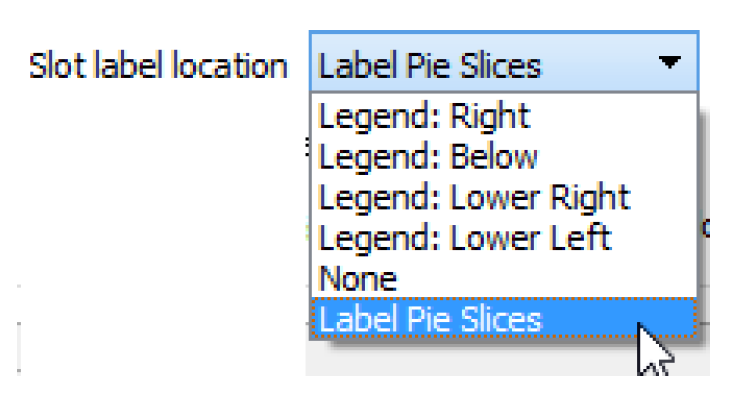
The Slot Label Location combo box allows a choice of where the slots will be labeled on the chart. See Figure 5.3.
• Legend: Right shows a color block and the slot name for each slot in a legend positioned to the right of the chart.
• Legend: Below shows a color block and the slot name for each slot in a legend positioned directly below the chart.
• Legend: Lower Right shows a color block and the slot name for each slot in a legend positioned below the chart and to the right of any timestep controls being shown.
• Legend: Lower Left shows a color block and the slot name for each slot in a legend positioned below the chart and to the left of any timestep controls being shown.
• None: No legend or labels are shown. This is often desirable when the chart is included on an Output Canvas and canvas lines are used to label the pie slices.
• Label Pie Slices is only applicable to pie-type charts and places slot labels around the pie at the slice for a slot.
Figure 5.3
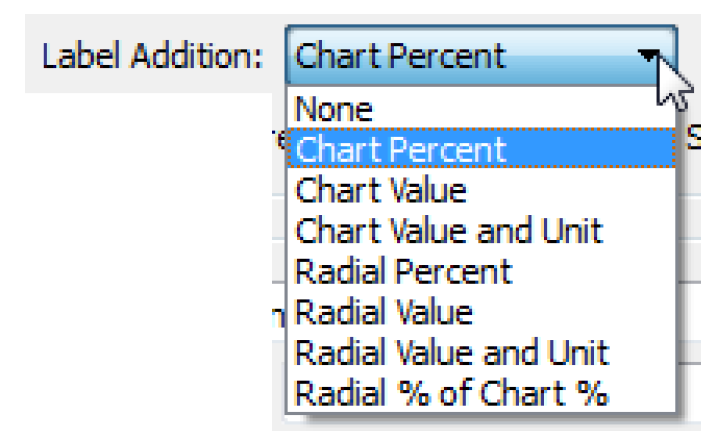
The Label Addition menu provides a choice of items that can be added after the slot labels on the chart. The radial choices are only shown if a radial type chart is selected. See Figure 5.4.
• None adds nothing to the slot label.
• Chart Percent adds the percent of the slot’s contribution to the total (Red Lake 20.4%).
• Chart Value adds the amount of the slot’s contribution to the total (Red Lake 1135358).
• Chart Value and Unit adds the amount of the slot’s contribution along with its unit (Red Lake 1135358 acre-ft).
• Radial Percent adds the percent of the slot’s contribution that is colored in (Red Lake 63.2%).
• Radial Value adds the amount of the slot’s contribution that is colored in (Red Lake 717546).
• Radial Value and Unit add the amount of the slot’s contribution that is colored in along with its unit (Red Lake 717546 acre-ft).
• Radial % of Chart % adds the percent that is colored of the percent contribution to the total (Red Lake 63.2% of 20.4%).
Figure 5.4
The Percent display precision selector controls the precision with which percent values in labels are shown. Two options are provided for specifying the precision of values shown in labels. The Precision from Slots option displays a value in the precision that is assigned to the slot from which the values comes. The Fixed Precision option displays all values with the precision specified in the adjacent spin box.
Radial Data Tab
The Radial Dimension frame is enabled only if a radial type chart is selected. The Slot Name field is where the name of the slot for the radial dimension data is indicated. For each slot in the Chart Data list, the corresponding slot is found on the same object as the slot. The radial percent value, determining how much of a slot’s portion is colored, is calculated as the radial slot value divided by the slot value. The unit types of the slot and the radial slot must match or the chart cannot be generated.
Figure 5.5
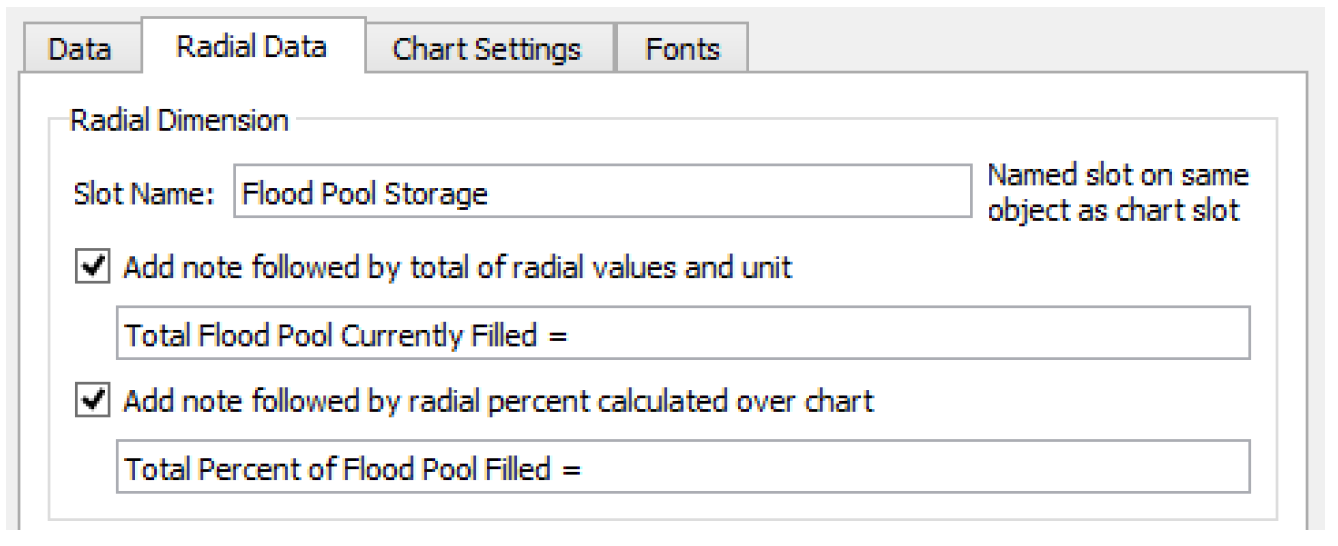
There are also options to add radial notes to the bottom of the chart display.
• Add note followed by total of radial values and unit - the text is shown as a note followed by the total of all the radial slot values on the chart along with the unit. (Total Flood Pool Currently Filled = 353407 acre-ft).
• Add note followed by radial percent calculated over chart - the text is shown as a note followed by a percent calculated as the total of all radial slot values divided by the total of all chart slot values (Total Percent of Flood Pool Currently Filled = 63.5%).
Chart Settings tab
The Titles and Text frame allows entry of text for the Chart Title that is centered at the top of the chart display and the Chart Subtitle that appears underneath it. Also in this frame is the option to Add note followed by total of chart values and unit. When checked, the entered text is shown as a note on the bottom of the chart followed by the total of all slots’ values with its unit. (Total of Flood Pool for Pine River Basin = 5,565,480 acre-ft).
Figure 5.6
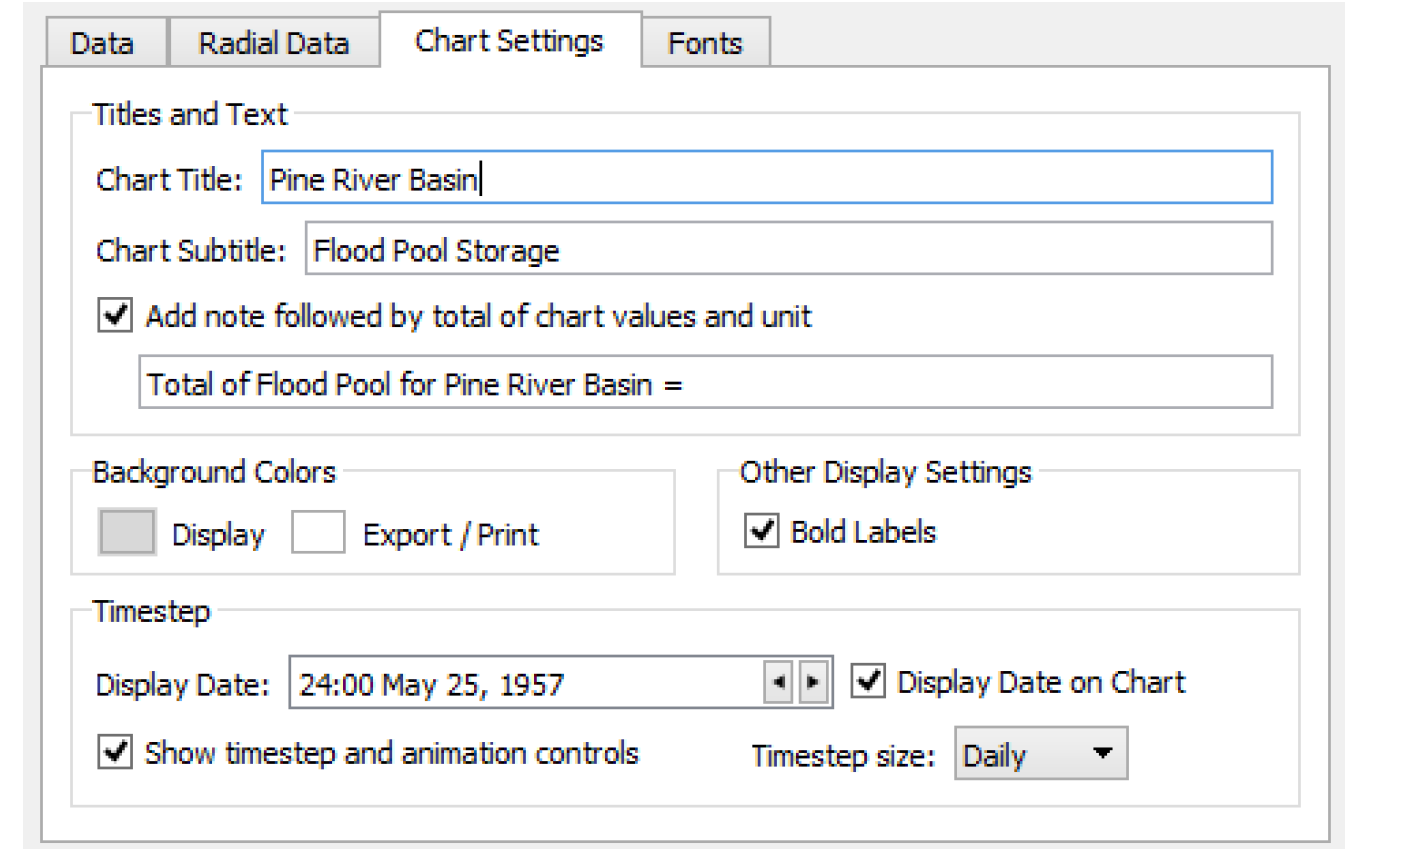
Use the two buttons in the Background Colors frame to change the color of the background for display (on screen) and for exporting and printing.
In the Other Display Settings frame, you can choose whether or not to have Bold Labels on the text displays.
In the Timestep frame, use the Display Date field to specify the date at which data is shown. Also, optionally specify if you would like to Show timestep and animation controls. These controls allow you to step through timesteps on the chart. See “Animation” for details. In addition, if you would like to show only data for a larger timestep, select an alternative Timestep size. For example, maybe in a model with a 1 Hour timestep, you only want to step through the data at the end of each day. If you do select a larger timestep, the chart will be shown at the Display Date rounded up, if necessary, to the next valid timestep. If you don’t want to show the date on the chart, deselect the Display Date on Chart control.
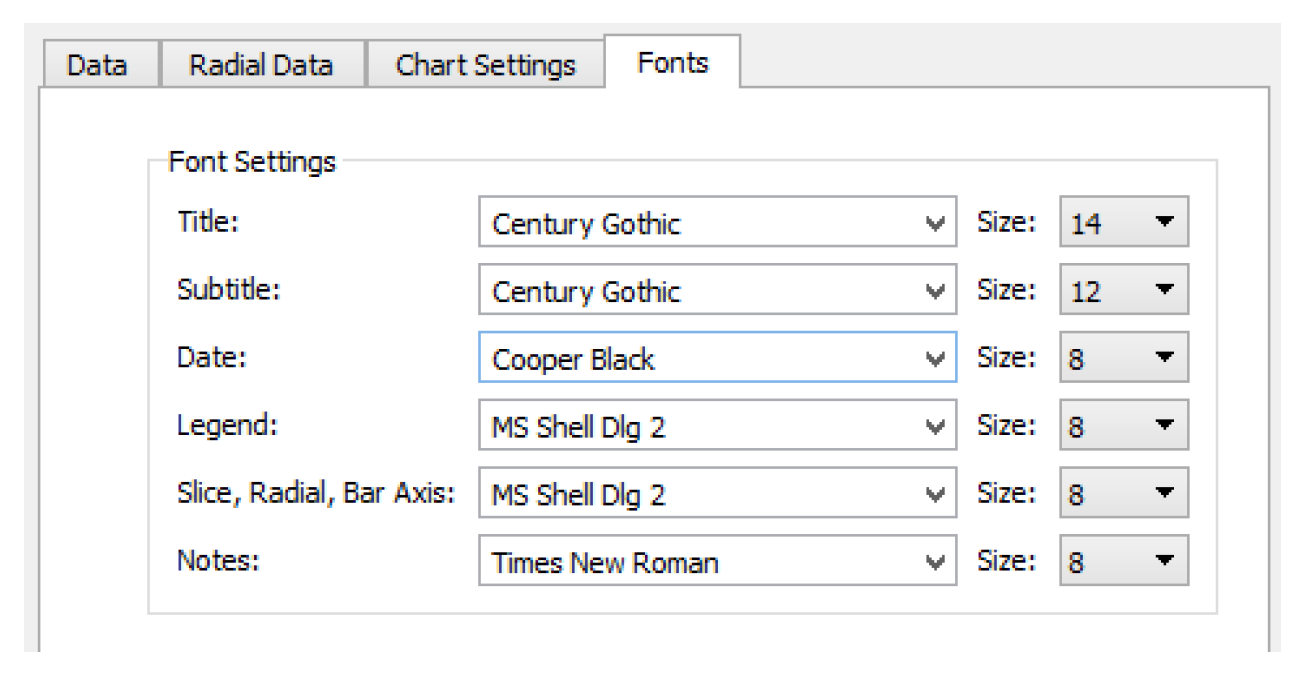
Fonts tab
The text fonts can be changed by selecting Fonts. In each text element menu, select a named font, and in the associated Size menu select the font size.
Figure 5.7
General Buttons
The chart is shown by selecting Generate Chart at the bottom of the dialog. Once a chart display is generated, it is updated with future configuration changes made in the configuration dialog when the chart is regenerated.
Select OK to save the current configurations to the output device and close the dialog. Selecting Cancel will ignore any unsaved configuration changes and close the dialog. Apply will save the current configurations to the chart device and leave the configuration dialog open.
Chart Display
When a chart is generated from the chart configuration dialog or from the Output Manager dialog, a chart display dialog is created. Figure 5.8 is a pie chart with a linear radial dimension.
Figure 5.8
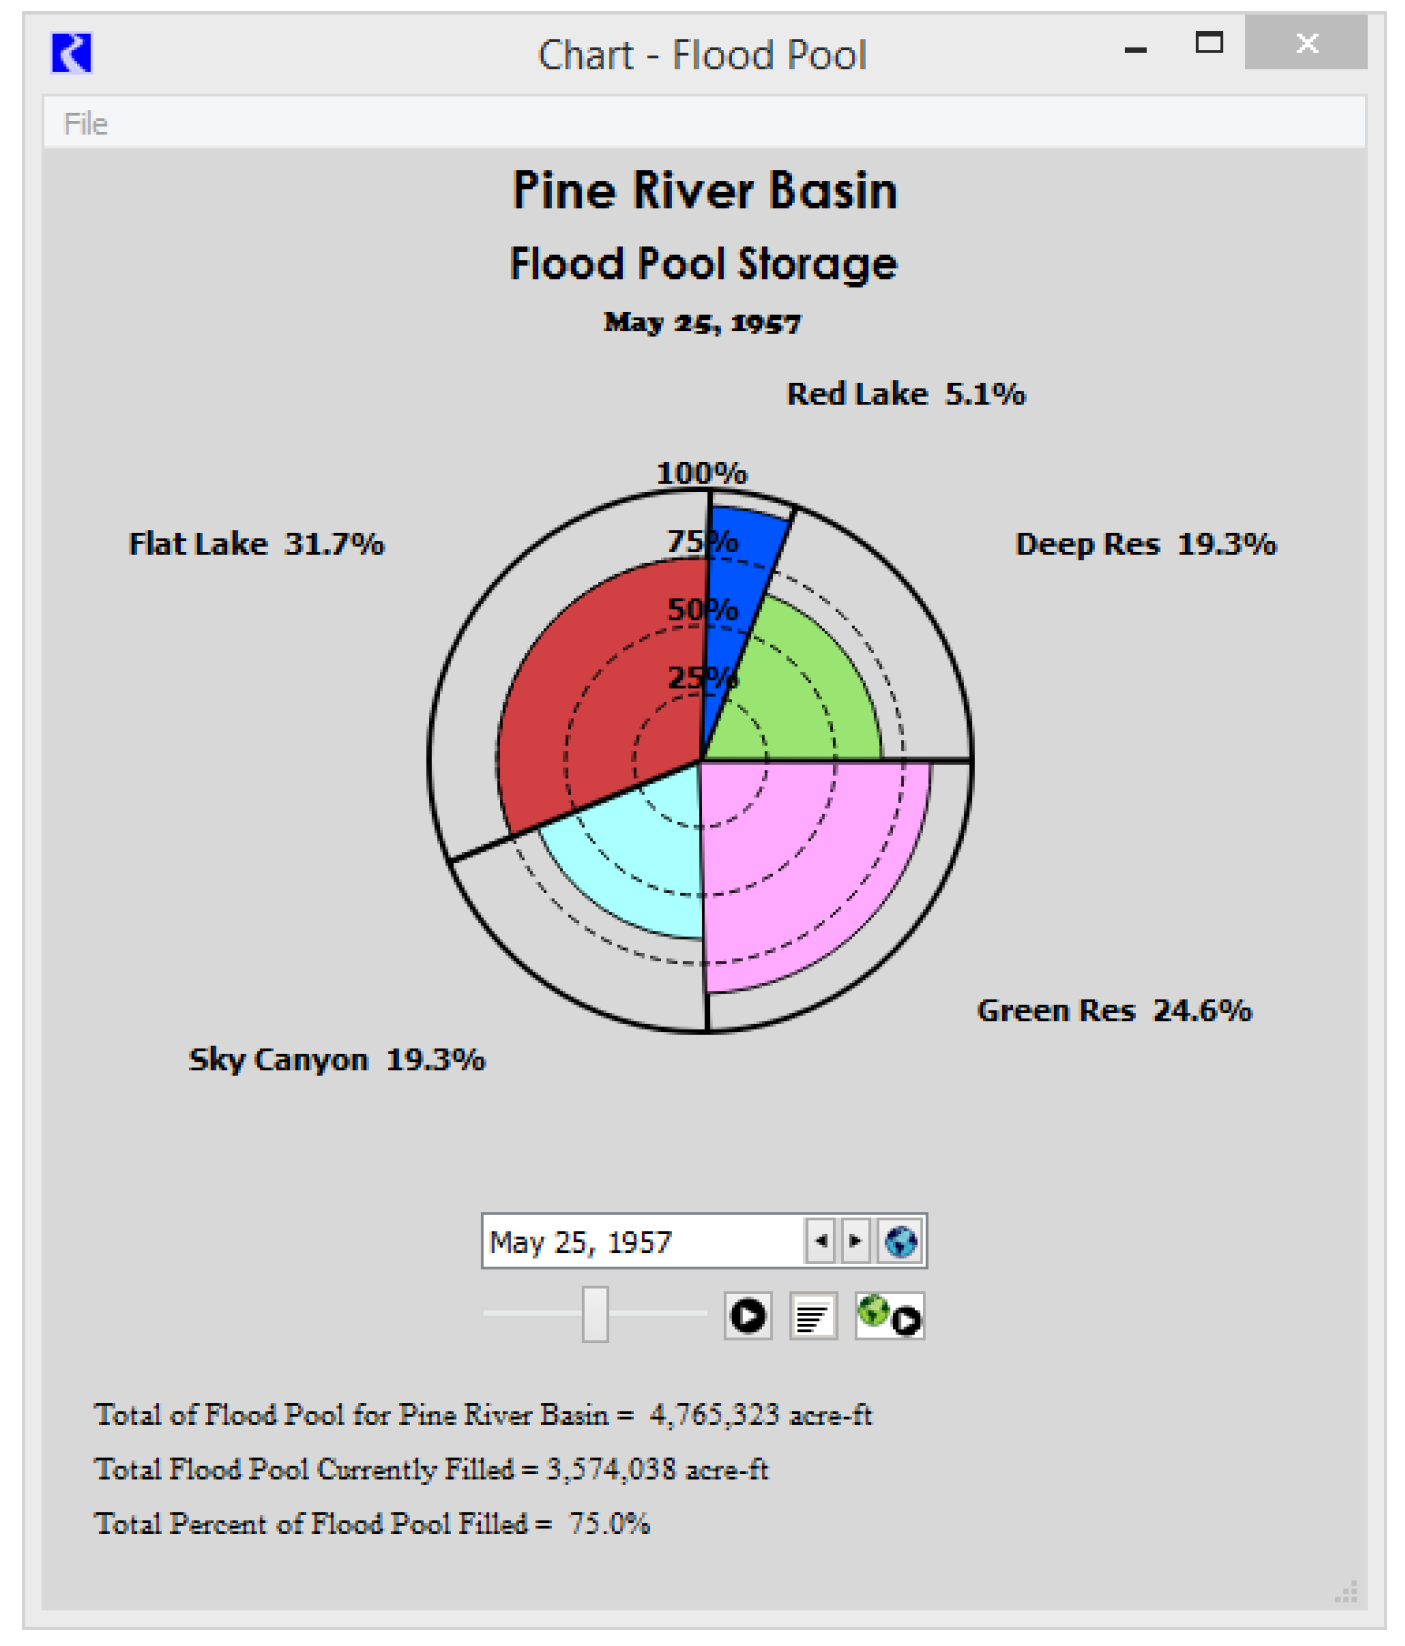
If series or periodic slot data are being displayed, the timestep date for the display is listed under the subtitle. Optional notes that are specified in the configuration are displayed starting in the lower left corner.
Animation
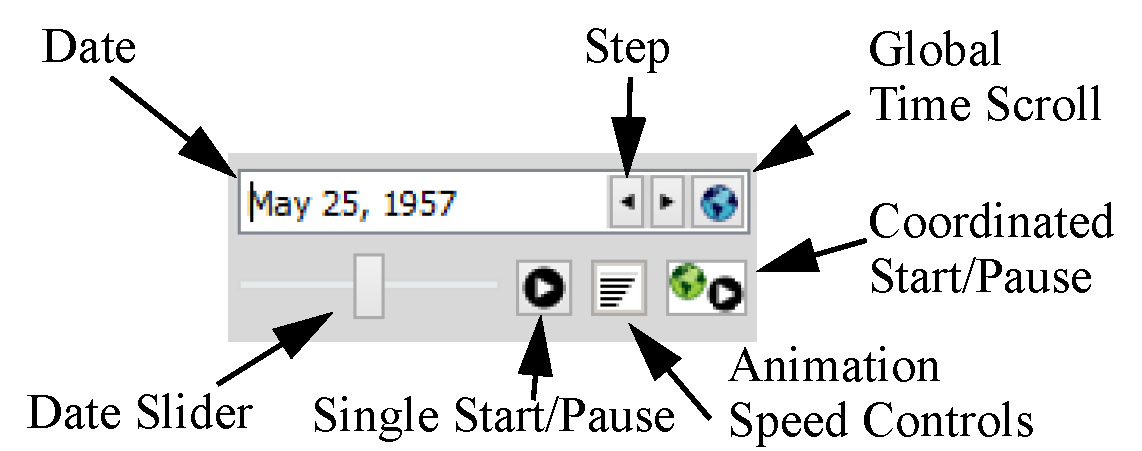
If the timestep controls have been added in the configuration, the controls appears under the chart as shown in Figure 5.9. These controls allow the chart display to be stepped forward and backward through the timesteps. Select Start to animate through time. Use the date slider to see where you are in time and the animation speed controls to change the speed (seconds per frame). Select Coordinated Start/Pause to animate all opened charts and Output Canvas at the same time. When in coordinated animation mode, you can stop all animations from any dialog. But, from the dialog in which you started the global animation, you can select the single pause to pause all dialogs. Then use the slider to move the date for all dialogs globally. Select Coordinated Start/Pause to end the coordinated animation.
Figure 5.9
Exporting and Printing
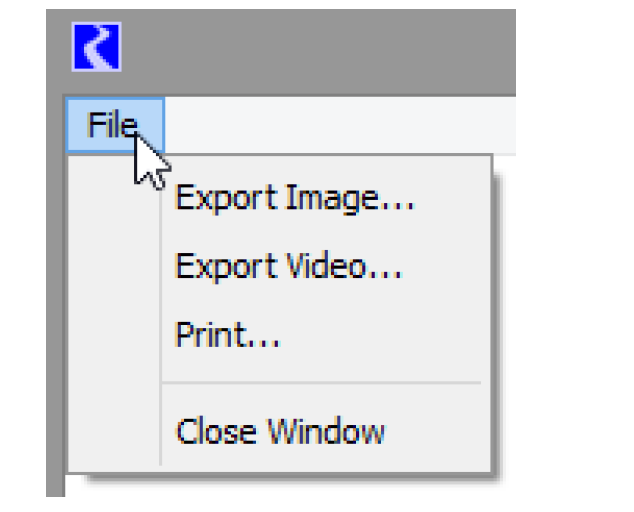
The File menu at the top of the chart display allows the chart to be printed or exported as an image or a video.
Note: When the chart display is printed or saved as an image, the File menu and the date spinner, if present, are hidden. The resulting graphic then shows the date beneath the subtitle. Within the configuration, you can specify the color of the chart background for export and printing. The default is white. See “Configuring Charts” for details.
Export Image
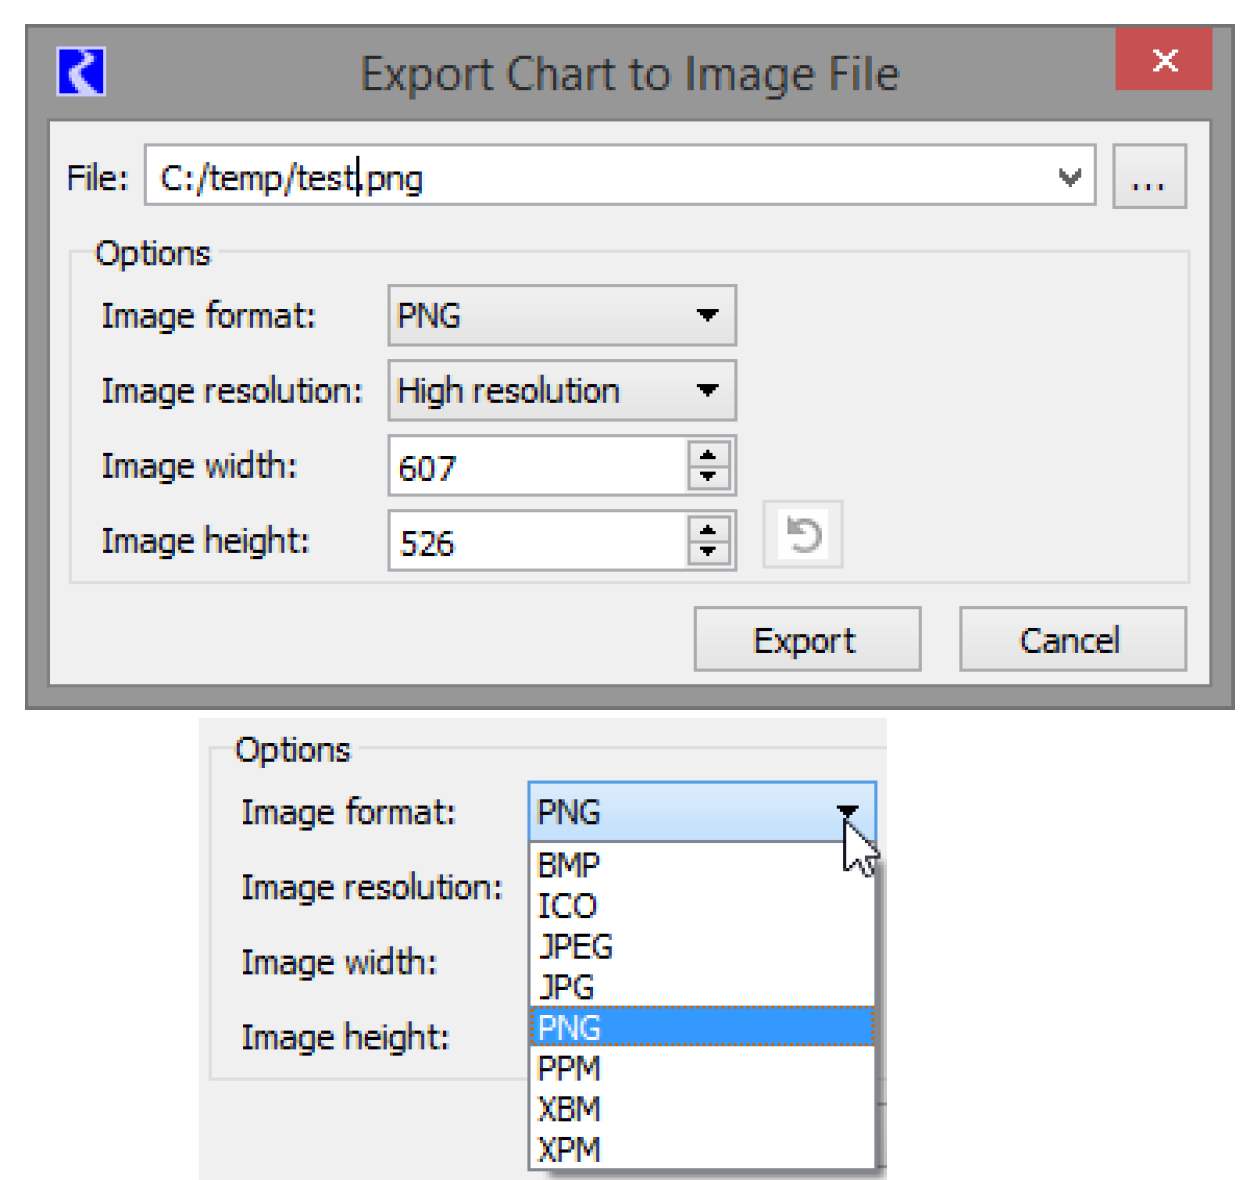
Select Export Image to export an image of the chart to a file. Figure 5.10 shows the Export dialog. Specify the File name and modify any configuration options.
Eight different image formats are available for saving the image file, as shown in the bottom part of Figure 5.10. Resolution and sizing options are also provided in the configuration.
Figure 5.10
Print Image
Standard print options are available to select a printer and then configure the printer.
Export Video
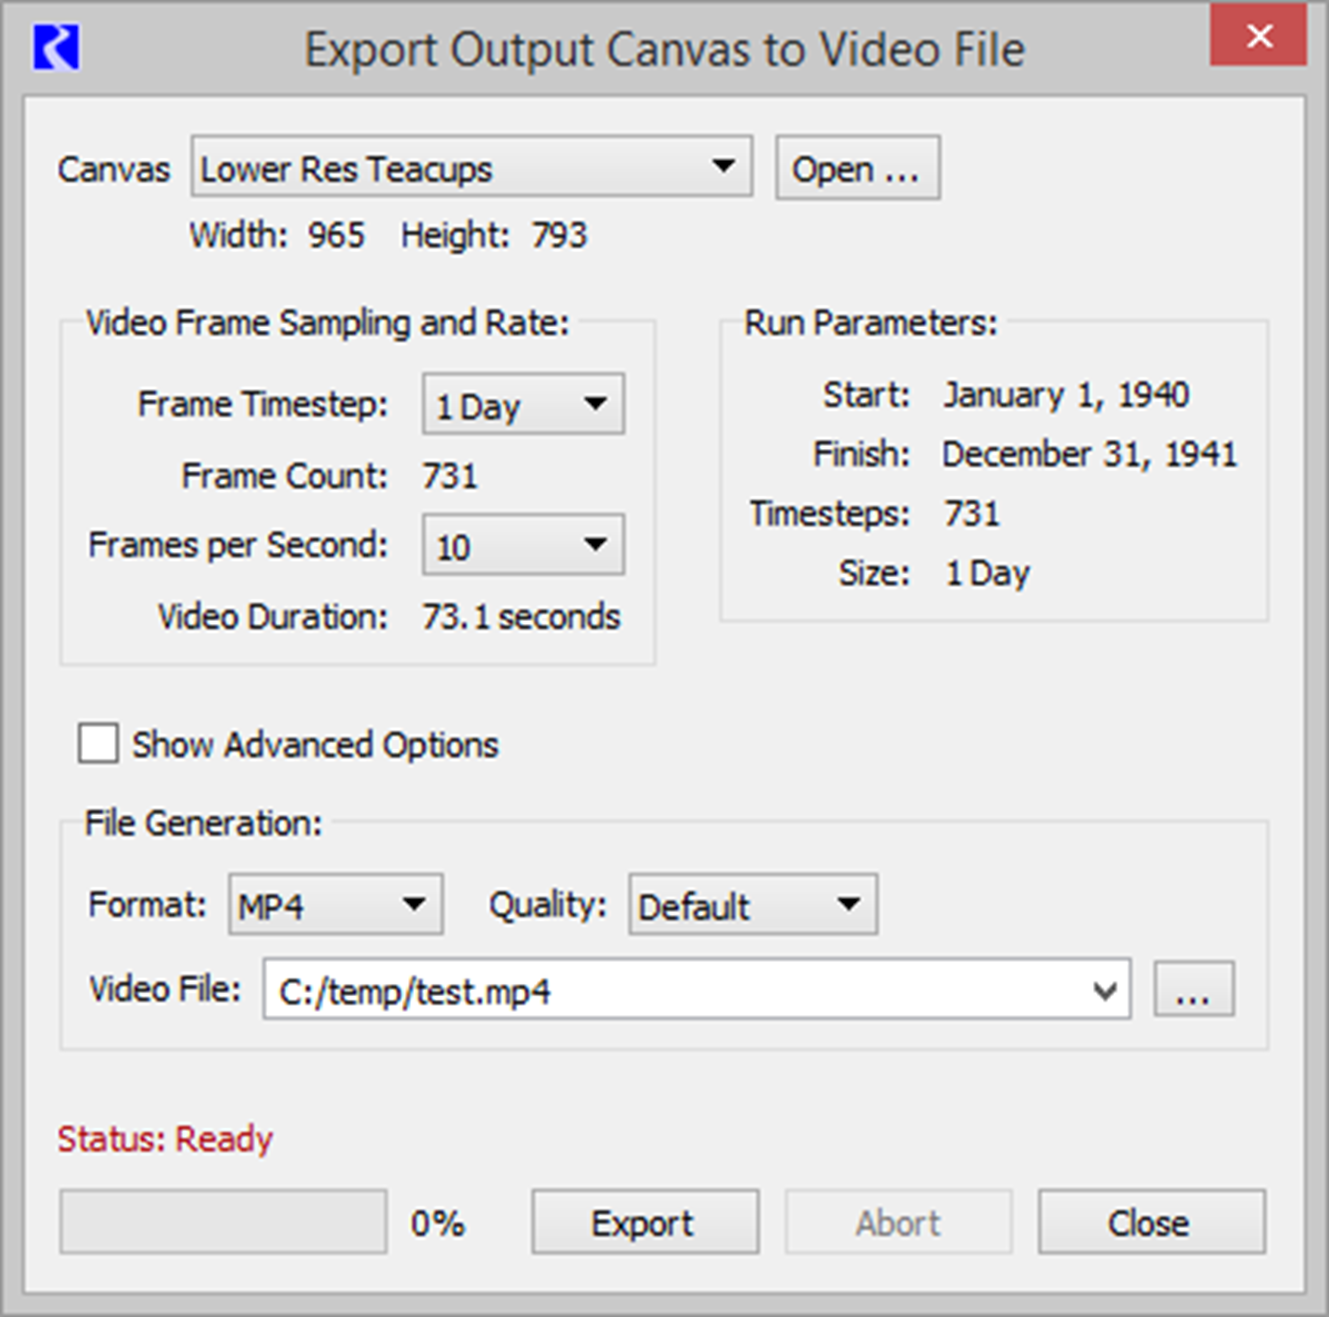
Use the Export Video menu to generate a video file of the chart animation.
This tool works by creating images of the chart at specified intervals as the chart is animated. The images are then combined into a movie file using an external process. You have control over both the sampling of the animation and the creation of the output file.
Figure 5.11
Chart
First specify the desired chart if it is not the one used to open the dialog. The height and width can be changed from the Chart Dialog, but not from this dialog.
Video Frame Sampling and Rate
In this area, you specify how the Chart animation is sampled including the timestep size to use and the speed of the animation in Frames per Second.
For reference, the right side shows the Run Parameters including Start and Finish Timesteps, number of timesteps in the run, and timestep size.
In the left portion, you select the timestep size, either the run timestep size or select a larger timestep size for sampling the animation. The total number of frames is computed based on the run parameters and the timestep size.
Also specify a frame rate for the animation. 5 frames per second is a good starting point.
The video duration is computed based on the frame count and frame rate.
File Generation
File generation can have complicated configuration options because of all the moving parts that must work together. As a result, the dialog provides two ways to configure the output file. The default basic configuration is usually sufficient for most users. Those who want more control over the options can Show Advanced Options to see advanced configuration.
Basic Configuration
The basic configuration provides three configuration options:
• Format: Select from one of the four supported formats. See Table 5.1 for descriptions of the formats and the quality.
• Quality: Select Default, Higher, Moderate, or Lower. This option is not available for GIFs or WEBM.
• Video File: Specify the file to create. Either type it in (include the file extension) or use the file chooser to navigate to the desired directory.
Format | Description and usage |
|---|---|
MP4 | This format displays well in PowerPoint and external players like widows media player. |
WEBM | This format works well when displayed in modern browsers like Firefox or Chrome. It cannot be shown in PowerPoint without an extension. |
WMV | This format displays well in PowerPoint and external players like widows media player. |
GIF | This format is very simple and shows the images repeating over and over, usually in a browser. There are no controls to start/stop/pause the video. Image quality is not as good as other options |
Advanced Options
When you select Show Advanced Options, you have full control over all aspects of the video file generation. Following are descriptions of the elements of advanced configuration.
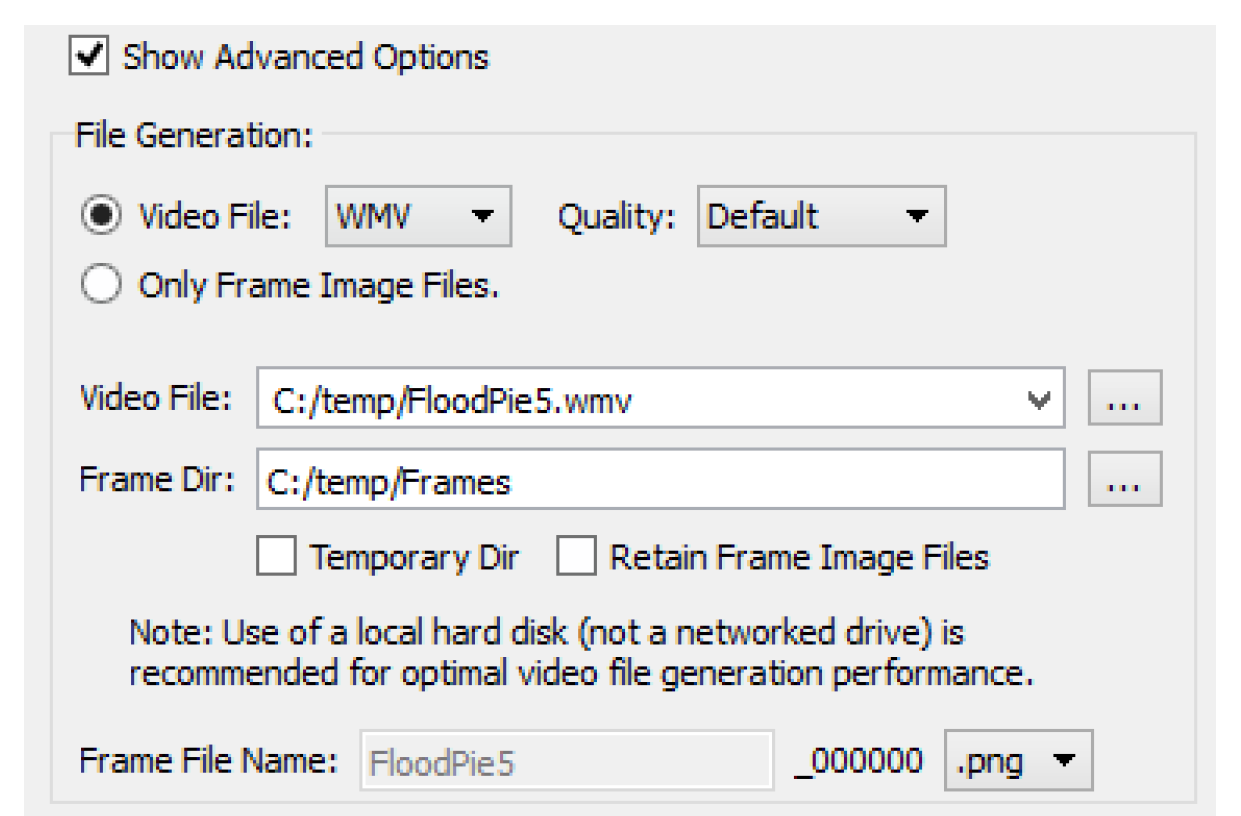
1. Choose whether you want to generate a Video File or generate only the Frame Image Files.
– Video File: Select the Video File format and Quality. See Table 5.1 for descriptions of the formats and the quality.
– Only Frame Image Files: The utility will create only image files at each timestep. They will not be combined into a video file. This option is useful if you have an alternative program that you want to use to assemble the images into a video. When this option is selected, there is no need to specify a Video File name.
2. Specify the location on the file system for the following:
– Video File: The location and name of the video file to create.
– Frame Dir: This shows the directory where the images files will be created. By default, this is the user’s temporary directory. If you deselect the Temporary Dir box, then you can specify any other directory.
3. If generating a video file, you can specify if you would like to retain the created image files by checking the Retain Image Frame Files. If not checked, they will automatically be deleted after the video file generation is complete.
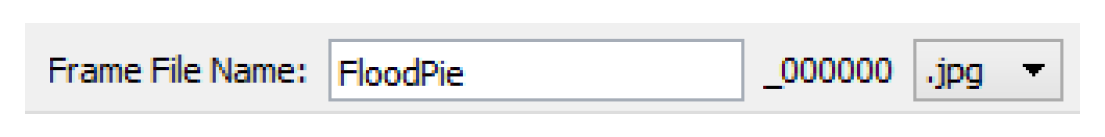
4. If you have selected Only Frame Image Files described above, you can also specify an alternative filing naming convention in the Frame File Name field. You can also choose to use JPG or PNG files.
5. The lower half of the configuration has options for Video File Creation Program Command. This optional panel allows you to further tweak or modify the arguments and commands that are passed to the external program. You can specify either or both of the following elements.
– Extra Global and Input File Options: These options are added to the input side, before the image files are specified. No further information is provided on available options.
– Extra Output File Options: These options are added on the output side, right before the output file specification. No further information is provided on available options.
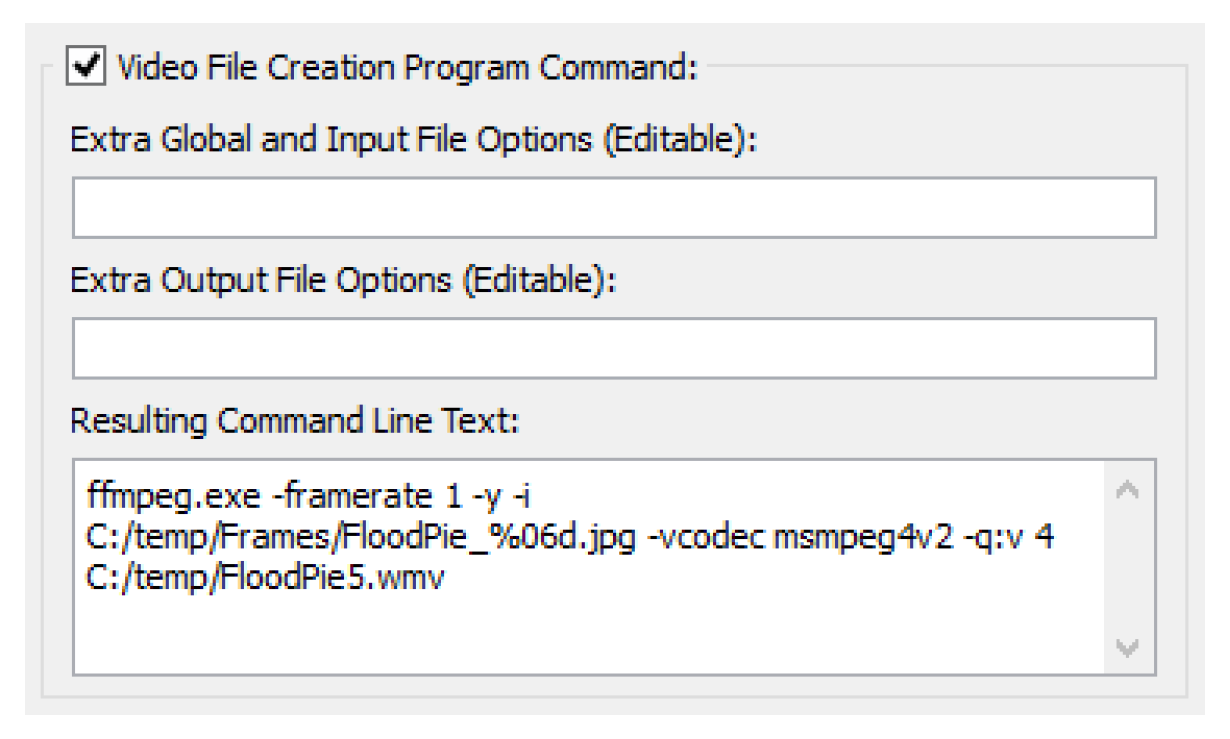
6. The resulting command line is shown in the Resulting Command Line Text field. This shows you exactly what will be executed. Copy is available if necessary.
Creating the Video File
When you choose to create the file by selecting Export, a dialog shows a confirmation before starting the generation. You should not close or resize the Chart dialog during video file generation or the process will be terminated.
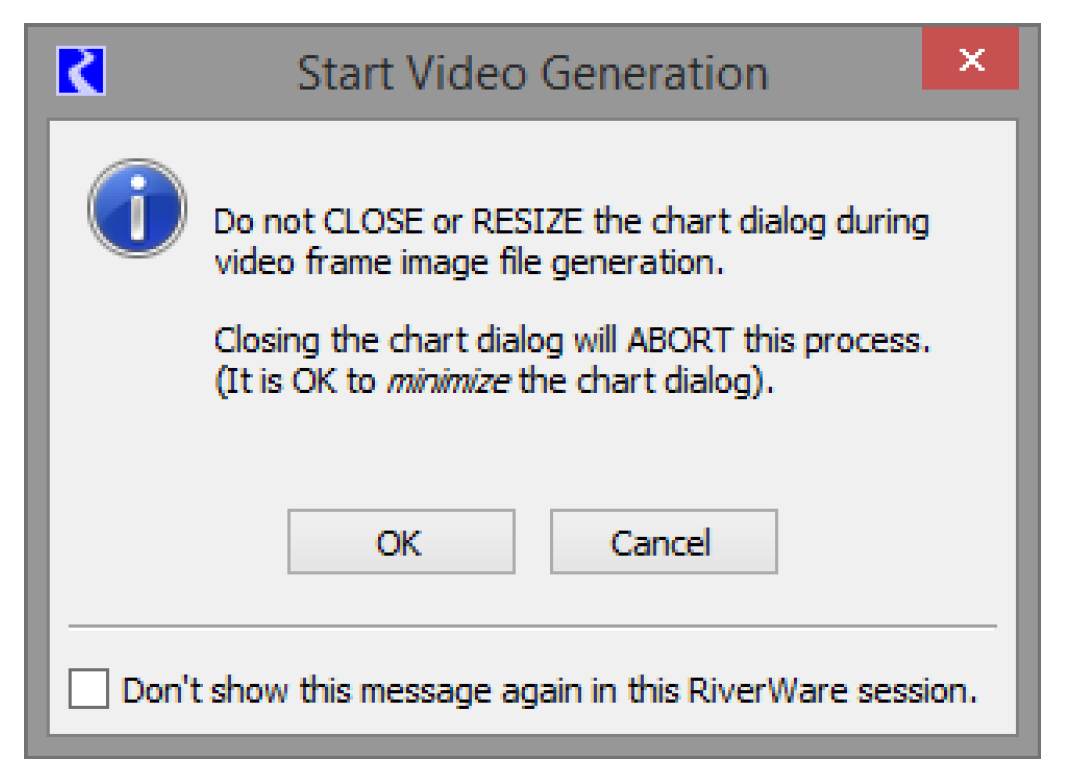
Select OK to generate the video file. The dialog shows the status of the export.
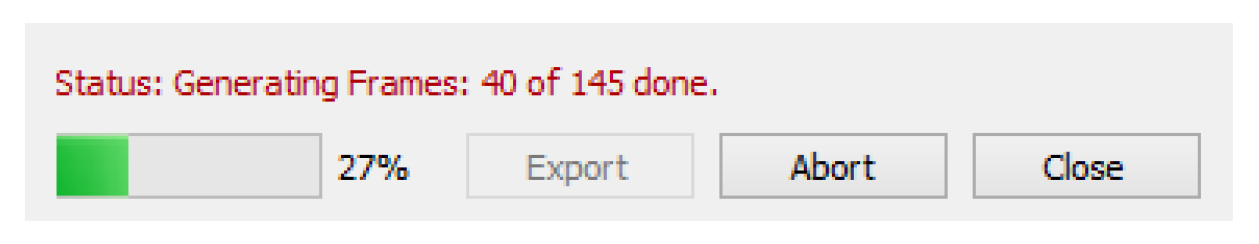
When finished, it shows the following status.
You can now navigate to the directory where the file was exported and view the file in the appropriate application. In addition, a log file is produced in that same directory with further debugging information on the generation process.
Revised: 11/11/2019