
Output Utilities and Data Visualization
Tabular Series Slot Report
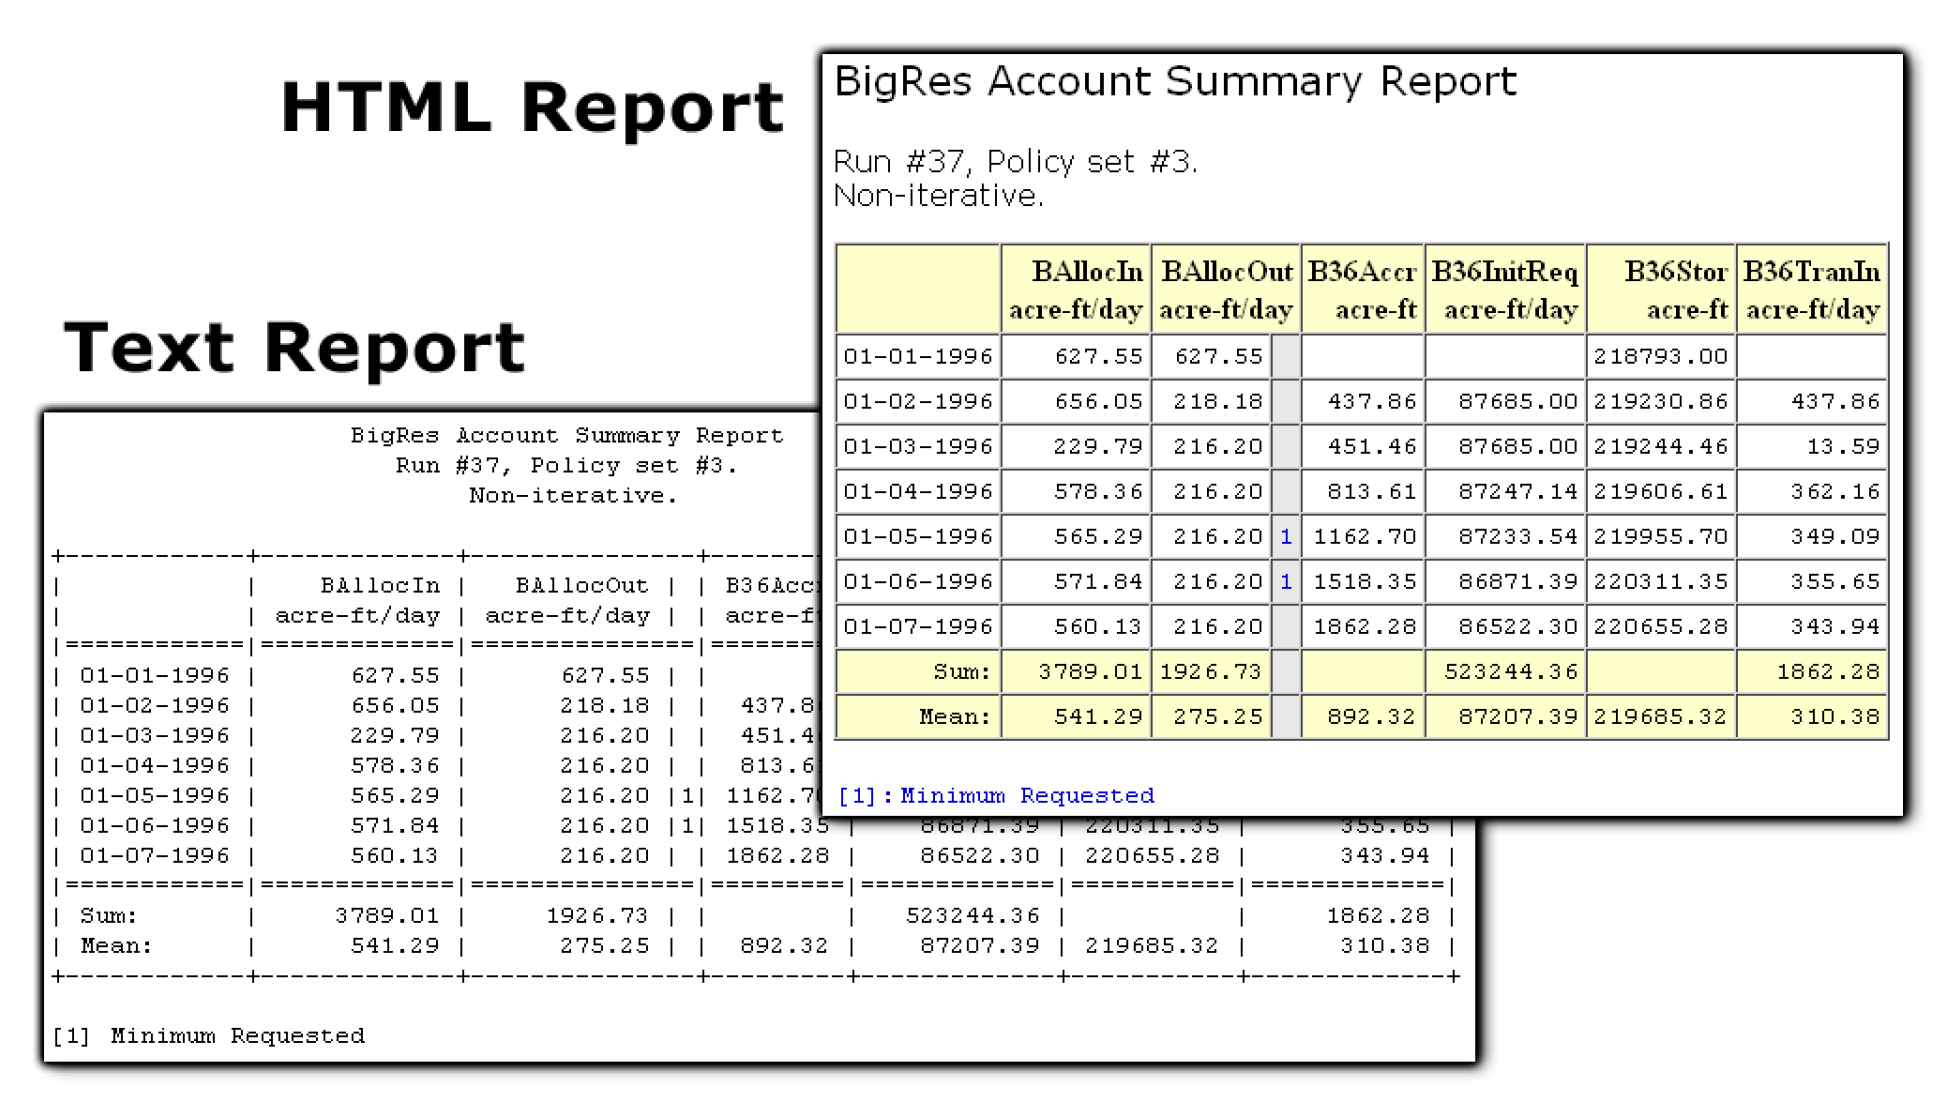
The Tabular Series Slot Report is an output device which generates a plain text or HTML document showing, in a table or multiple tables, values for a set of series slots. The data for each series slot is displayed in one column of the table.
Figure 3.1
The configurable properties of the document include the following:
• Title and subtitle text
• Description
• The ordered list of series slots, and optional alternate column labels for each slot column.
• The series date range (with an option to use the model run date range)
• A choice of showing the full range in a single table, or a separate table for a fixed number of timesteps, or a table for each month.
• When selecting separate tables, the printed output can optionally include page breaks between tables.
• Optional omission of slots having only “NaN” values or only “NaN” or zero values.
• Optional display of NaNs and/or Zeros as blanks.
• For the HTML report, configurable fonts and cell background colors for various types of text and numeric data.
• Optional user specified slot column labels and units
• Optional wrapping of column labels
Creating a new Tabular Series Slot Report configuration
Tabular Series Slot Report configurations are stored within the RiverWare file as an Output Device.
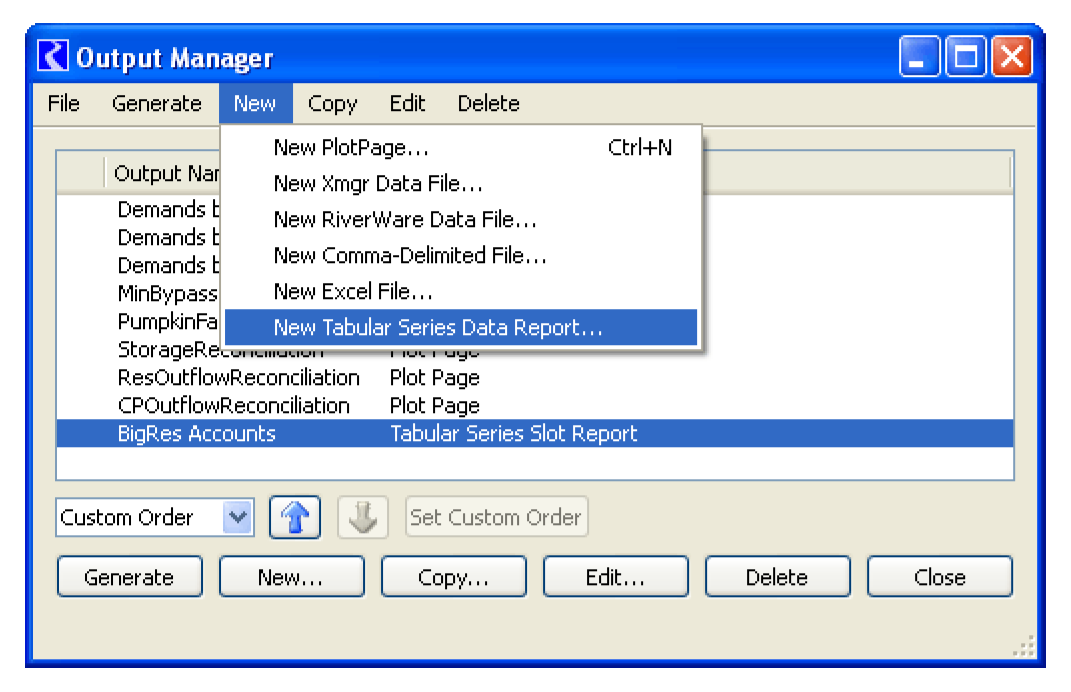
New report configurations are created within the Output Manager dialog. Use the following steps to create a new report.
1. From the RiverWare workspace menu, select the Utilities, then Output Management.
2. From the Output Manager dialog menu, select the New, then New Tabular Series Slot Report.
3. Fill out the full configuration for the new report and select Save. See “Generating Tabular Series Slot Reports” for instructions.
Configuring Tabular Series Slot Reports
When creating (or editing) a Tabular Series Slot Report configure these four tabs:
• Titles
• Settings
• Slots
• Output
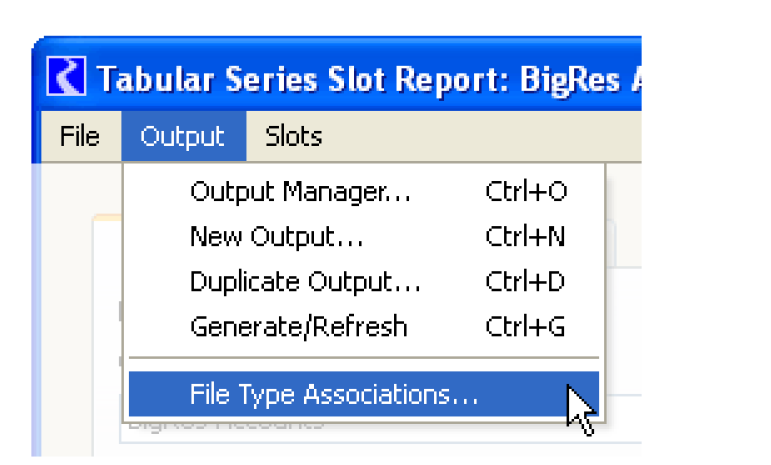
Additionally, the Output, then File Type Associations menu item is particular to Tabular Series Slot Reports. See “File Type Association Manager” for details.
Titles Tab
On the Titles tab, enter text for the following items:
• Output Name: The name of the Output Device for this report configuration. This is not shown in the report.
• Description: Optionally shown in the generated report by selecting the checkbox.
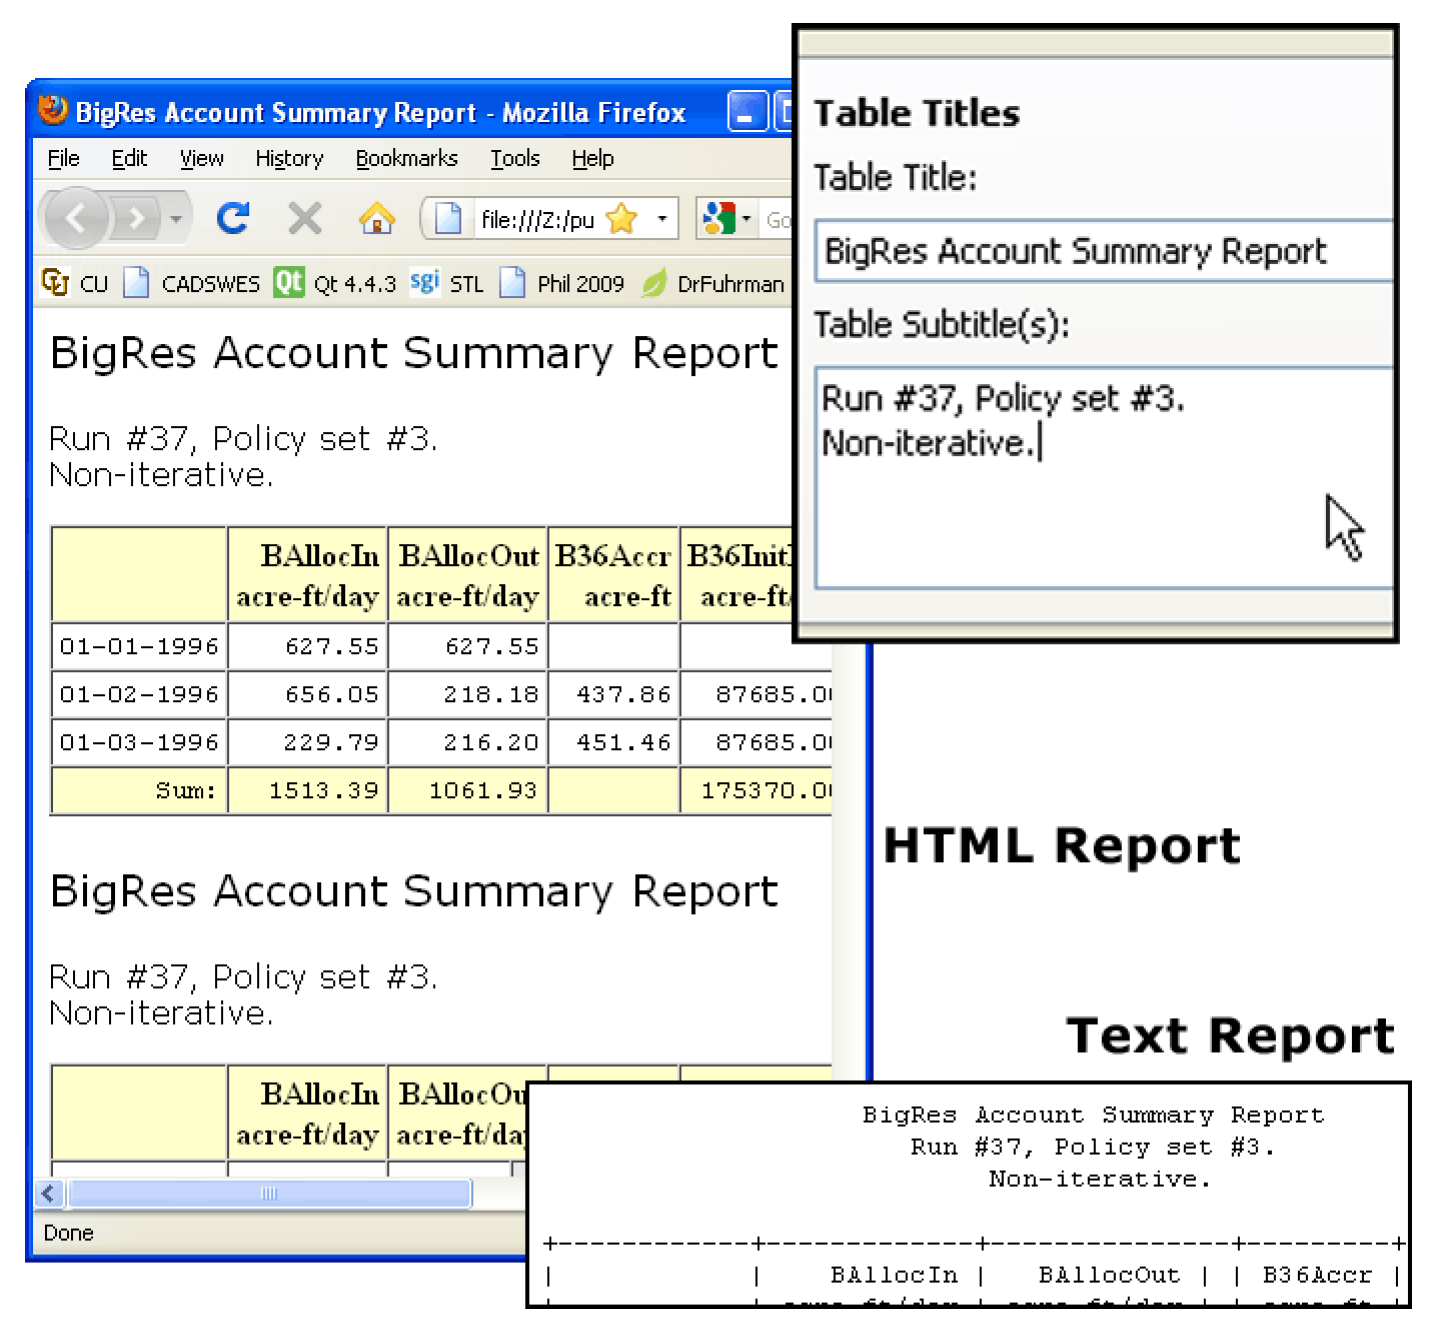
• Table Titles: Shown at the beginning and optionally above each time interval table (on each printed page, if page breaking is selected).
• Table Subtitle(s): a multiple line note shown directly below each Table Title.
Figure 3.2
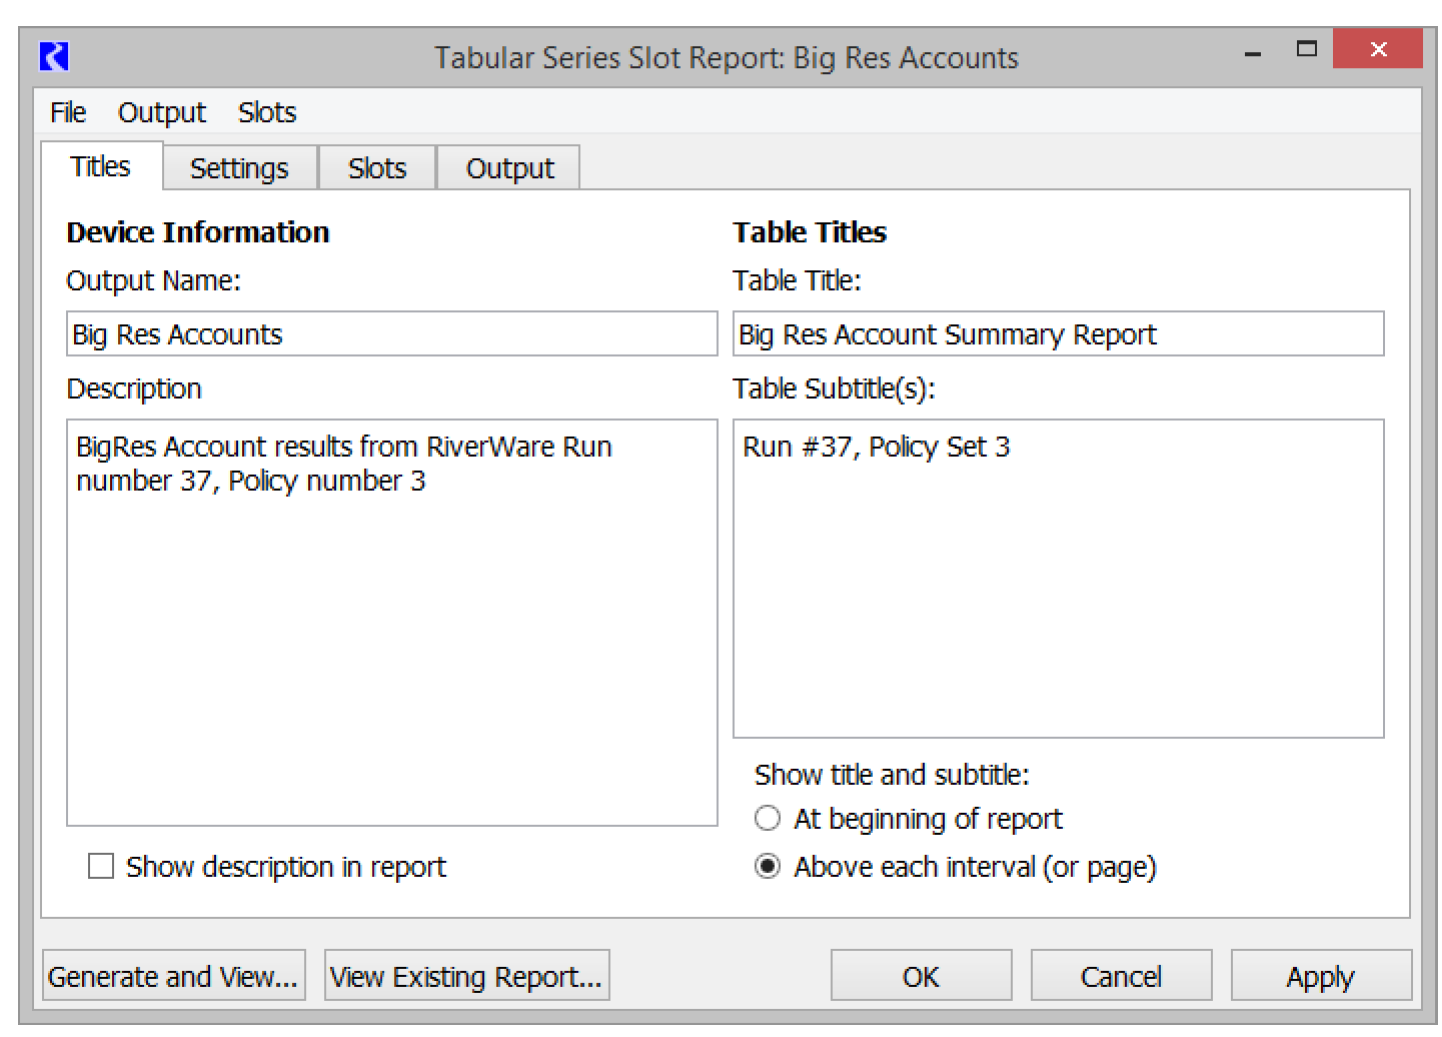
Titles and subtitles are optionally shown at the beginning of the report or before each interval by selecting the checkboxes. Figure 3.3 illustrates the use of the Table Title and Table Subtitle in both the generated plain text and HTML reports. For the HTML report, title text fonts for both of these titles are configurable. See “Output Tab” for details.
Figure 3.3
Settings Tab
The Settings tab is shown in Figure 3.4.
Figure 3.4 Screenshot of the Tabular Series Slot Report Setting tab
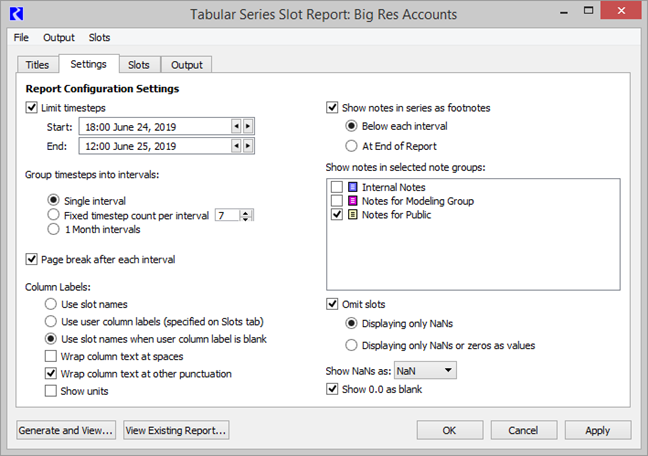
On this tab, you can do the following:
• Optionally limit the series output time range
Note: The timestep size is controlled by the slots chosen. The slots must all have the same timestep size or the model’s timestep size is used.
• Specify how the full time range will be divided into distinct interval tables.
• Optionally break each interval on its own printed page.
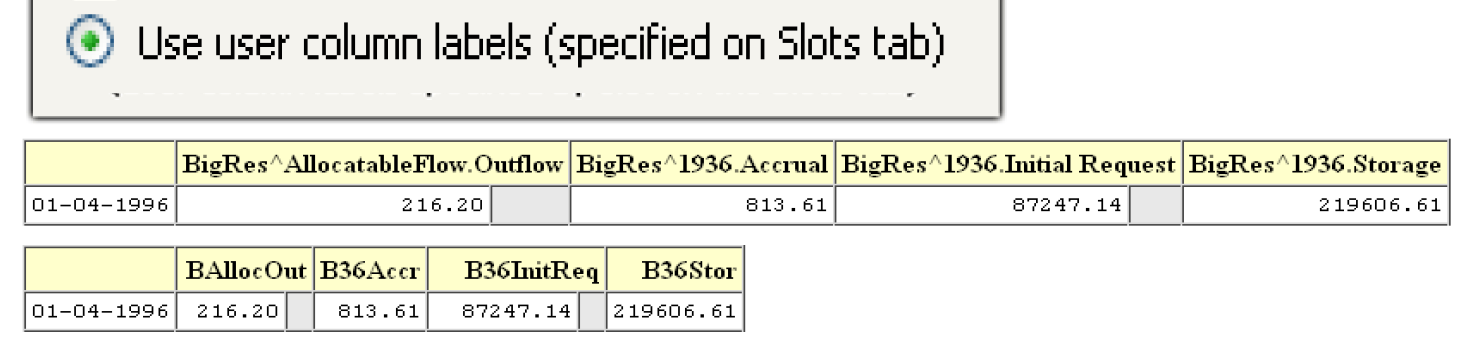
• Specify how the column labels appear, as follows:
– Use the Slot name directly,
– Substitute alternate column labels for the full slot names. Alternate (user supplied) column labels are specified for each slot on the Slots tab. (See the image), or
– Use the slot name when the user specified label is blank.
• Wrap column text at spaces
• Wrap column text at other punctuation
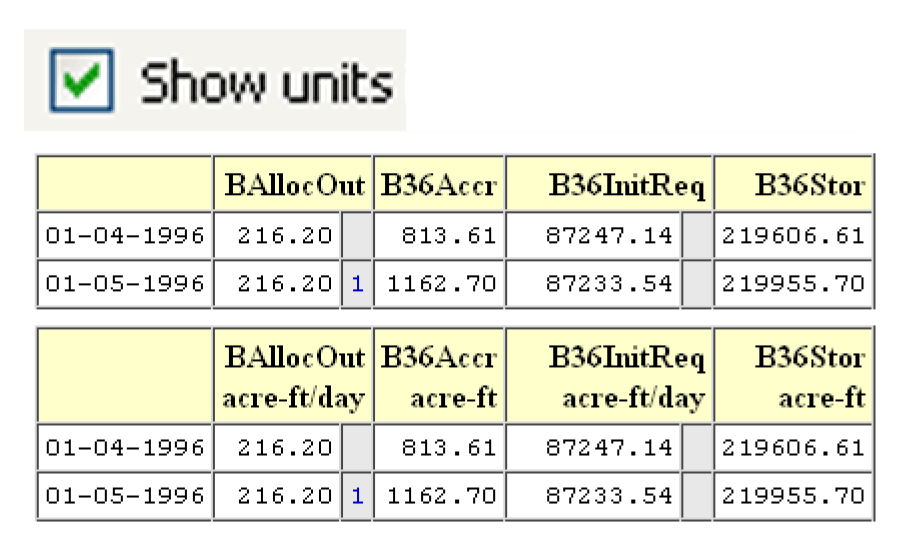
• Show units in column headers.
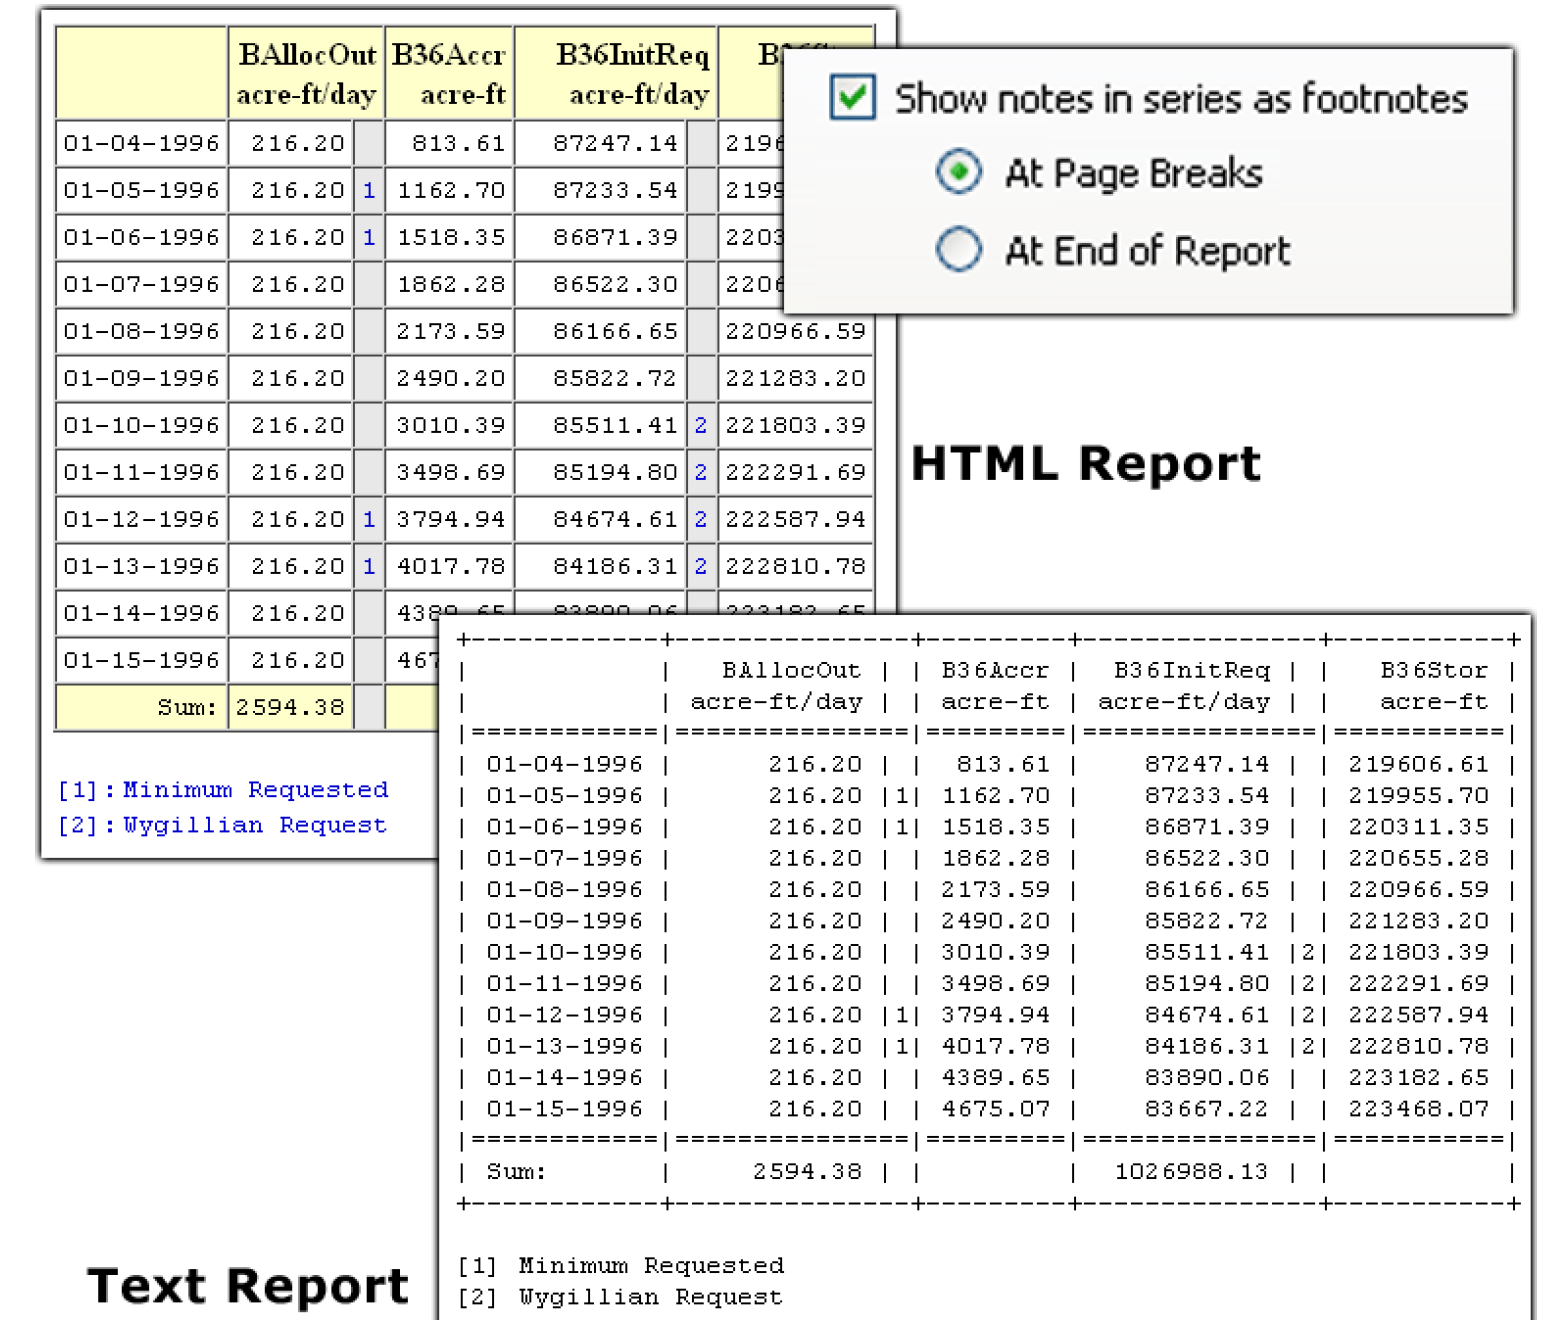
• Choose to show Notes (series text annotations) which have been added to specific timesteps on various series slots. Note text is shown as footnotes, either below each table (on each printed page), or at the end of the entire report. Figure 3.5 illustrates the effect of enabling the display of “notes” within the two types of reports (HTML and plain text). In Figure 3.5, two of the four series slots have notes.
• Choose which Note Groups to show. If showing notes as footnotes, specify which Note Groups you would like to include in the report. This functionality provides flexibility in the content, for example only showing certain notes to a stakeholder group.
Figure 3.5
• Choose to exclude slots displaying only NaN values, or only NaN or Zeros values.
Note: For the second item, the display values (precision, scale, unit) are used in the comparison to zero.
Note: Omit slots that display NaNs or zero as values. Some slots with small values could be omitted with this setting because the slot's unit scheme rules are used for the comparison to zero. For example, an underlying value of 1 cfs displayed on a slot with precision = 2, units = cfs, scale = 1000 is considered zero because the value is displayed as 0.00 1000cfs.
• Show NaNs as:
– NaN
– blank
– 0.0
• Show 0.0 as blank
Note: If you choose to display NaN values as 0.0 and to display 0.0 values as blank, the first control takes precedence; that is, NaN values are displayed as 0.0.
As with various other text components of the report, the font properties (font family, size, color) of the note footnotes are configurable as described in the Output tab section. See “Output Tab” for details.
Slots Tab
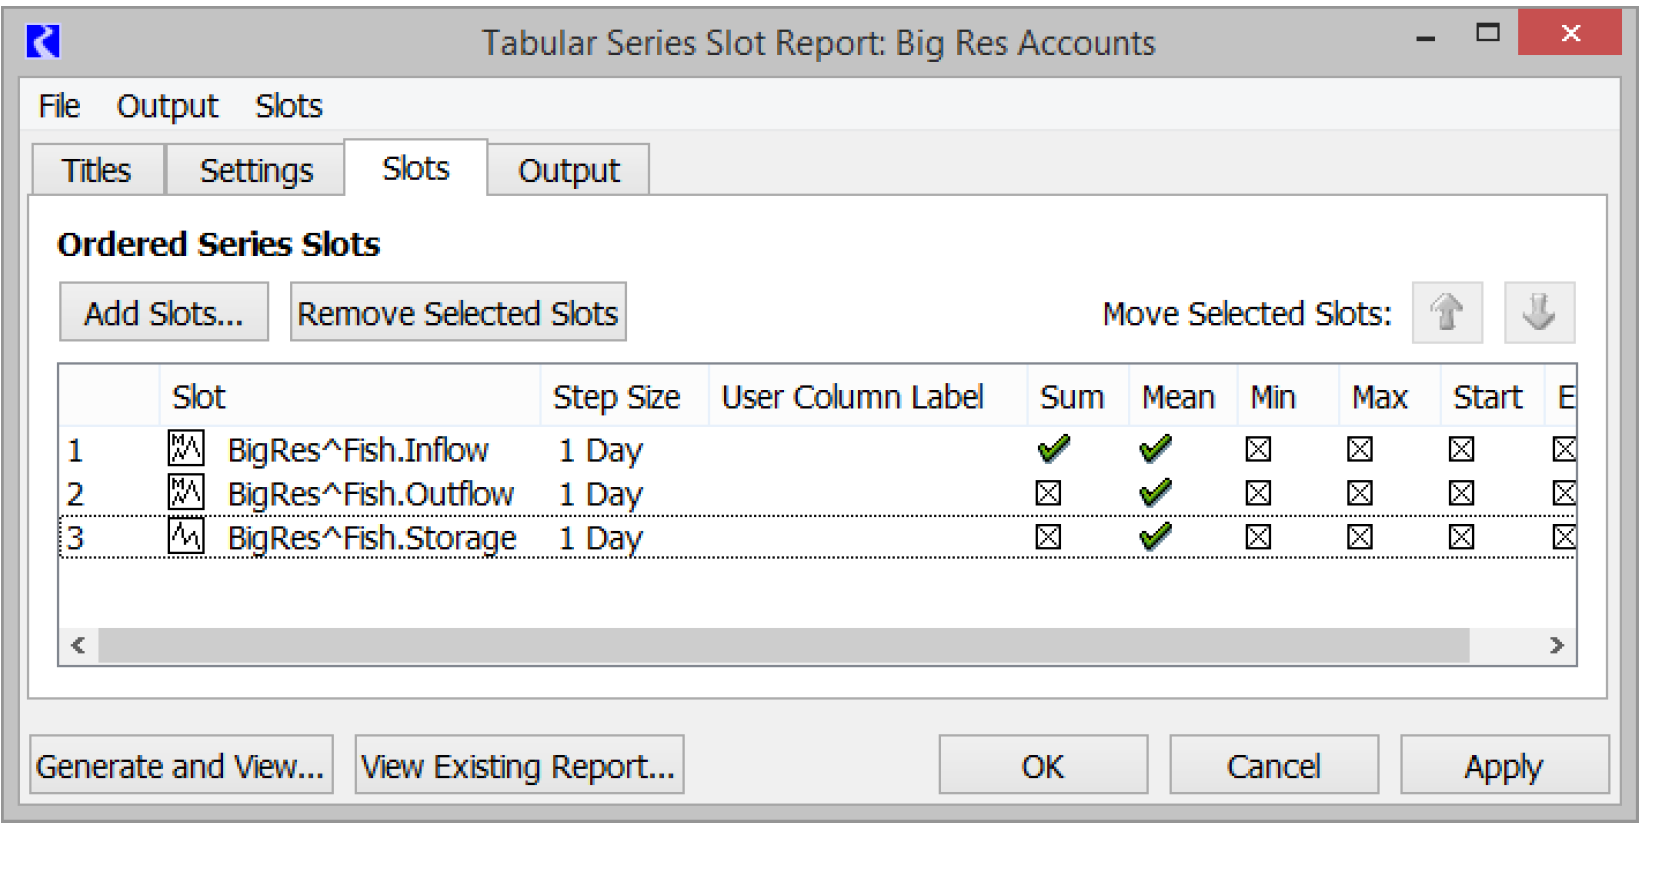
On the Slots tab, specify the slots as an ordered list of series slots.
Figure 3.6
Add slots by choosing slots using the slot selector. This is accessible in the following ways:
• Select Add Slots.
• By selecting Slots, then Add Slots.
Slots in the Slot Clipboard (which were cut or copied from other Slot Lists) can be added to the slot list in these ways:
• Select Slots, then Paste.
• Select Paste (by right-clicking the slot list).
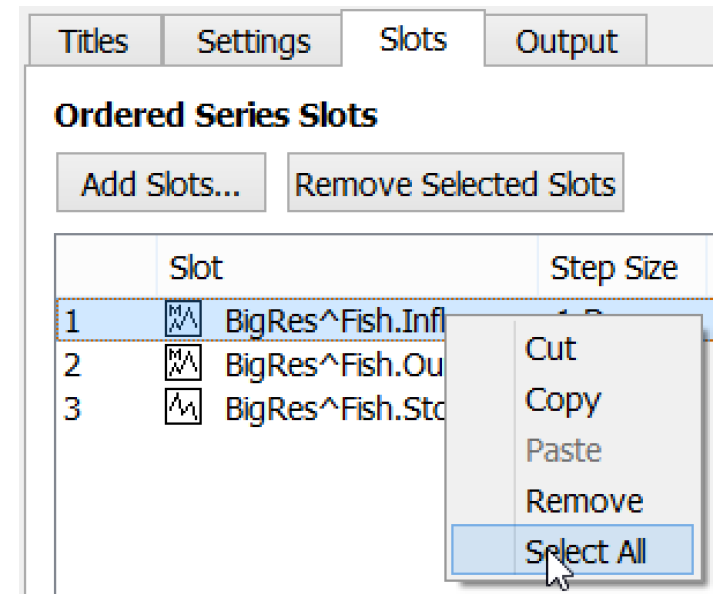
Figure 3.7 shows the context (right-click) menu supported within the slot list. The Cut, Copy, and Remove items operate on the full slot item selection. The Cut, Copy and Paste items interact with the RiverWare Slot Clipboard. These operations are also available in the “Slots” menu.
Figure 3.7
The order of the slots in the list will be used as the order of slots in the generated report. The selected slot items can be moved up or down in the list using the arrow buttons.

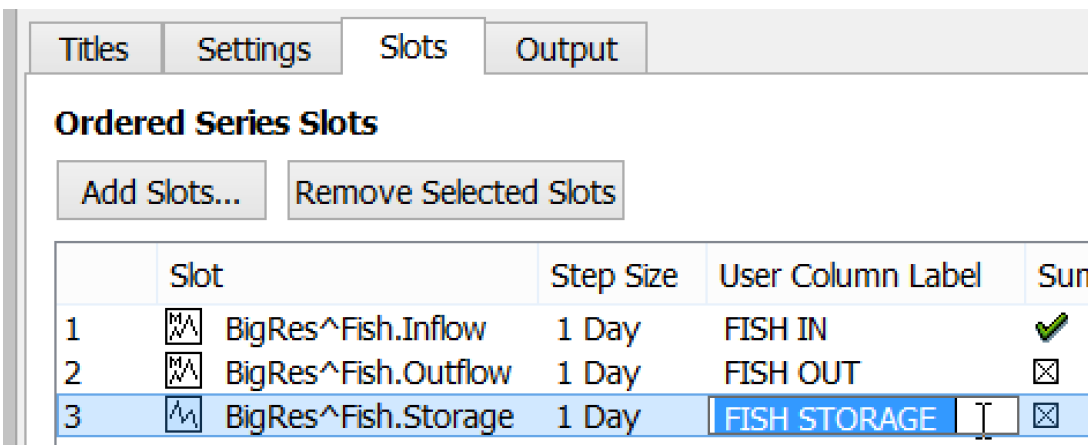
Text in the User Column Label column is editable and is used in column headers for the respective slot, based on the configuration defined on the Settings tab. Double-click on that cell to edit the text.
Figure 3.8
Note: Slots with multiple timestep sizes can be intermixed; each timestep in the model will be shown. If all the slots have the same timestep size, then the report will use that timestep size for display. See “Output Devices for Aggregated Values” for details on creating aggregated data for display in this or other output devices.
Turn on summary rows for any of the slots (by selecting those cells, to toggle on or off the green check marks), the relevant summary rows are added to the report tables. The following column summary functions are supported:
• Sum
• Mean (average)
• Min (minimum value)
• Max (maximum value)
• Start (the top value in the table column)
• End (the bottom value in the table column)
Note: “NaN” values do not contribute to the arithmetic computation. (In particular, they do not effect the Mean computation).
Figure 3.9
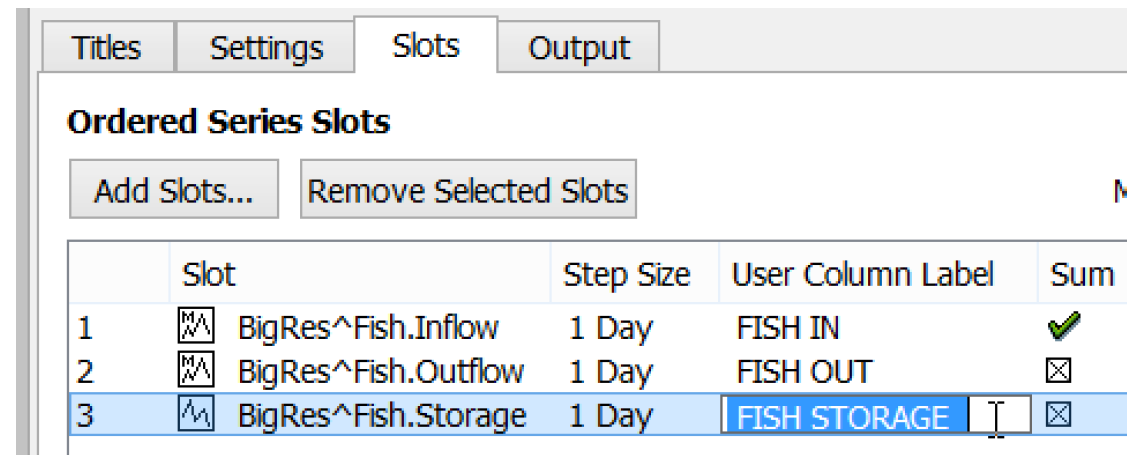
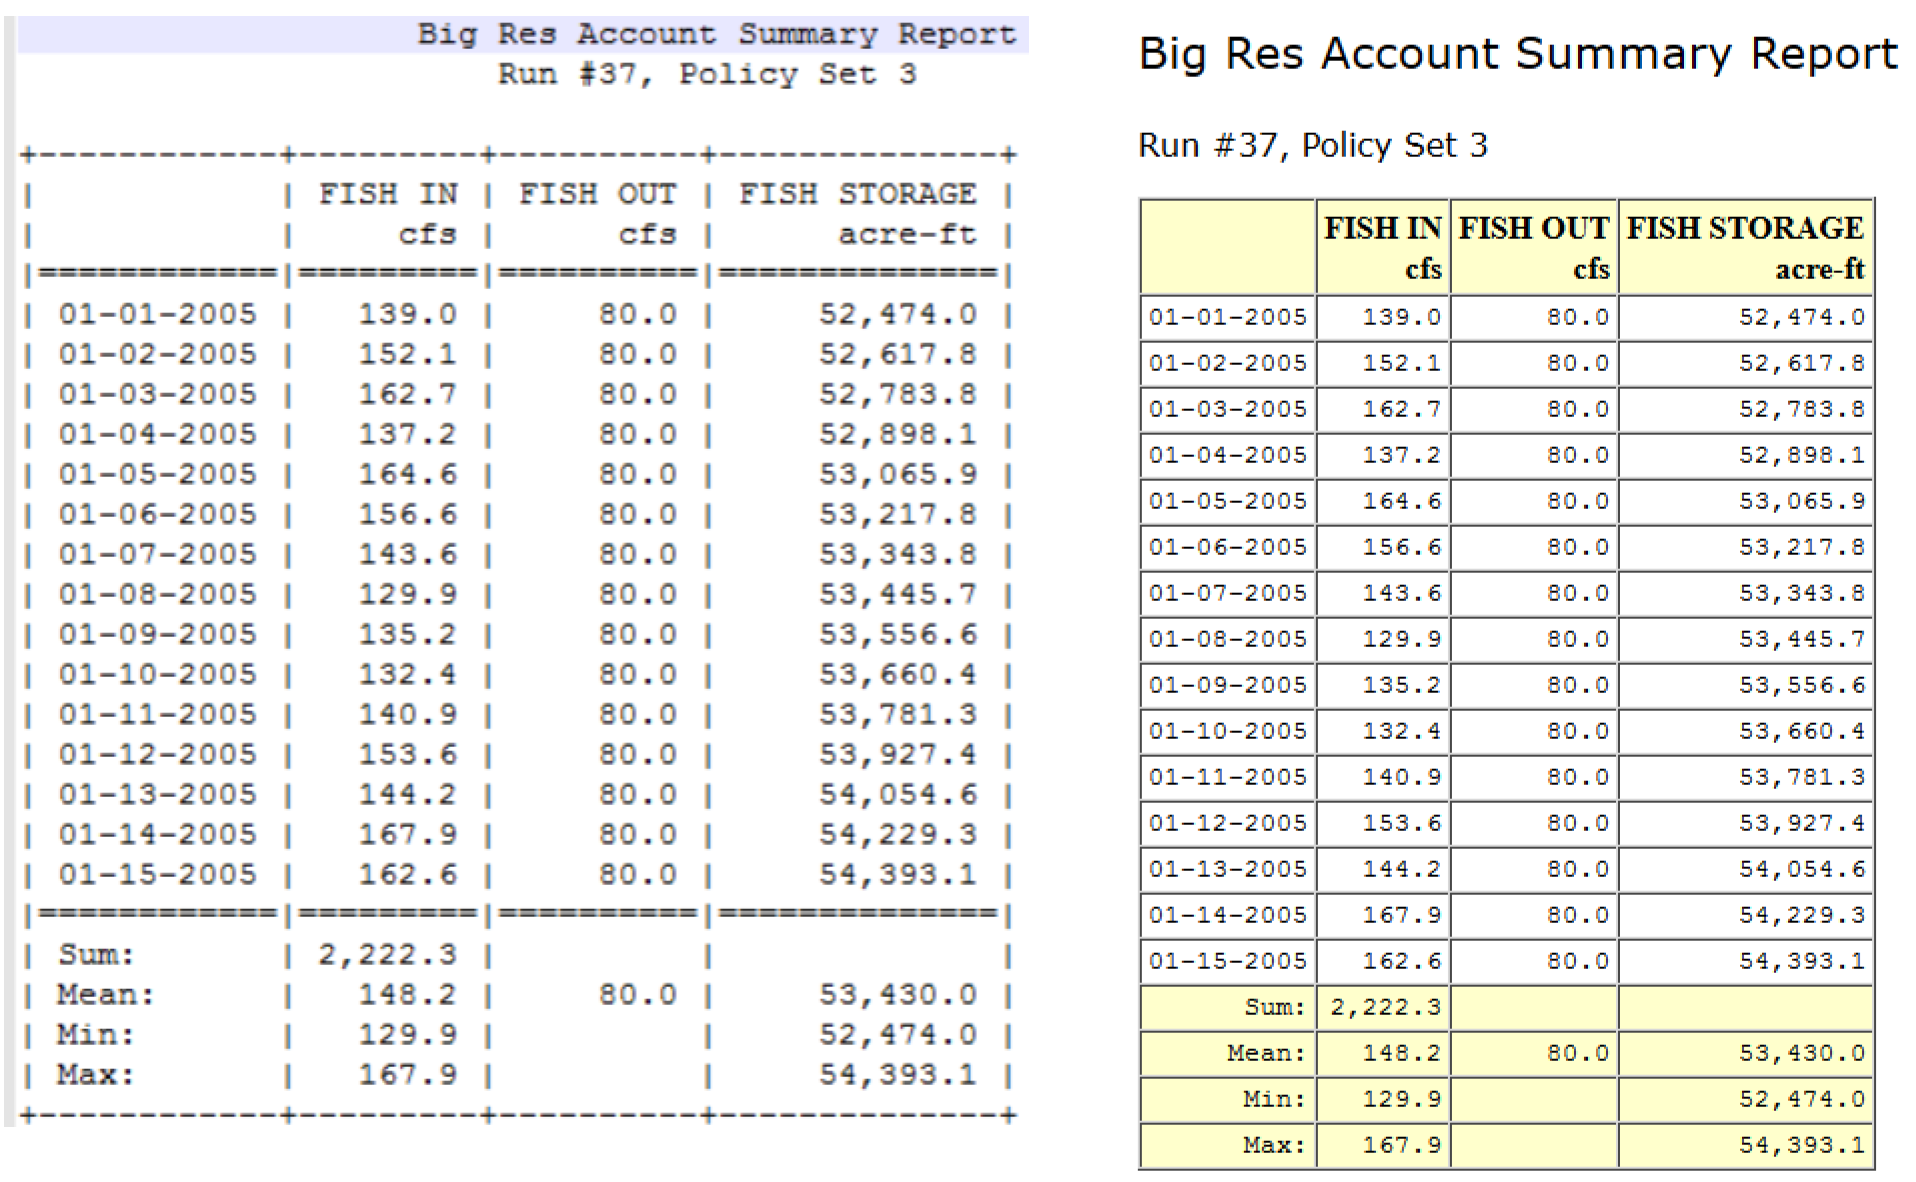
Figure 3.10 illustrates the effect of the summary checks in Figure 3.9, for the HTML and plain text reports.
Figure 3.10
Output Tab
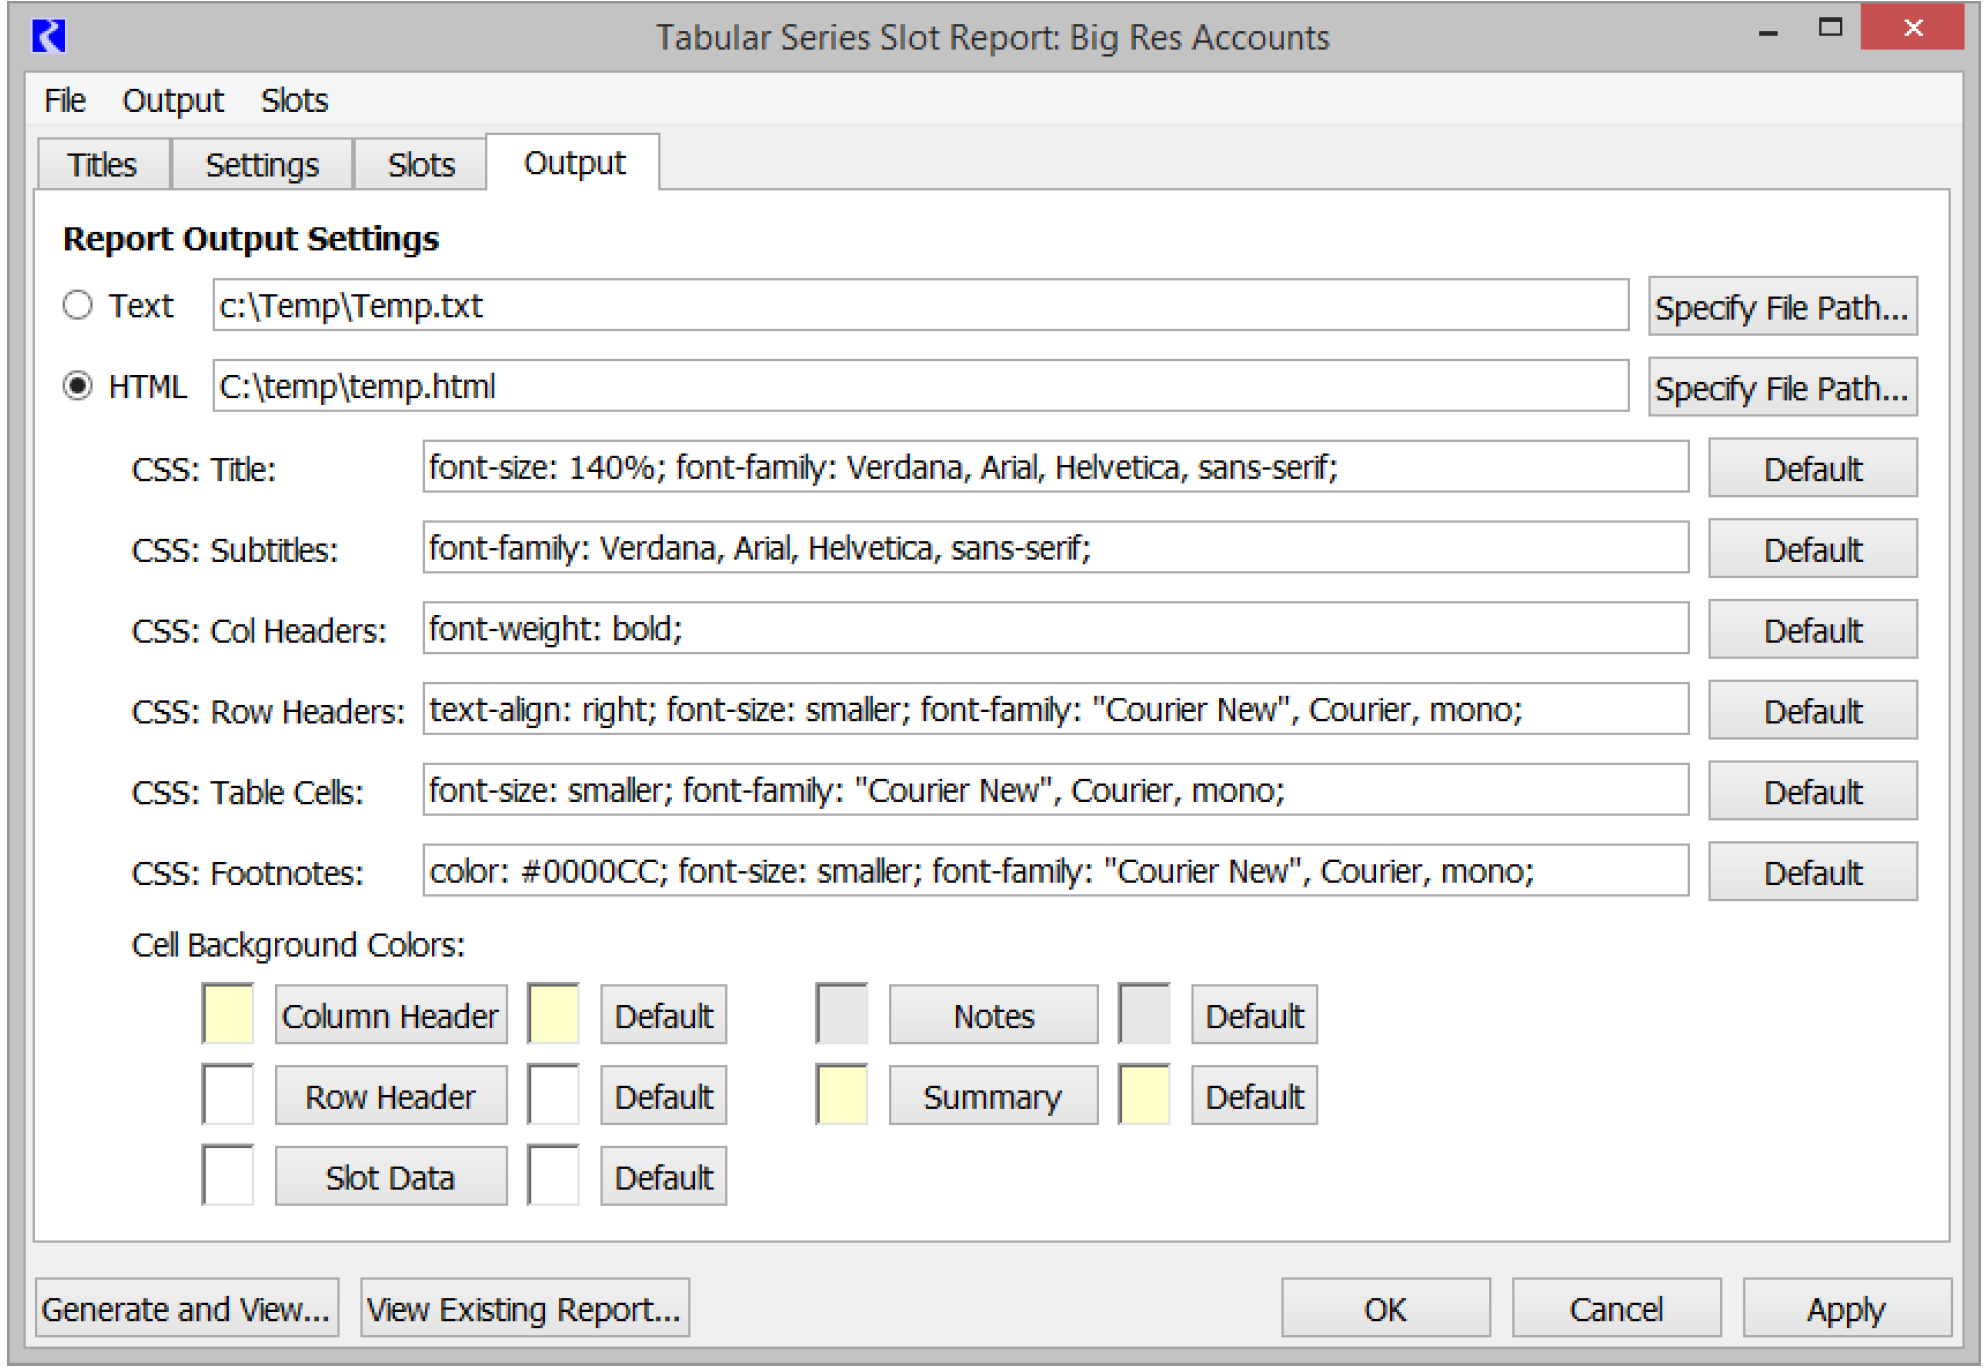
The Output tab is used to specify the file type, path, and any HTML formatting.
On the Output tab, specify the following:
• The type of file to be generated (plain text or HTML).
• The file path where the plain text report file will be generated.
• The file path where the HTML report file will be generated.
Note: File paths may contain environment variables: e.g. ${REPORT_DIR}\MyReport.html
Note: If the file does not already exist, it will be created. If it does exist, it will be overwritten. If the file does not exist, you will need to type in a file name in the file selector.
• For an HTML report file, specify the following:
– CSS style formulas for various types of text appearing in the report. See “HTML Report CSS Text Styles” for details.
– Background Colors for various table cells. See “HTML Report Table Cell Colors” for details.
Figure 3.11
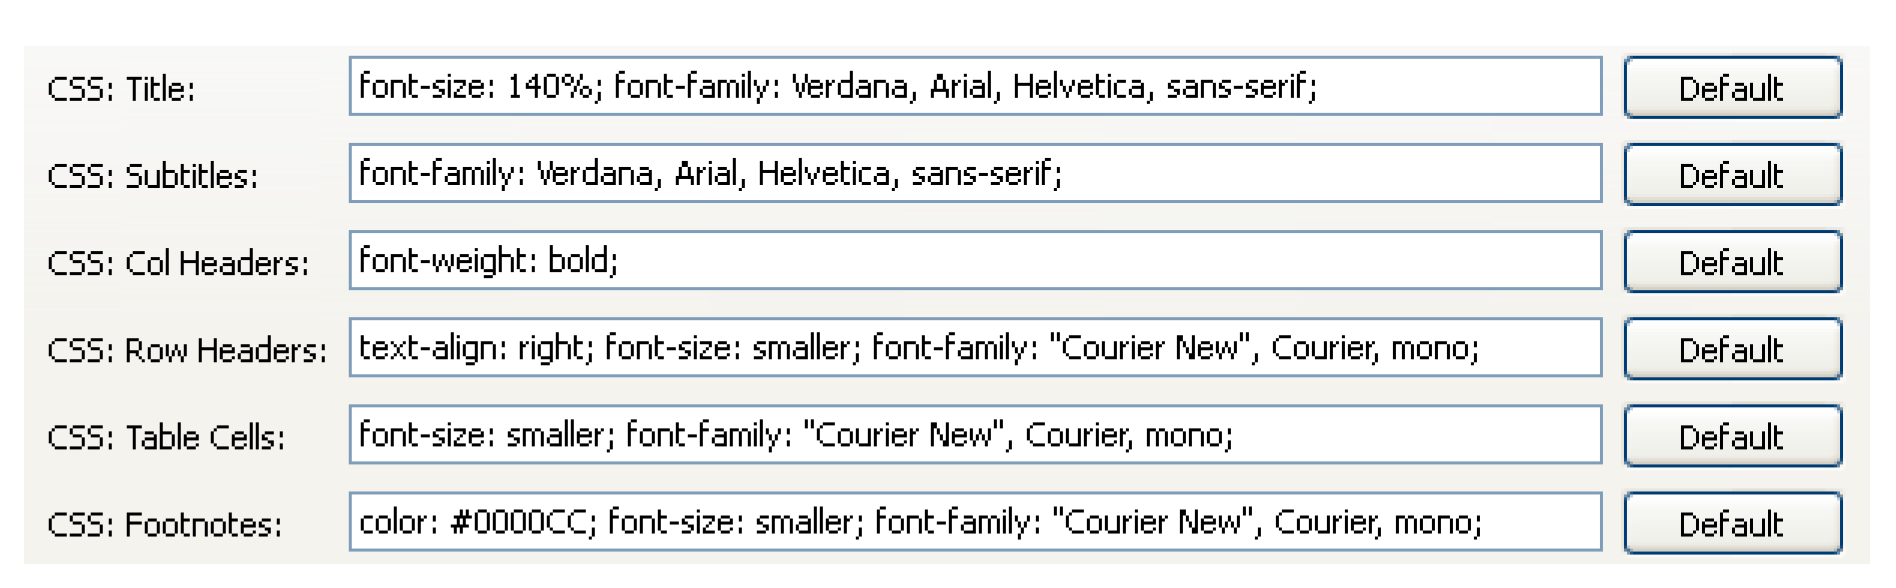
HTML Report CSS Text Styles
The fonts for six different uses of text in the HTML report are configured using Cascading Style Sheet (CSS) formulas. This typically includes font family, text color, size, bolding / italics, etc.
Figure 3.12 illustrates the six different configurable text types. Figure 3.13 (a detail from the Output tab) shows the initially implemented default CSS formulas. The default formulas can be restored by selecting the respective Default button. Hovering over a Default shows the default CSS formula in a tooltip.
Figure 3.12
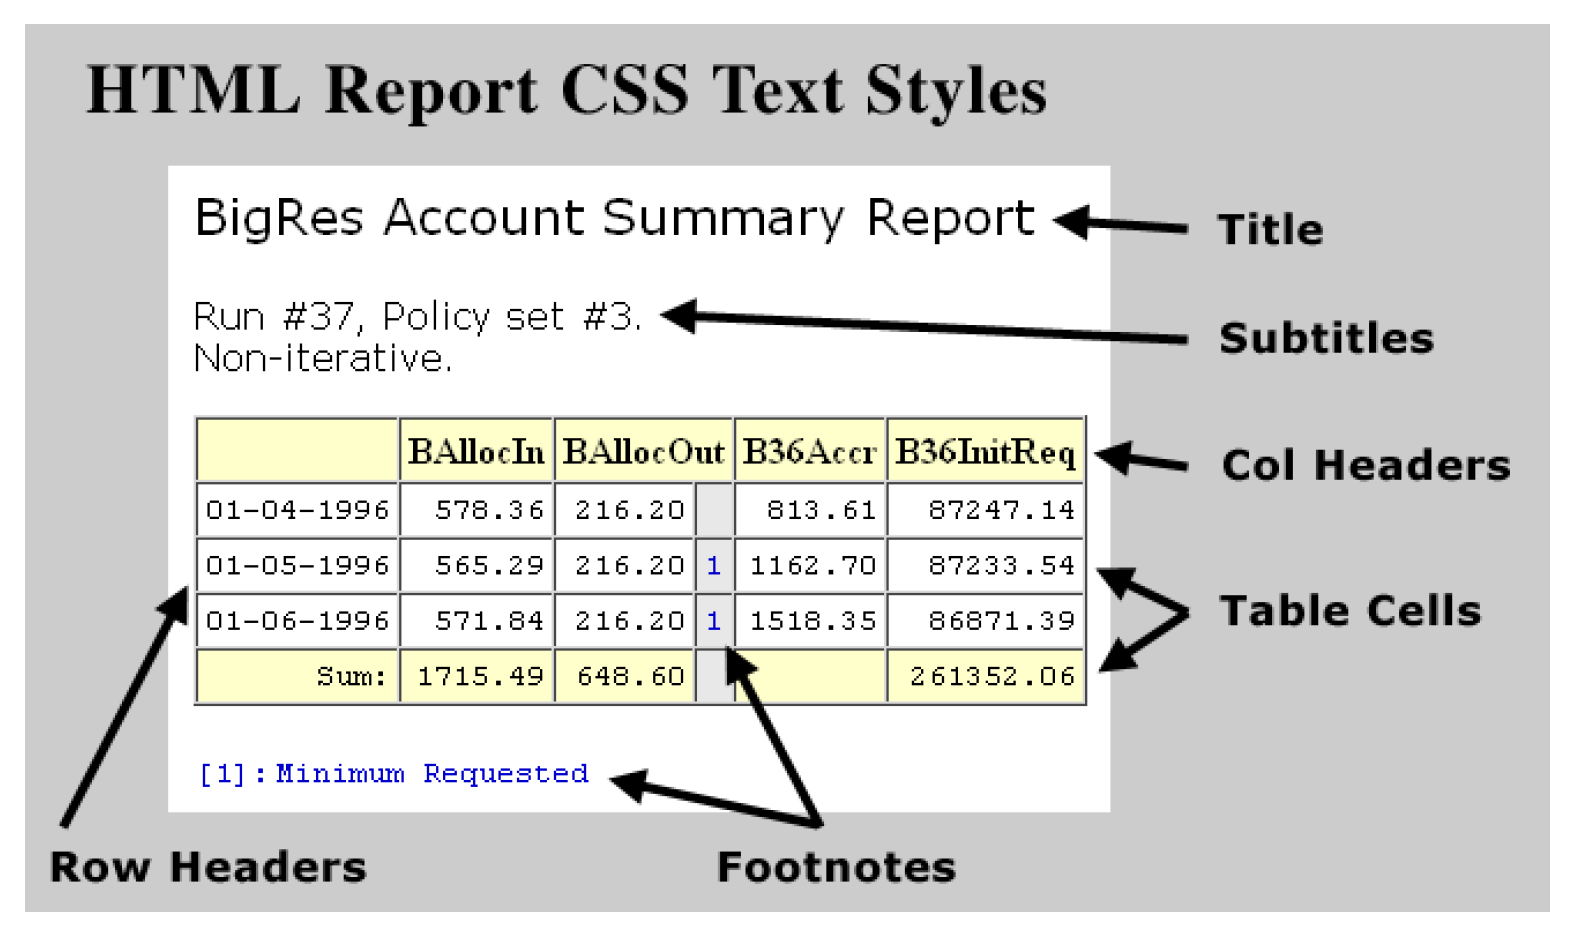
Figure 3.13
CSS is an HTML-associated style sheet technology standardized by the World Wide Web Consortium. See the following URL:
Many free tools are available which can be used to create CSS style formulas, including most HTML editors. Following is the URL of a free online CSS style formula tool (which was found by Googling “Online CSS editor”):
http://cssmate.com/csseditor.htm
Six-character color codes for particular colors (see the Footnotes CSS formula “0000CC” in Figure 3.13, for example) can be computed using the color selection capabilities. See “HTML Report Table Cell Colors” for details.
HTML Report Table Cell Colors
The background color for five different types of table cells are configurable by choosing them.
Figure 3.14 illustrates the five different configurable table cell color types.
Figure 3.14
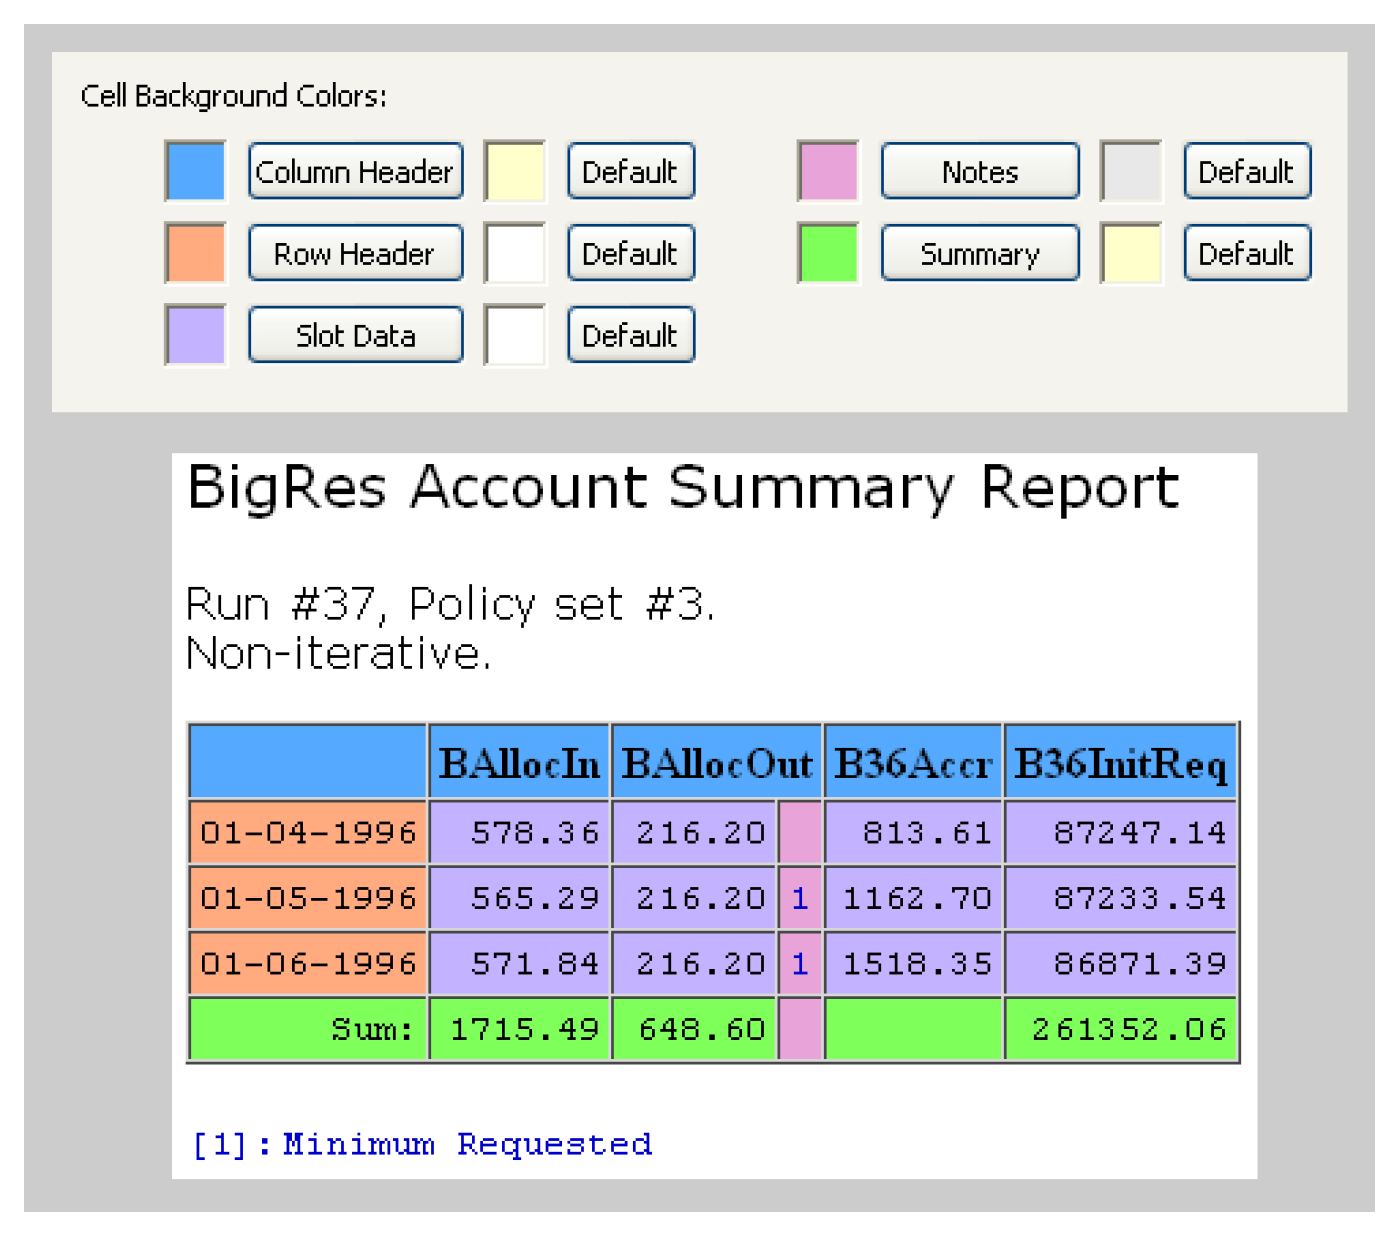
On the Output tab, selecting the titled buttons (e.g. Column Header) shows a color chooser to select the desired color. Any color setting can be reverted to the default color by selecting the respective Default button.
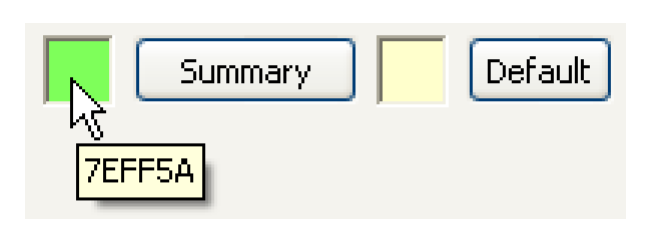
On the Output tab, hovering the mouse over a color display window (square) shows the six hexadecimal digit RGB (Red-Green-Blue) color code in a tooltip. This is an HTML color encoding convention. Each of the three colors (Red, Green, Blue) has a two hexadecimal digit value from 0 (“00”) to 255 (“FF”). Higher numbers are lighter colors; Black is “000000” and White is “FFFFFF”.
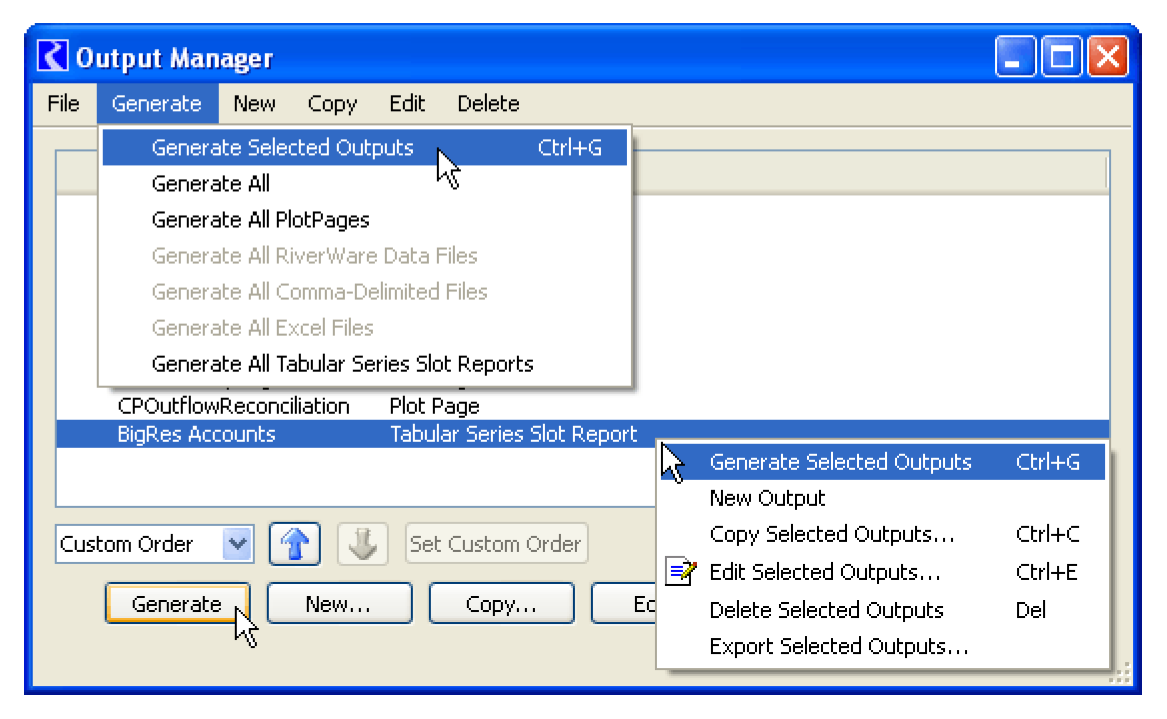
Generating Tabular Series Slot Reports
Once configured, a Tabular Series Slot Report can be generated in several ways, resulting in the creation of either a plain text file or an HTML file.
From the Output Configuration manager, a Tabular Series Slot Report can be generated in three ways. After selecting the desired report list item, do one of the following:
• Select Generate, or
• Select the Generate, then Generate Selected Objects menu item, or
• Select the Generate Selected Outputs context (right-click) menu item.
Figure 3.15
Or, from the Output Configuration dialog for a particular Tabular Series Slot Report, the report can be generated in either of the following ways:
• Select Generate, or
• Select the Output, then Generate/Refresh menu item.
An error dialog will be shown in these two circumstances:
• The configured file path for the selected output type (plain text or HTML) is invalid, or is not writable.
• The slot list is empty.
After the report file is generated, the following actions occur:
• The file path of the generated file is copied to the system clipboard.
• This dialog box is shown to report that path, and to give the option of viewing the report file in an external viewer application, which is a program configured using the File Type Associations manager (see “File Type Association Manager”). In the case of a plain text report file, you are given the option of using either the viewer for text files or the viewer (browser) for HTML files, if those are distinct. In the case of an HTML report, only the web browser option is available.
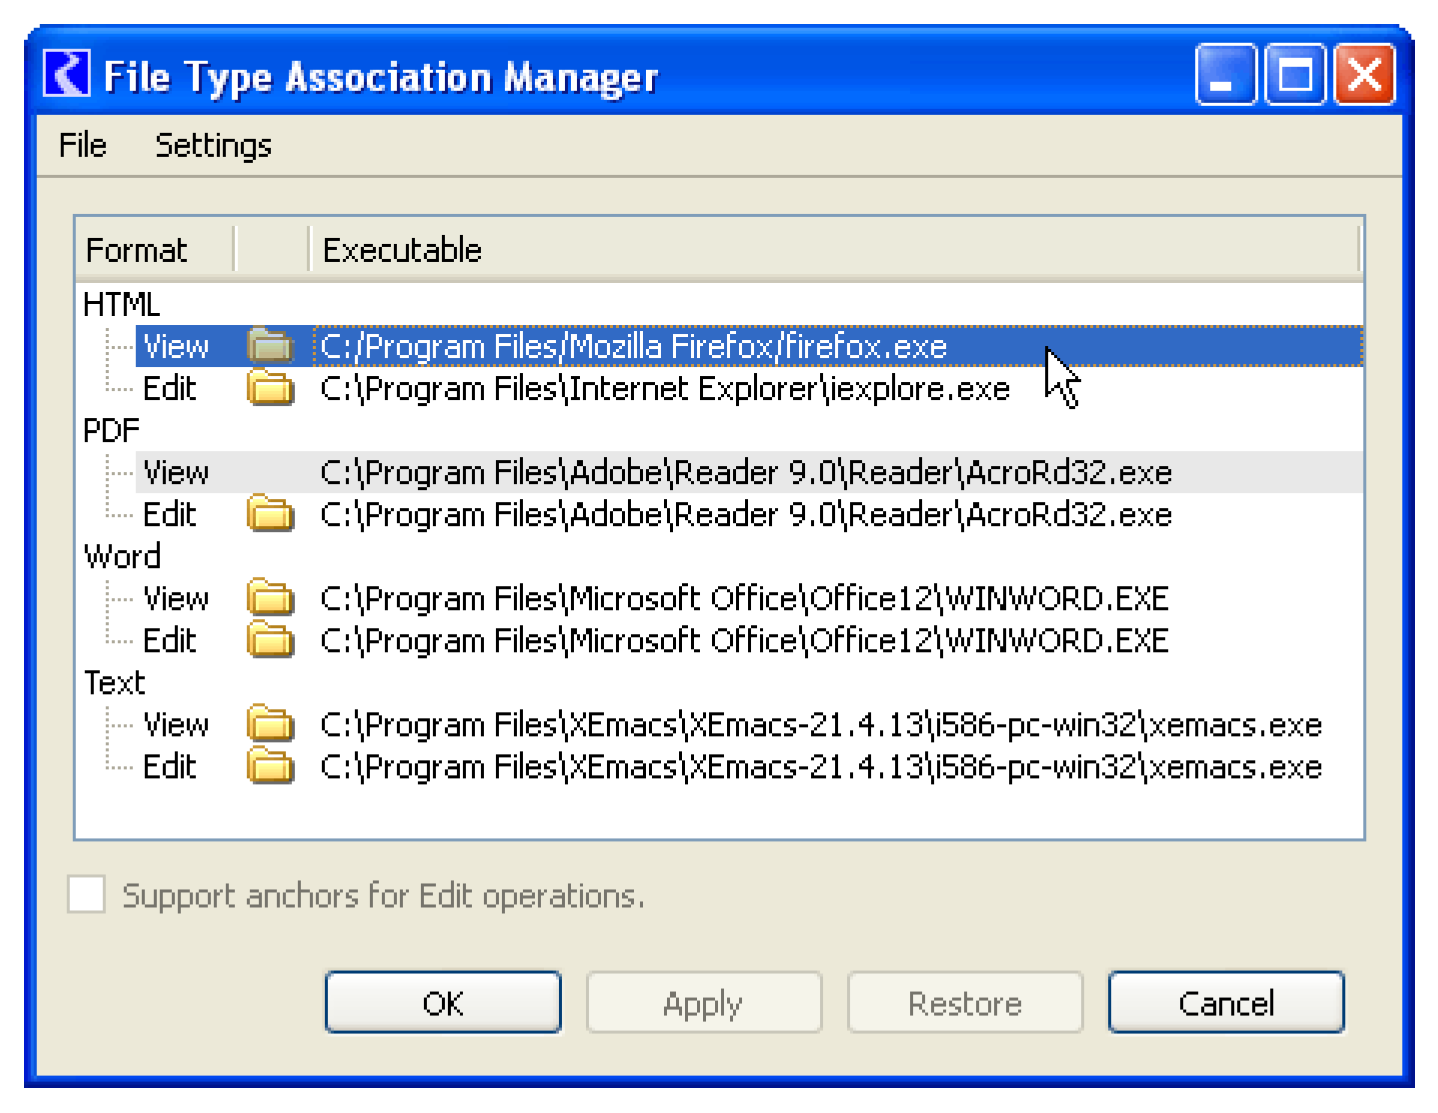
File Type Association Manager
When you choose to show a generated report file, an external program is launched. The file paths of external programs for viewing files of various types is configured in the File Type Association Manager. For the Tabular Series Slot Report, the HTML View executable is the only relevant one.
These settings persist with the user’s login account, not with the currently loaded RiverWare model file.
This dialog is accessible as follows:
• From the RiverWare Workspace’s Utilities menu, and
• The Output Configuration dialog for Tabular Series Slot Reports; select Output, then File Type Associations.
Viewing an Existing Tabular Series Slot Report
The Output Configuration dialog for Tabular Series Slot Reports has a convenience function for opening an already generated report file.
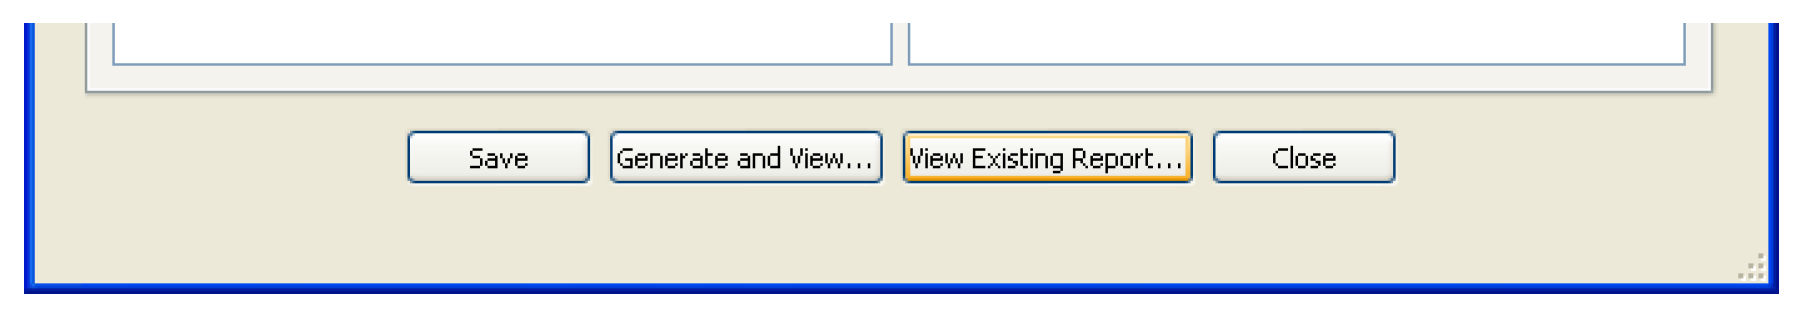
View Existing Report opens a file chooser. Complete the file selection (for an existing file), then an external viewer program is launched to view that file.
Note: The HTML viewer is always used for this operation, even if the file is a plain text file.
Revised: 11/11/2019