
Release Notes Version 7.1
This document describes new features, enhancements, and changes in RiverWare Version 7.1.
Batch Mode
InvokeDssDMI RCL Command
The batch mode command InvokeDssDMI was generalized to set the DSS File path or F Part. The syntax is described in “InvokeDssDMI” in Automation Tools.
Data Management Interface
HDB: Reading and displaying of Metadata
HDB Database DMIs were improved to read a per-timestep validation character and display it as a series slot note. This allows per timestep metadata (like P for provisional or A for approved) to be brought into RiverWare and shown on a slot as a Series Slot Note. For more information, see “HDB Table Type—Real” in Data Management Interface (DMI).
Status and Progress Dialog
The DMI interface was improved by merging progress and confirmation information into a single dialog. This new dialog also provides the status of the DMI execution, for example 8 slots were processed successfully while 2 slots were processed unsuccessfully (missing values).
Thus the new dialog provides:
• DMI Progress
• DMI Status
• Warnings and Confirmations
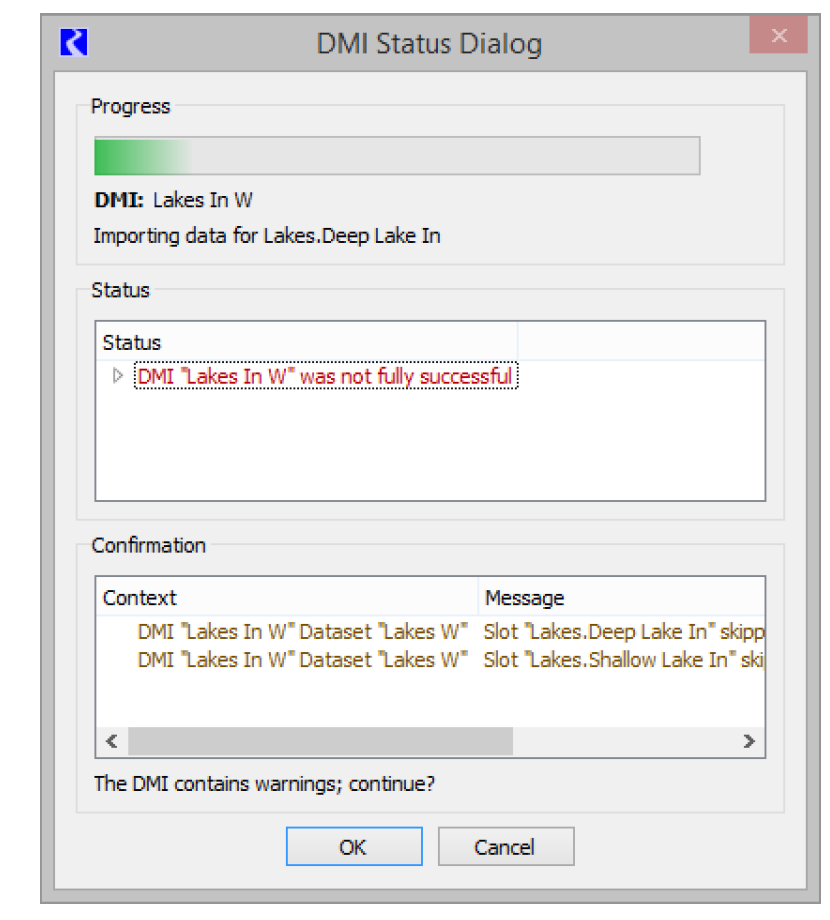
For more information, see “DMI Status and Progress” in Data Management Interface (DMI)
Multiple Run Management
HDB Output Ensemble Names for MRM
When using HDB output ensembles for MRM, a diagnostic message is now issued at the beginning of MRM to notify the user of the names of the ensembles being used.
Model Files
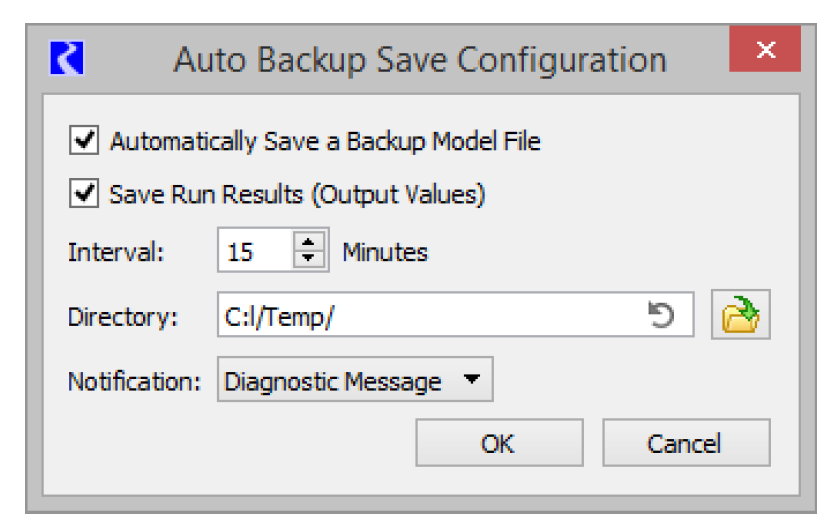
Auto Backup Save
A new utility has been added to auto-save the model file to a backup file location. When enabled, at a specified interval, the model file is saved to a backup file in a specified directory. See “Automatic Backup Save” in User Interface for more information.
Model Info and Run History
The File Model Info dialog was enhanced to show:
• Save History showing information about the last save
Objects
Canal - Dispatching
Within Rulebased Simulation, reservoirs linked to a Canal object are now forced to redispatch the same method within a timestep. This change was made to address a problem where rule and slot priorities led to the reservoirs dispatching the incorrect method.
Inline Power Plant - Specify Units Generating
A new method, Specify Units Generating, was added to the Inline Power category. In this new method, you specify the generating capacity for each unit, and the fraction of capacity at which each unit is generating. The method then calculates the Unit Power and Unit Energy as well as the total plant Power and Energy.
For more information, see “Specify Units Generating” in Objects and Methods.
Power Reservoirs - Specified Power Coefficient
On power reservoirs using the Plant Power Coefficient or Plant Efficiency Curve methods, Hydro Capacity, Best Hydro Capacity, and Energy with the Best flag are now calculated correctly when the Power Coefficient is input or set by a rule.
Reach Routing Method - Muskingum with Segments
A new routing method was added to the Reach object. The Muskingum with Segments method allows you to route using the standard Muskingum equation, Outflow = C0 Inflow (t) + C1 Inflow (t-1) + C2 Outflow (t-1), but further discretize the reach into sub-segments. Each segment uses the same routing parameters as specified in the Routing Parameters category. In addition, this method has fewer requirements for initial data than the original Muskingum method; if the initial Outflow is not known, it is set to the Inflow. For more information, see “Muskingum with Segments” in Objects and Methods
Slope Power Reservoir - Weighting Coefficients Interpolation
The Slope Power Reservoir was improved to not issue table interpolation errors during intermediate calculations. This change affects iterative algorithms including max outflow computations and RPL functions like SolveSlopeStorageGivenInflowHW, SolveSlopeStorageGivenInflowOutflow and TargetSlopeHWGivenInflow.
The fix includes introducing two new slots:
• Partition BW Table Auto Max
• Partition BW Table Auto Min
These two slots use the Partition BW Table to show the largest and smallest headwater values for each flow parameter. The tables are used within the slope storage calculations to check that values are valid.
Object Dialogs
Object Viewer
A new Object Viewer dialog was created to show multiple Open Object dialogs as tabs in a single dialog. Objects can be dragged off of the viewer to show in the standard Open Object dialog and then re-docked as desired.
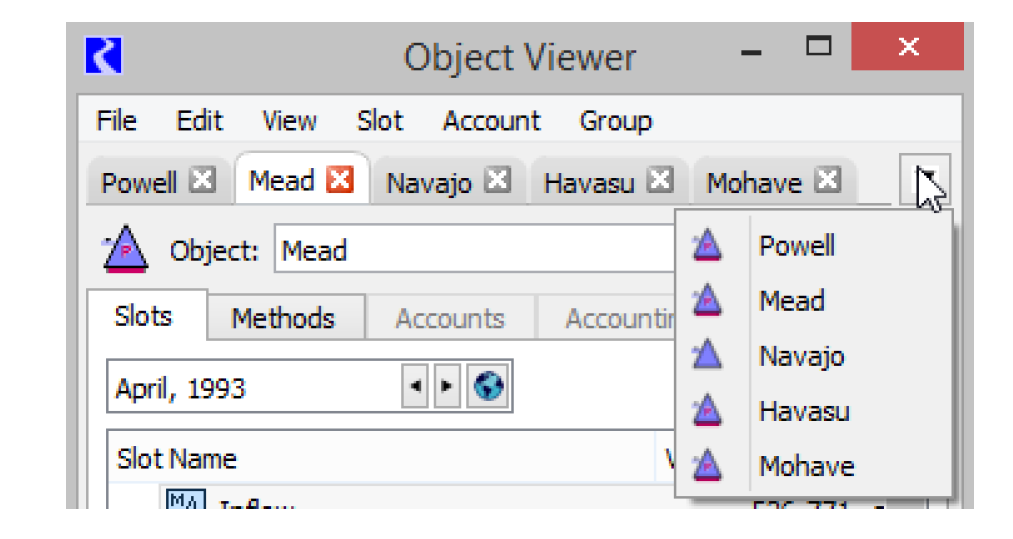
For more information, see “Object Viewer and Open Object Dialogs” in User Interface.
Optimization
Impulse Response Reach Routing
In Optimization, the Impulse Response method can now be selected for the Routing category on Reach objects. The formulation is the same as for simulation:
Outflow(t) = C0 Inflow(t) + C1 Inflow(t-1) + C2 Inflow(t-2) + ... + Total Gain Loss
Refer “Impulse Response” in Optimization for details about the slots associated with this method.
Slope Power Backwater Lambda Approximation
Previously a sloped power reservoir using the backwater lambda approximation technique was unnecessarily writing input constraints when the reservoir had already dispatched successfully in the pre-optimization simulation run. In some cases, this caused an infeasibility. To resolve this problem, input constraints are no longer written for the Pool Elevation slot at timesteps for which prior dispatching was successful. In addition, the automatic setting of approximation points was improved to make use of known values when the object already dispatched successfully for some timesteps.
Output Devices
File Size Reduction of Generated Images
A significant reduction of the size of generated image files was applied to:
• Image files generated for model reports.
• Image files created as part of the chart animation video generation.
In some cases, the file sizes were reduced by a factor of 30 without any impact on image quality.
Charts
The following changes were made to Charts:
• Within the configuration, a new tab has been added for setting fonts on all chart labels.
• A checkbox option was added to show/hide the chart date.
• An option was added to not to show the legend on the chart.
• On bar charts, sizing options were provided to configure the bar width proportion.
For more information, see “Configuring Charts” in Output Utilities and Data Visualization.
Model Reports
Model Reports provide a way to export information about a RiverWare model or run to an HTML file. Following are changes and improvements to the Model Report:
Embed Images in HTML
A new Model Report setting was added: Embed Images in HTML File with options: Yes/No Selecting Yes (the default on new reports) embeds images in the HTML file. This makes it easier to send the generate HTML file via email or file transfer. Selecting No, creates a sub folder in the specified directory where all images are stored. For more information, see “Report Settings Area” in Output Utilities and Data Visualization.
Ensure HTML and add HTML to File chooser
To make it easier to define the HTML file to use, the following changes were made:
• Automatically add .html extension if not specified.
• Provide a file selection filter for efficient selection of HTML files.
Text Items
The Model Report Text item (“Text” in Output Utilities and Data Visualization) allows you to add rich/formatted text to your report. The following enhancements have been implemented:
• Superscript and Subscript formatting is supported under the Format menu.
• Using the Tab key, four space characters are added to mimic a tab.
Show/Hide individual Descriptions and Comments
Finer control was added to allow you to specify which Descriptions or RPL Comments are shown in the report. Yes/No settings for showing descriptions and RPL comments were added to Object, Slot, RPL Set, RPL Group and RPL Rule/Goal items.
In a large model report, it could be quite time consuming to turn on or off all of these new settings. For this reason, the following four operations, have been provided under a new Settings menu.
• Show All Descriptions
• Hide All Descriptions
• Show All RPL Comments
• Hide All RPL Comments
Run History Item
A new Run History item was added to allow you to optionally show the following pieces of information in a report:
• RiverWare Version
• User
• Controller
• Run Start Time
• Run Duration
• Run Status
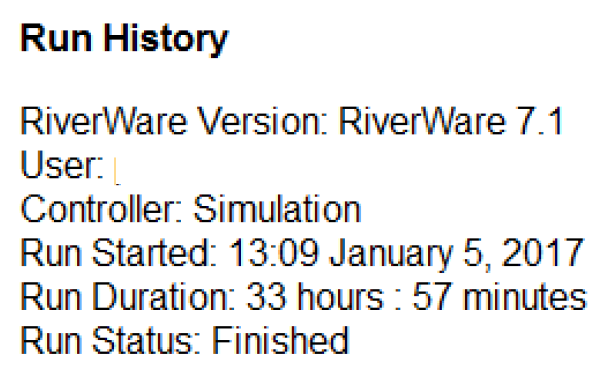
See “Model Info and Run History” for more information on the new Run History. See “Run History” in Output Utilities and Data Visualization for information about this report item.
Output Canvas
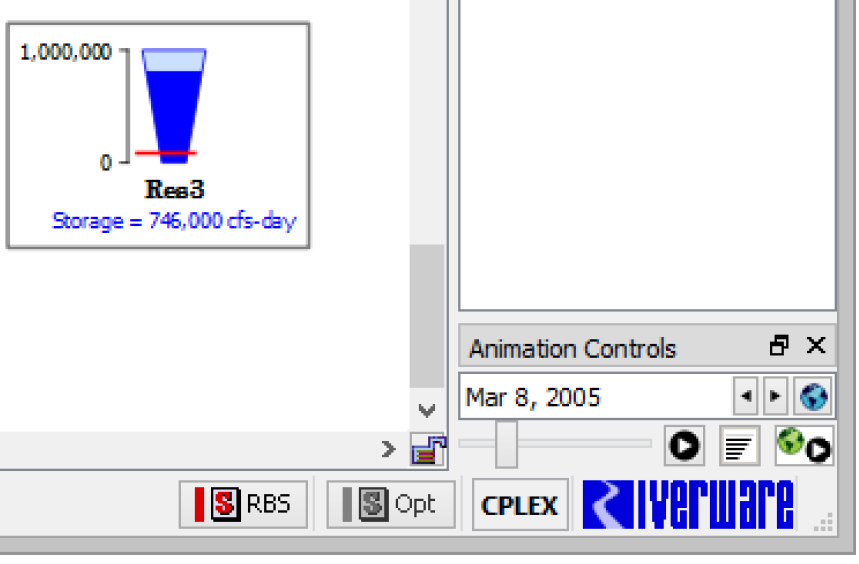
The Output Canvas, described in “Output Canvas” in Output Utilities and Data Visualization, allows for visualization of outputs in spatially distributed teacups and flow lines. The following improvements have been added to the Output Canvas:
Resizable charts, icons, and images
A scaling factor has been added to the Output Canvas configuration for individual icons and images. In addition, an anchor point feature has been added to charts for resizing the chart on the canvas.
Printing to Paper and to PDF
Print Preview and Print submenus have been added to the generated output canvas File menu. If you have a PDF print driver, you can print the Output Canvas directly to a PDF file
Teacups / Charts / Text shown on workspace
New Output Canvas settings were added to Show on Simulation View and Show on Geospatial View. When enabled, the canvas teacups, charts and text are shown on the appropriate workspace canvas views. You can move the items on the workspace, but all other configuration is performed on the Output Canvas editor. For more information, see “Animation” in Output Utilities and Data Visualization.
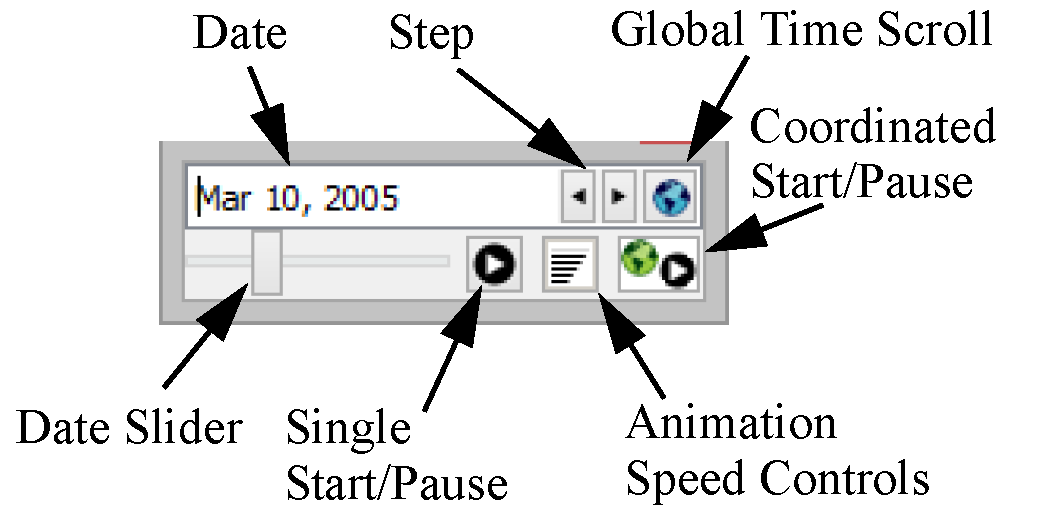
As part of this work, the datetime spinner and animation controls were added to the workspace as a dockable panel below the object list. Use this to advance canvas items through time.
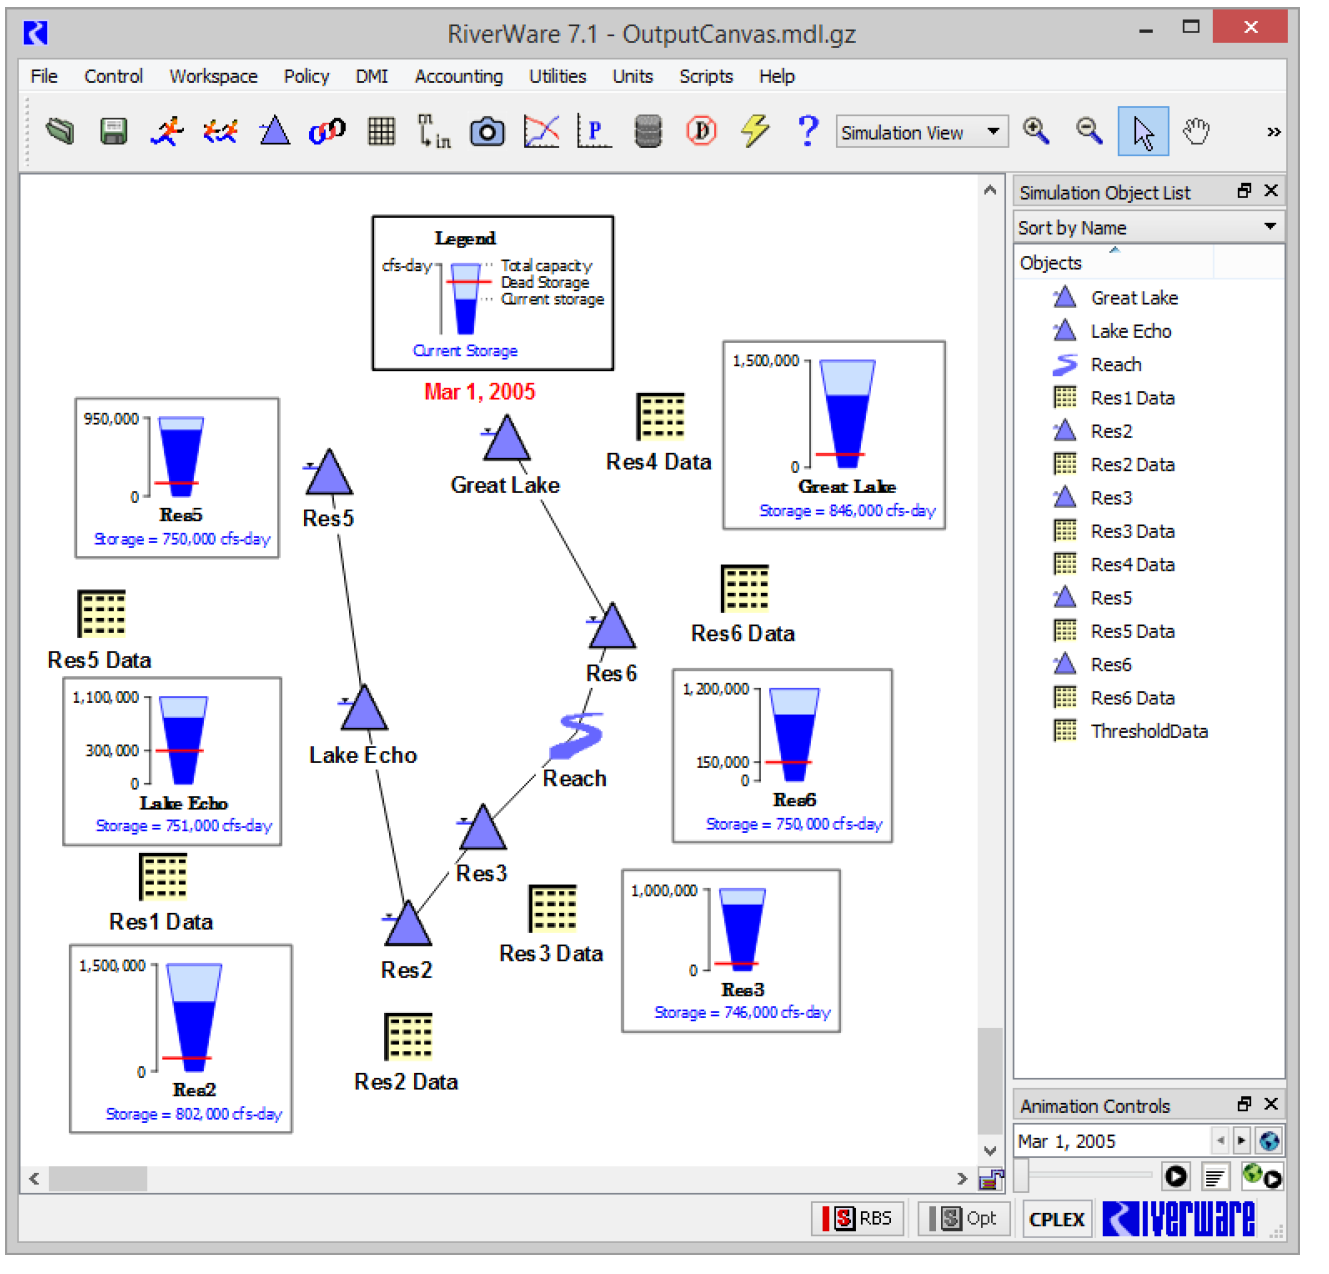
For more information, see “Output Canvas Items and Animation Controls” in User Interface.
Coordinated Animation
Charts and Output Canvas can be animated through the run period. Now, there is a Coordinated Start button that allows all relevant dialogs to animate together. When the icon is pressed, all slider/spinners move together in coordinated time. For more information, see “Animation” in Output Utilities and Data Visualization.
Plotting
Inconsistency for Patterned Line Appearance
Plots with patterned lines (dash, dot, etc) with a width of two pixels or more were displaying differently on the plot versus the legend. To remedy this inconsistency, the display of curves on the plot was improved to match the legend. As a result, existing plots may look different than in previous versions.
Marker Labels
Previously, marker labels were tied to the marker line. They did not display unless a line style was selected. Now Marker Labels can be shown without a line; that is, they can be shown to label a specific point on the plot without a line.
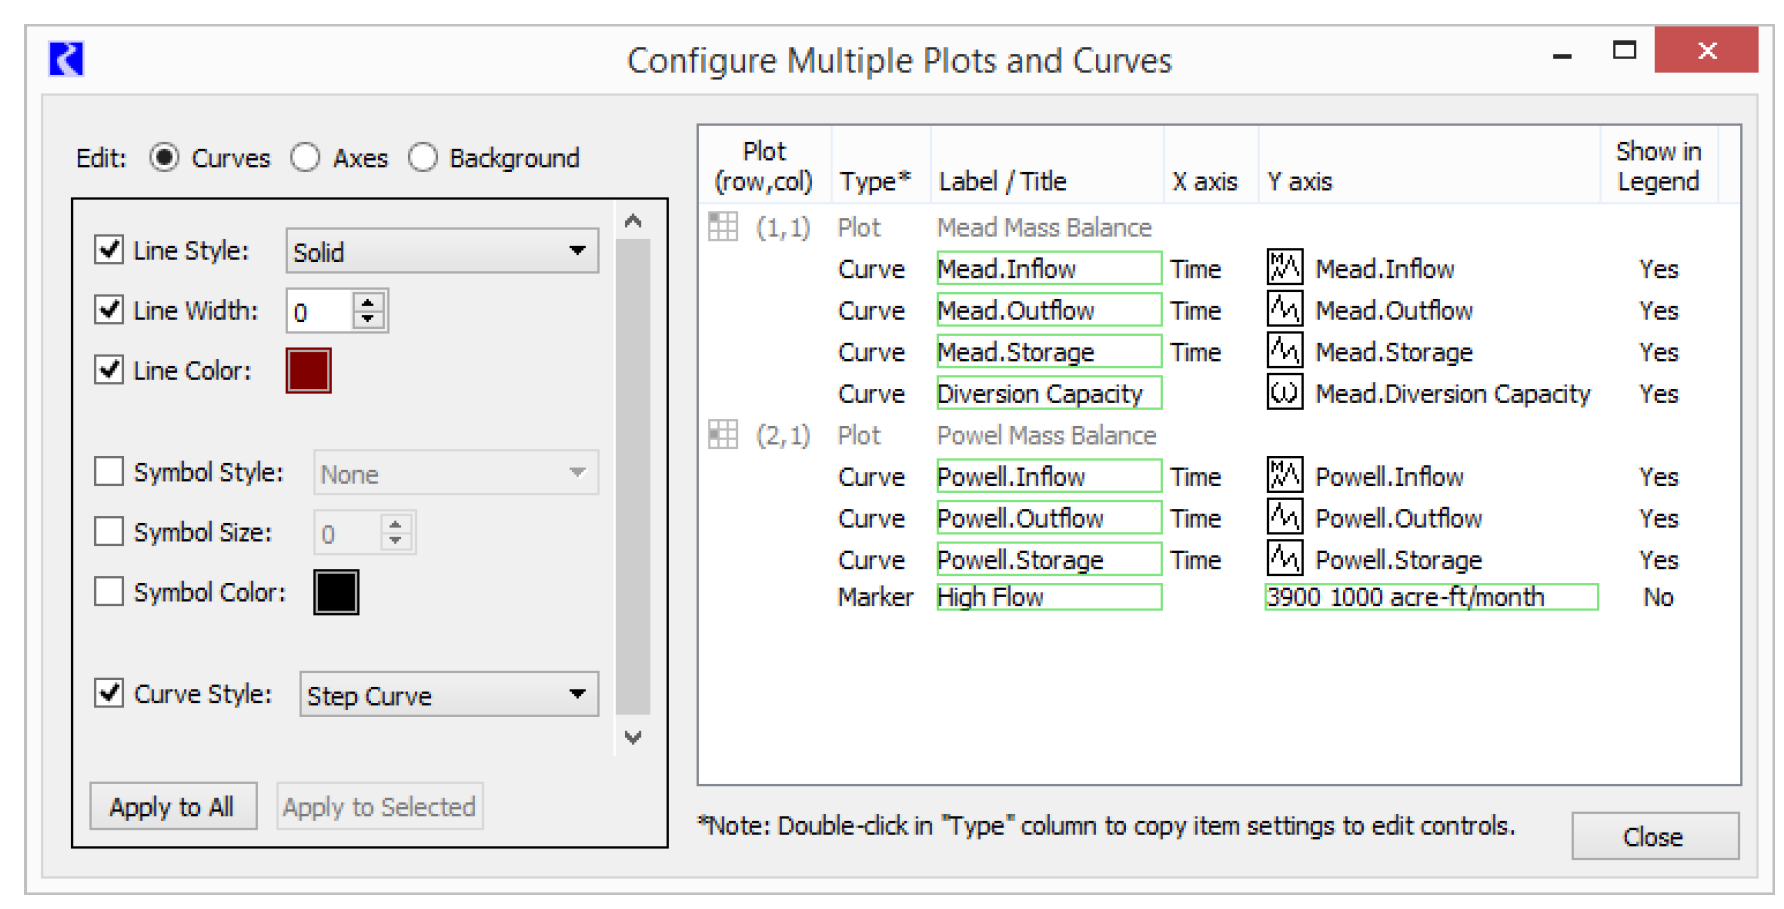
Editing Multiple Curves and Graphs
The new Configure Multiple Plots and Curves dialog provides centralized plot editing controls. Most plot settings for the supported nine separate plots within a plot page are editable within the new Configure Multiple Plots and Curves dialog. You can select multiple items within a plot page, e.g. curves and markers, and apply selected settings to those items in a single operation. For more information, see “Configuring Multiple Plots and Curves” in Output Utilities and Data Visualization.
User Specified Axis Units
Each axis is now associated with a particular unit type (e.g. flow) rather than being limited to a specific scaled unit. The user can switch the scaled units associated with an axis between:
• the scaled units of the first slot assigned to the axis,
• user-specified scale and units (among the units supported for the axis' unit type).
More information can be found “Axis Configuration” in Output Utilities and Data Visualization.
Copy/Paste of slots to/from the slot clipboard
Copy and Paste of slots from the slot clipboard was reinstated. Slot curves are added to the plot as long as axes having the slot curves' unit types are available.
Tabular Series Slot Reports
Omit Slots Behavior
Tabular Series Slot reports now have an improved Omit slots behavior. The change in filtering is as follows:
• old behavior: omit slots containing only NaNs or zeros (exact value)
• new behavior: omit slots displaying only NaNs or zeros as values
The important difference is in the checking for values that are exactly zero versus values that are displayed as zero. With the new functionality, the display precision is taken into account when checking for zero values. The new Omit slots options are now as follows:
• displaying only NaNs
• displaying only NaNs or zeros as values
More information is available “Settings Tab” in Output Utilities and Data Visualization.
RPL
Diagnostics for Rules/Goals
For rule diagnostics, the rule's priority was added to the display text. For initialization rule contexts, the initialization rule's index was added to the display text.
Now, the formats are:
• Optimization goal: GOAL: (<priority>) <goal name>
• RBS rule: RULE: (<priority>) <rule name>
• Initialization rule: RULE: (#<index>) <rule name>
Within the RBS and Optimization diagnostic settings dialogs, the rule and goal filters were enhanced to include and show the new context information.
Display Settings
RPL Display Settings, including Font, Colors, and Line Breaks, are now saved in the model file instead of in user settings. When you first open and save your model in this version, the RPL Display Settings will be saved in the model. You can export or import settings as needed. For more information, see “Formatting—Display Settings” in RiverWare Policy Language (RPL).
Element Numbering
To make it easier to find and communicate about RPL logic, you can now number the statements and expressions with which rules and functions are composed. RPL Element Numbers can be optionally shown in a column along the left side of each RPL frame or as a right-click context menu. Show these numbers from the RPL Display Settings.
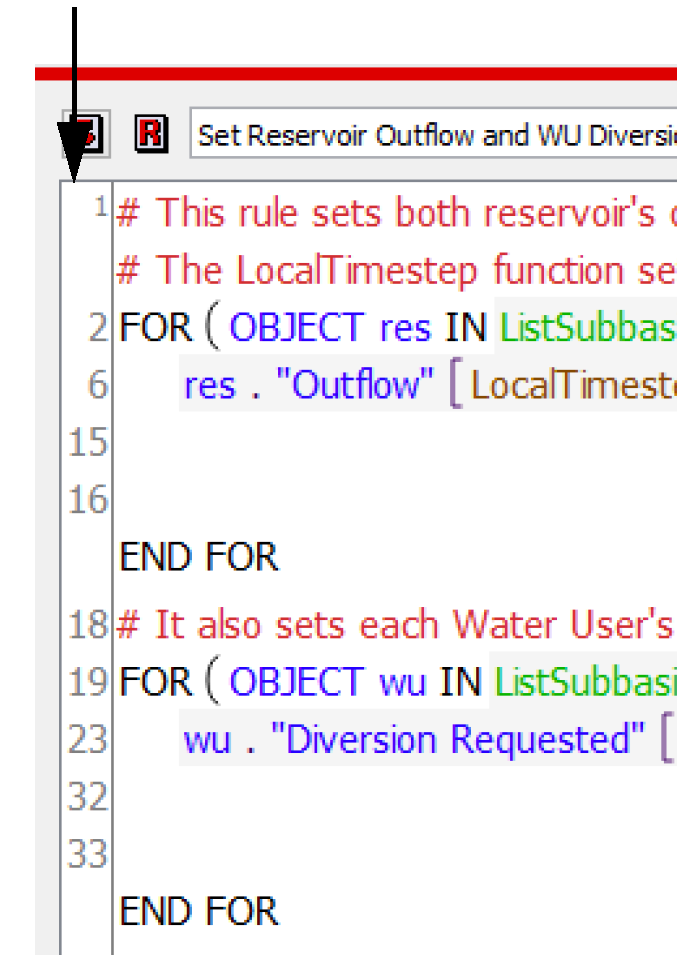
For more information, see “Element Numbers” in RiverWare Policy Language (RPL).
ELSE IF Branches
ELSE IF operators were added to both RPL Expression and the RPL Statements. You can add these operators to any IF or ELSE expression or statement as new ELSE IF branches.
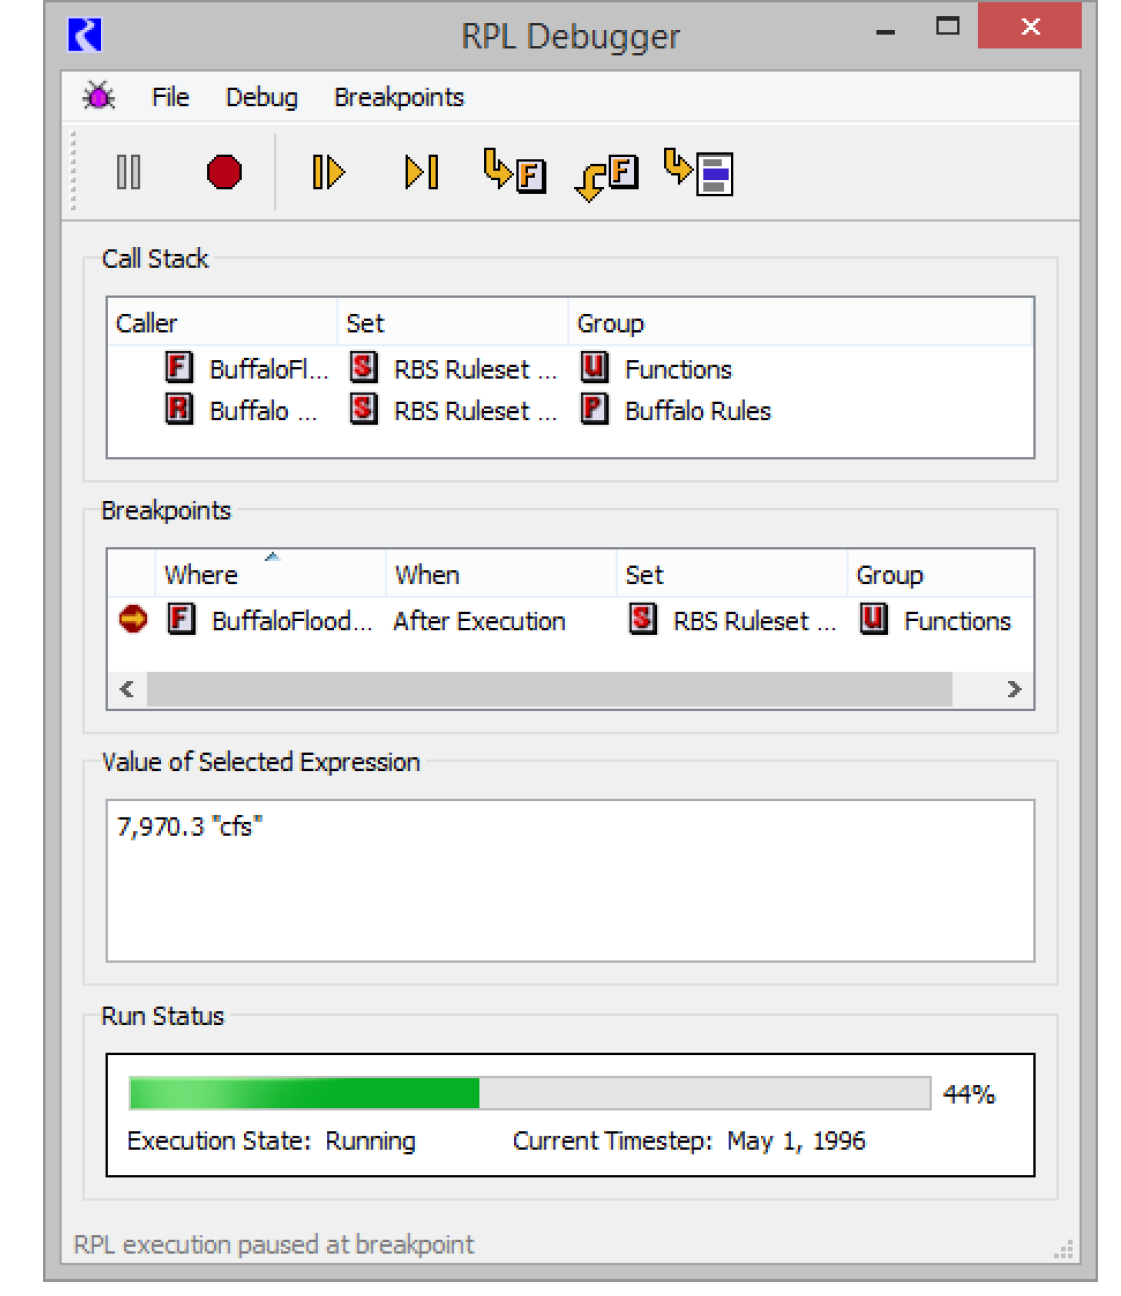
RPL Debugger
The following changes were made tot he RPL debugger:
• The Run Status is now shown as part of the RPL Debugger as shown to the right.
• Long lists are no longer truncated in the Value of Selected Expression panel. The debugger now displays the full list.
• Commas in numbers are now shown in the RPL Debugger.
Rename Variable or Argument
A new right-click “Rename...” operation was added to RPL to provide an easy way to rename all the occurrences of the selected variable or argument name.
Variables are associated with statements (FOR and WITH), expressions (FOR and WITH), or functions (argument names). For more information, see “Renaming Looping Variables and Function Arguments” in RiverWare Policy Language (RPL).
RPL Set Comparison Tool
The RPL Set Comparison Tool compares two RPL sets and shows you the differences between the sets. This allows you to see where items are different, what the specific differences are, and allows you to easily access the RPL set dialogs so that you can change one or both sets.
The comparison tool was improved to highlight multiple differences within the same item and note how many differences occur.
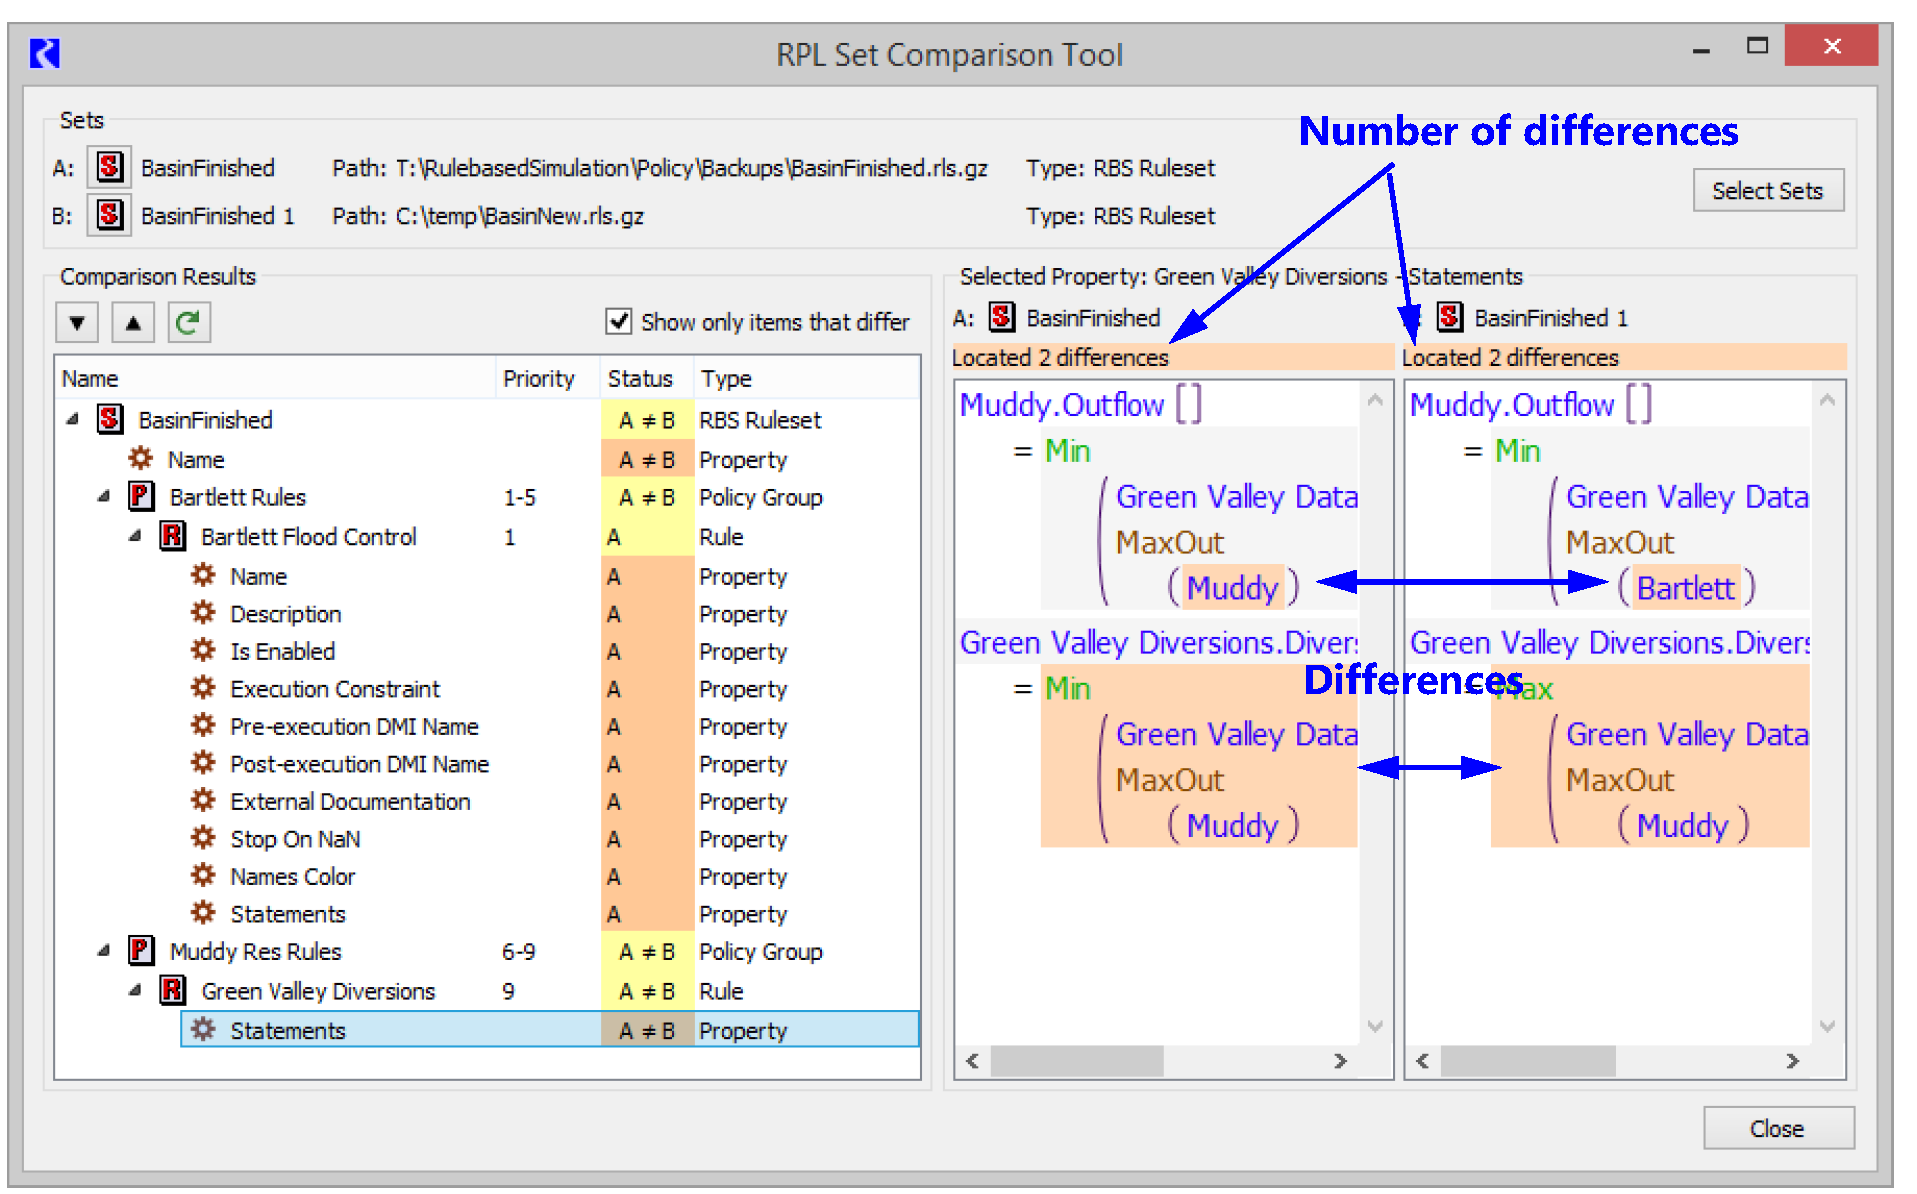
For more information, see “Tour of the RPL Set Comparison Tool” in RiverWare Policy Language (RPL).
RPL Notes
On RPL dialogs, a new Notes panel was added. Notes, like Descriptions, can be entered in a panel at the bottom of the dialog. Notes can be used when you have information about the RPL item that you want to enter that doesn’t belong in the Description field. For example, development information (E.g. who, why, when changed) could be entered in the Notes panel. Notes can be included in model report outputs using the RPL items and the Show Notes setting.
Notes are described in “Notes” in RiverWare Policy Language (RPL).
RPL Dialog - Description and Notes Indicators
The RPL dialogs were improved to better show Descriptions, Notes, and the presence of non-default values in the row of toggles. Now, when the description or notes panel contains text, the checkbox label is bold. When the panel is empty, the text is grey. In addition, when a description or notes exists, the tooltip on the text and checkbox shows the first 140 characters of the text.

Run Control
Run Status Panel
A run status panel was added to the bottom of the Run Control and Multiple Run Control dialogs as shown to the right. A separate run status dialog no longer opens automatically but can be manually opened from the View menu if desired.
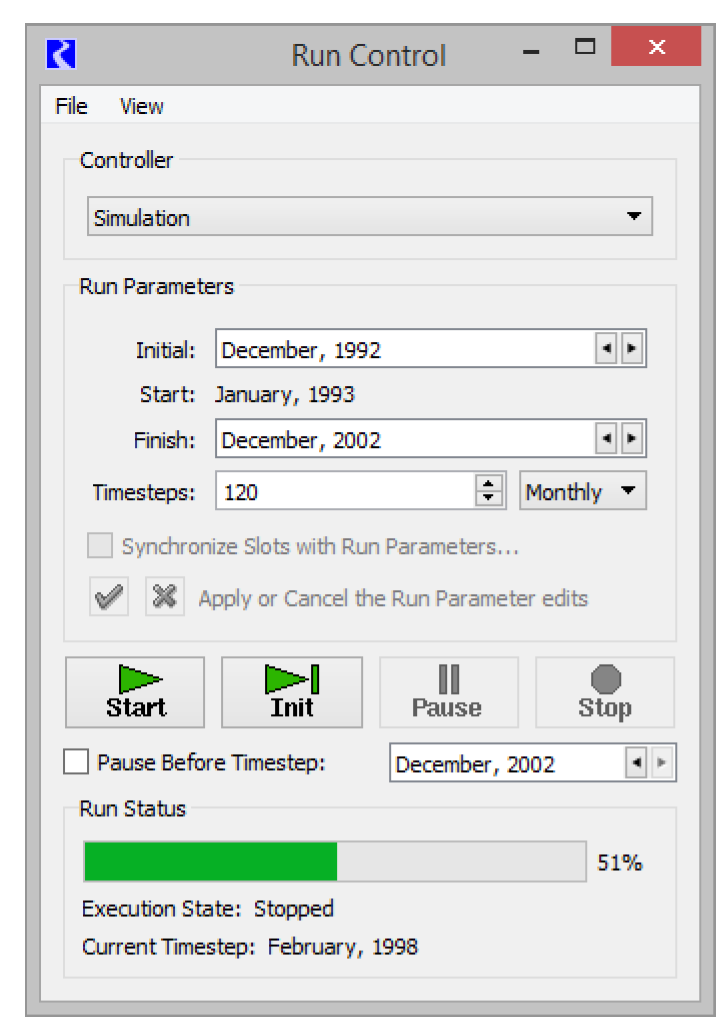
For more information, see “Controllers” in User Interface
Script Management
New Actions
Execute Script
A new Execute Script action was added to the Script Manager. This allows a script to execute another script. Note, the script called by this action cannot have additional Execute Script actions; that is, only one level of Execute Script calls is allowed. For more information, see “Execute Script” in Automation Tools.
Set Run Timestep
A new script action was added that sets the run timestep size. This action is analogous to changing the run control timestep size. Options include whether to synchronize objects, exclude slots, aggregate input data and how to handle NaNs when aggregating. For more information, see “Set Run Timestep” in Automation Tools.
Script Manager Enhancements
The Script Manager was re-designed and enhanced to provide more functionality. For more information on these topics, see “Tour of the Script Manager” in Automation Tools.
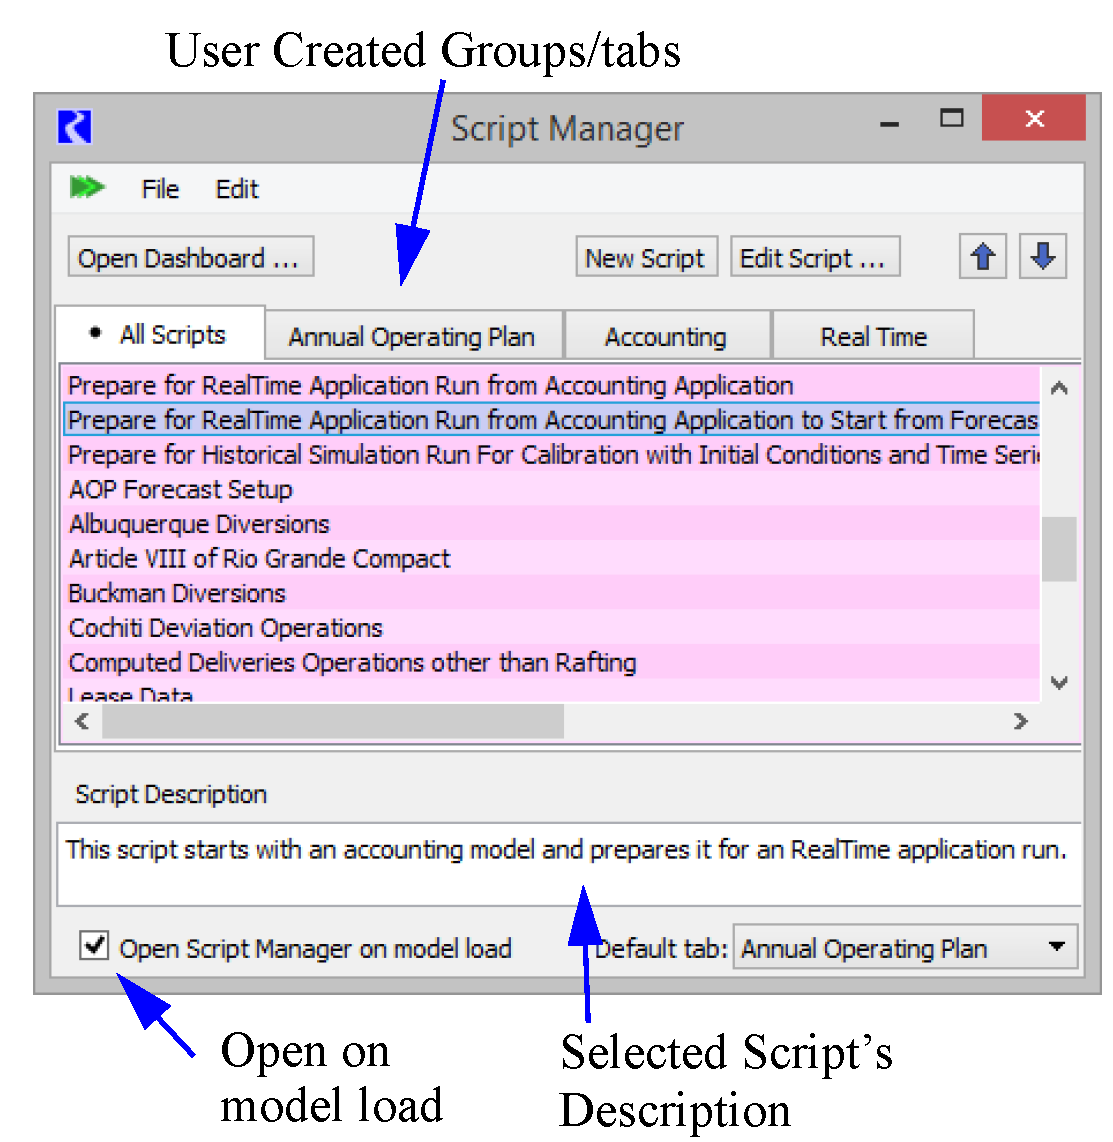
Script Groups
Scripts can now be organized into script groups. The Script Manager appearance was modified to include a tabbed panel, with each tab corresponding to a particular script group. The user selects a group's tab to manage the group and view its list of scripts.
Show Descriptions
Whenever a script is selected in the Script Manager or associated dialogs, its description is displayed in a panel below the list of scripts.
Open on Model load
The Script Manager can be configured to automatically display its window upon loading a model. One can also specify which script group tab is initially displayed when the Script Manager window is initially opened (either upon model load or manually).
Export/Import Multiple Scripts and Groups
Multiple Scripts and Script Groups can now be exported to and imported from a single file. For exporting, an additional dialog is now provided by the Script Manager via the existing File Export menu item. This dialog allows the user to select multiple scripts and/or groups at the same time, and to save them all to a single file. For importing, the existing File Import menu item now also supports opening files containing multiple scripts and/or groups.
For more information, see “Importing and Exporting Scripts” in Automation Tools
SCT
Column Widths per sheet
When the SCT is shown with slots as rows and timesteps as columns (horizontal time), column widths are now preserved on a per-sheet basis. In addition, the following column width adjustment operations now operate on a per-sheet basis:
• Resize Columns: Set All to Selected Column Width
• Grow Columns: Fit Data
• Resize Columns: Fit Data
• Resize Columns: Fit All
For more information on these options, see “Adjust Column Widths” in User Interface.
Font Specification
The default font choice in the SCT Configuration dialog's Font tab has been renamed to Workspace Font, and the effect of that choice has been simplified. When Workspace Font is selected, the SCT uses the font of the RiverWare Workspace (which is used also by most other parts of the RiverWare user interface). With this selection, any changes to the Workspace's font are immediately reflected in the SCT.
The font-related settings associated with SCT configurations include:
• Workspace Font
• The user-defined Font A
• The user-defined Font B
Go To Next NaN
A new menu item, Go to next NaN, now appears on the View menu. Go to next NaN navigates directly from one NaN value to the next through timesteps first then through the timesteps on subsequent slots. A new shortcut, Ctrl+Shift+N, also carries out the new Go to next NaN action.
Go To Menu improvements
The Go To menu on the SCT was improved to show a menu based on Series Slot Sheets (when available) instead of integer submenus. For more information, see “Go To Menu” in User Interface.
Navigation at bottom of the Sheet
When entering values in a sequence of cells using the enter key, the navigation now stops at the final SCT timestep instead of wrapping around to the next series slot.
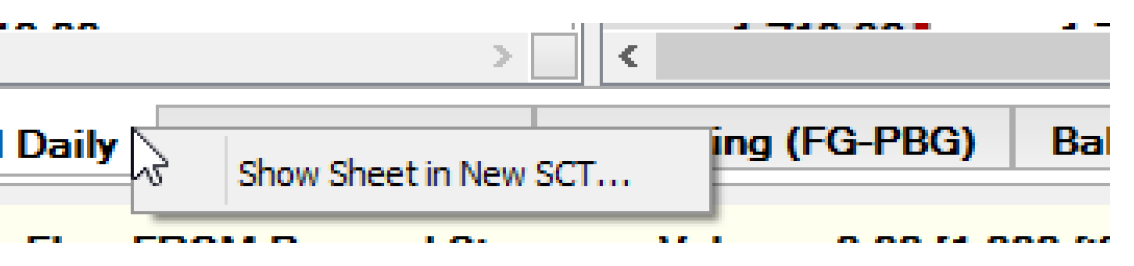
Show Sheet in New SCT
You can now “tear off” a Series Sheet to create a new SCT. This allows you to see multiple sheets at once. On the Series Slots tab, right-click on the sheet tab and choose Show Sheet in New SCT... For more information, see “Create a new SCT from a Series Sheet tab” in User Interface.
Slots
Expression Slot Evaluation Keyboard Shortcut
On the expression slot, the “Evaluate” shortcut key was changed to F9 due to the previous shortcut (Alt-E) conflicting with other operations.
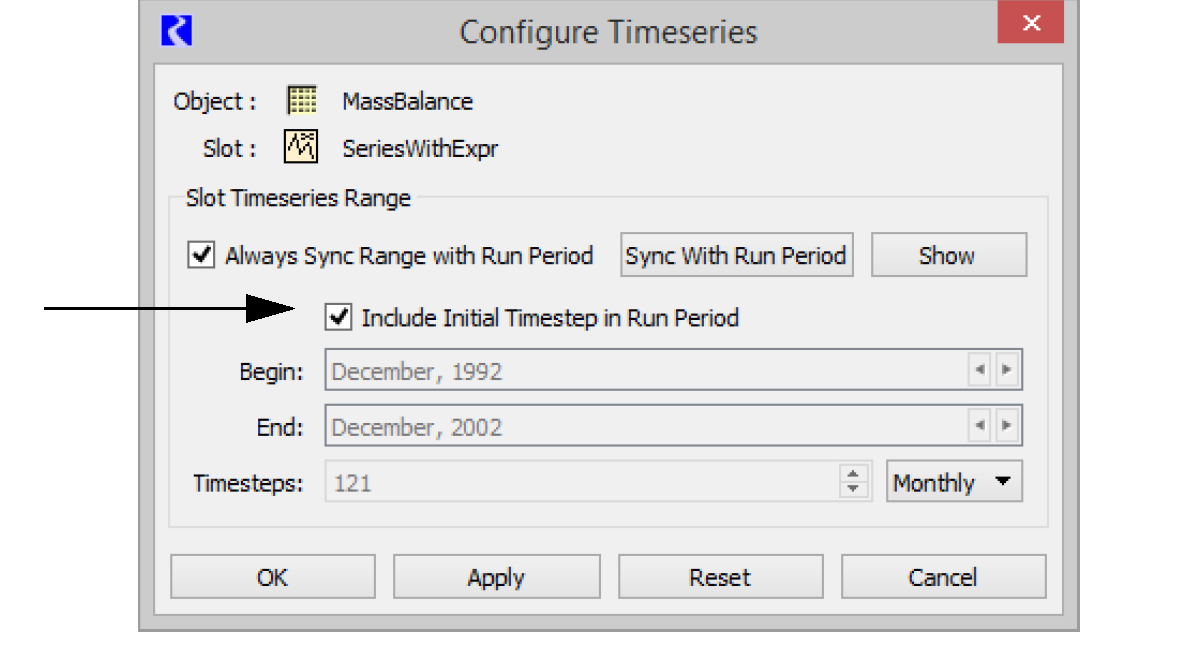
Expression Slot Evaluation Range
On the expression slot, you can now automatically include the initial timestep in the evaluation range. Use the Include Initial Timestep in Run Period toggle as shown.
Go To Next NaN
A new menu item, Go to next NaN now appears on the View menu. Go to next NaN navigates directly from one NaN value to the next through timesteps first then through the timesteps on subsequent columns within the dialog. A new shortcut, Ctrl+Shift+N, also carries out the new Go to next NaN action.
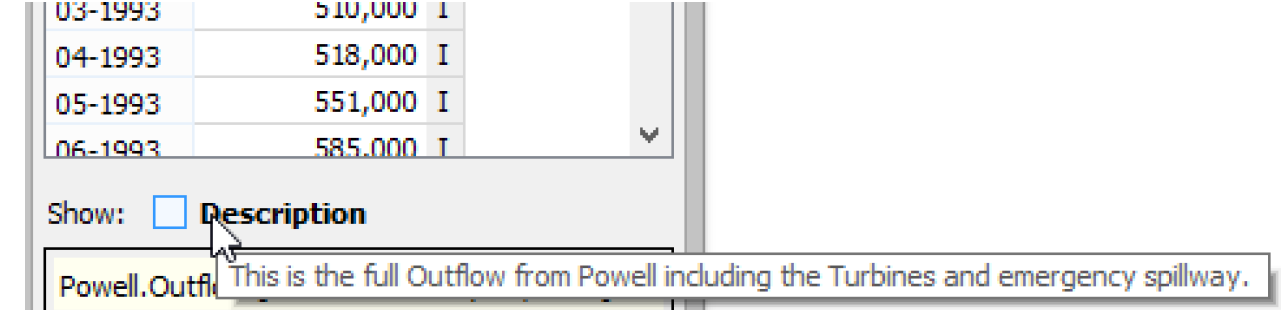
Slot Description Indicator
The Slot dialogs were improved to better show slot Descriptions. Now, when the description panel contains a description, the checkbox label text color is black and the font is bold. When the description panel is empty, the text is grey and the font weight is normal. The border was removed. In addition, when a description exists, the tooltip on the Description text and checkbox shows the first 140 characters of the description.
Text Series Slots
A new type of series slot was added that stores text. The Text Series Slot can be added to any object from the Slot menu. More information can be found “Text Series Slots” in User Interface.
Snapshots
New Icon for Snapshots
A new icon was implemented for Snapshots on the workspace tool bar, Snapshot object, and within the Snapshot Manager.

USACE-SWD Methods
New Debugging Slots
Enhancements were made to the reservoir and computational subbasin objects for better debugging and usability of Flood Control methods. The enhancements include:
• Added a debugging slot on the reservoir object, Downstream Control Point Share, for reporting a reservoir’s share contribution at one or more downstream control points.
• Added a debugging slot, Forecasted Operating Levels, to the computational subbasin to show each reservoir object’s forecasted operating levels. Also a new default None method was added to the Priority Determination category so that the default method does not have this new slot as a dependency.
• Modified the reservoir object’s rating curve table to use elevation rather than storage as the lookup reference for a specified release. A new category, Rating Curve Modification, was added. This category is shown when Flat Top Surcharge is used. This category has the default None method and the new Specify Rating Curves using Elevation method. When this second method is selected, the new Rating Curves using Elevation slot is used to generate the Rating Curves slot (which shows Storage). The Rating Curves slot is also marked as having a source slot.
Units
New Units: Billion Cubic Meters
The volume unit BCM, or Billion Cubic Meters, was added. In addition, flow units BCM/day, BCM/month, and BCM/year were also added.
FlowPerTime RPL Units
RPL Units were added for the FlowPerTime unit type. This allows RPL Policy to reference slots with this unit type.
Unit Converter with DateTime Units
The unit converter was enhanced to allow conversion of DateTime values (as stored on slots) to and from their underlying numeric values. For more information, see “Converting DateTime Values to Numeric Values” in User Interface.
Workspace
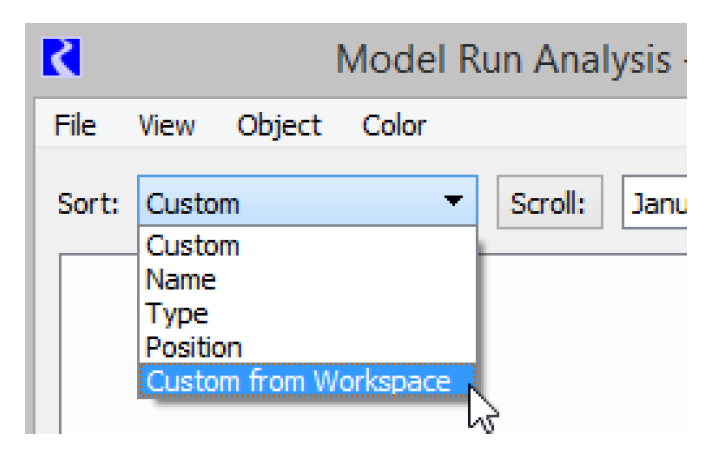
Custom Object Order Dialog
A new dialog was created to provide a mechanism for reordering simulation objects using click and drag, sort-by buttons, and up and down arrows. This is accessed from the workspace Simulation Object List using the Sort Edit Custom Order option.
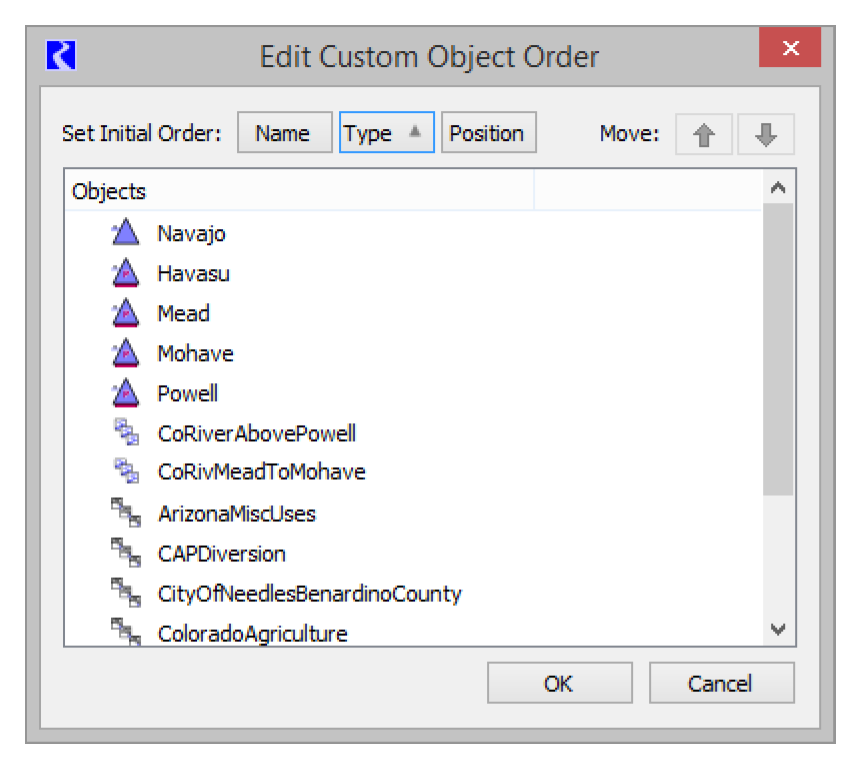
For more information, see “Simulation Object List” in User Interface.
The Model Run Analysis and workspace Object Coordinates dialog were enhanced to allow you to use the workspace custom order in those dialogs too.
Output Canvas Items Shown on Workspace
Output Canvas Teacups, Charts, and Text can now be shown on the Simulation and Geospatial workspace views as described “Teacups / Charts / Text shown on workspace”.
As part of this work, the datetime spinner and animation controls were added to the dockable panel below the object list. Use this to advance the canvas items through time.
Closed Bug Reports
The following bugs have been closed for this release. For more information on any bug, see the CADSWES website. The bugs are listed in order by bug number:
5588 | 5650 | 5654 | 5678 | 5713 | 5718 | 5801 |
5813 | 5837 | 5839 | 5856 | 5858 | 5860 | 5861 |
5862 | 5863 | 5864 | 5865 | 5867 | 5868 | 5870 |
5871 | 5872 | 5874 | 5875 | 5876 | 5877 | 5878 |
5880 | 5881 | 5884 | 5885 | 5886 | 5888 | 5890 |
5891 | 5892 | 5896 | 5899 | 5900 | 5901 | 5902 |
5903 | 5905 | 5908 | 5911 | 5912 | 5913 | 5914 |
5915 | 5916 | 5917 | 5922 | 5923 | 5924 | 5925 |
5926 | 5927 | 5930 | 5931 | 5933 | 5935 | 5938 |
5939 | 5942 | 5943 | 5945 | 5946 | 5947 | 5948 |
5950 | 5951 | 5952 | 5953 | 5954 | 5956 | 5957 |
5958 | 5959 | 5961 | 5962 | 5963 | 5967 | 5968 |
5969 | 5970 | 5972 | 5974 | 5975 | 5976 | 5978 |
5983 |
Revised: 11/11/2019