
User Interface
System Control Table (SCT)
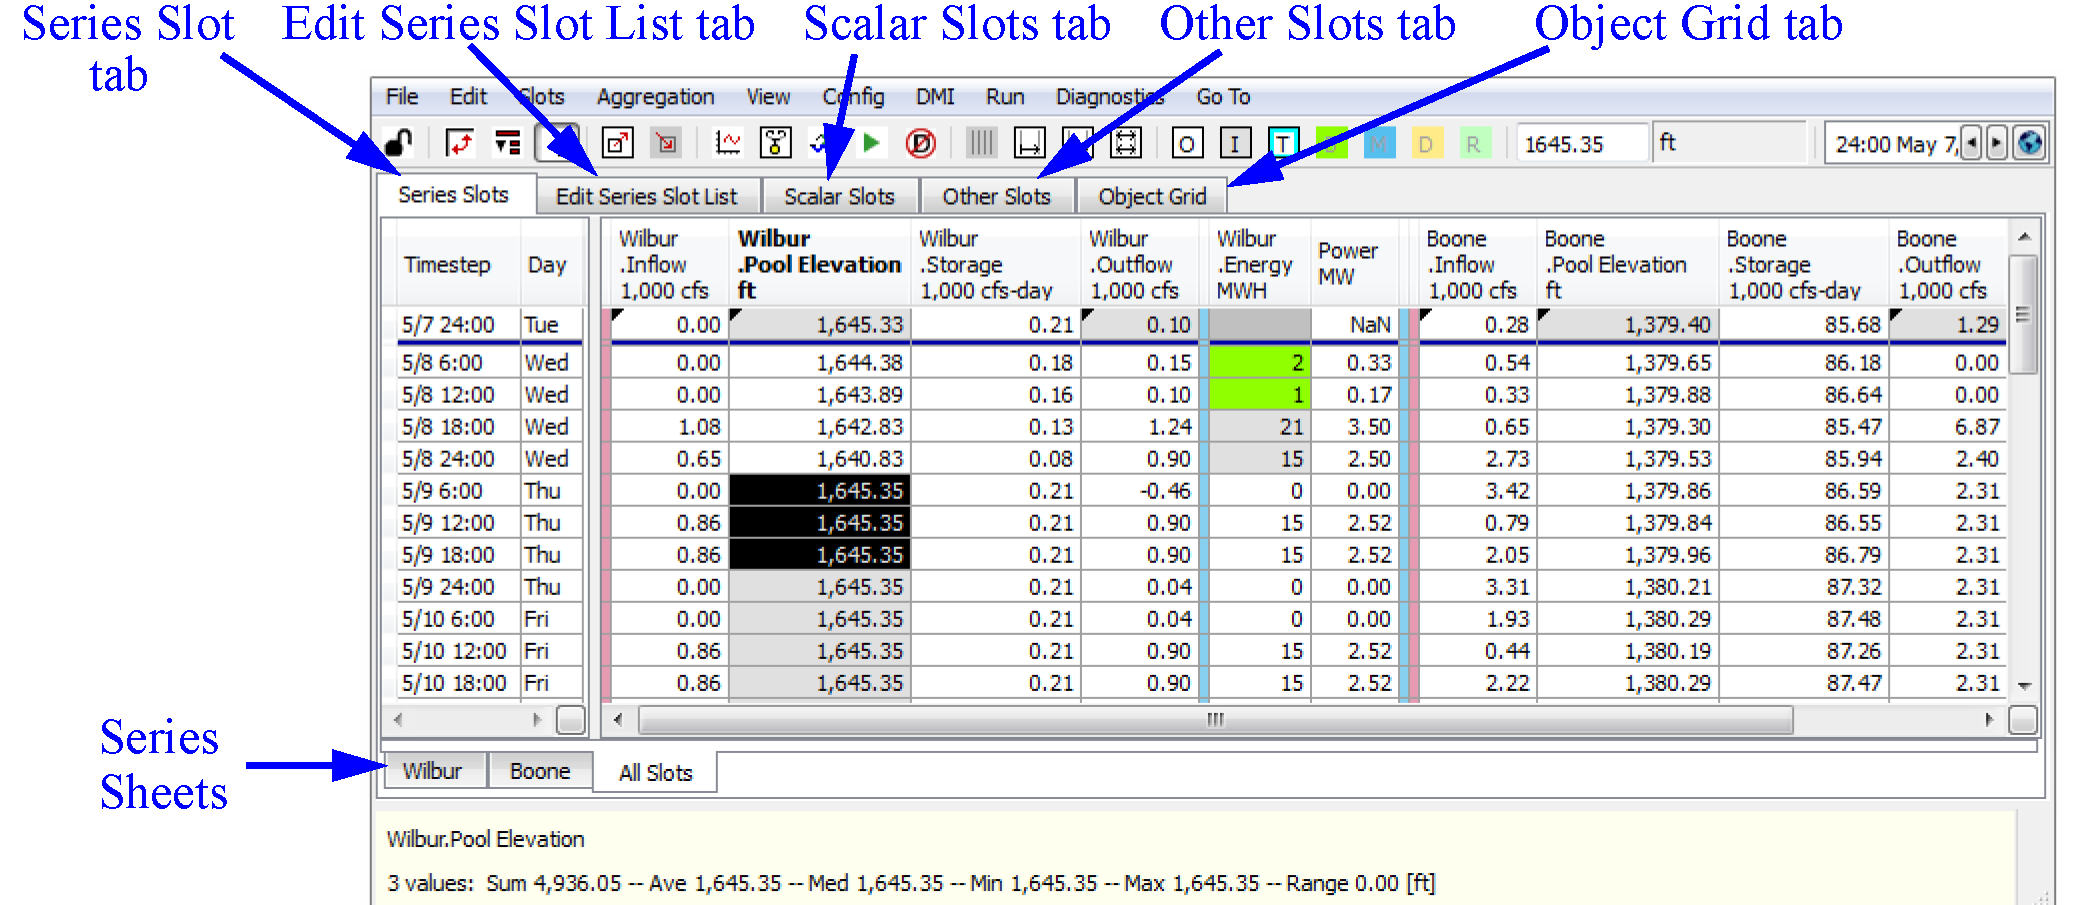
The RiverWare System Control Table (SCT) is a customizable, editable view of slots and data in a RiverWare model. It provides five top-level tabs, or views of different types of data. Figure 8.1 illustrates.
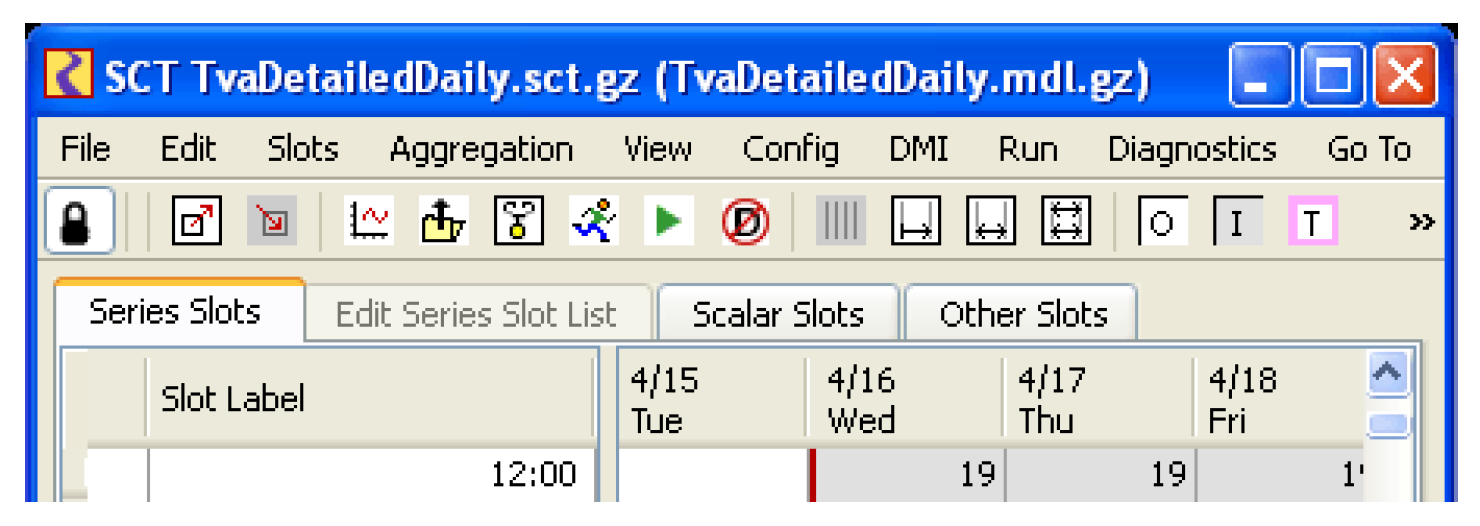
• Series Slots. Series data (series slots, including Agg Series Slot columns, and Table Series Slot columns) on physical simulation objects and accounting slots can be displayed. The SCT presents series data in a scrollable grid of numeric values. Background colors are used to indicate each slot timestep’s flag value—generally an indication of how the numeric value was created. Custom text and background colors can be configured to alert you when values are within a specified interval. The series data can be further organized into user defined Series Sheets that provide tabs on the bottom of the SCT.
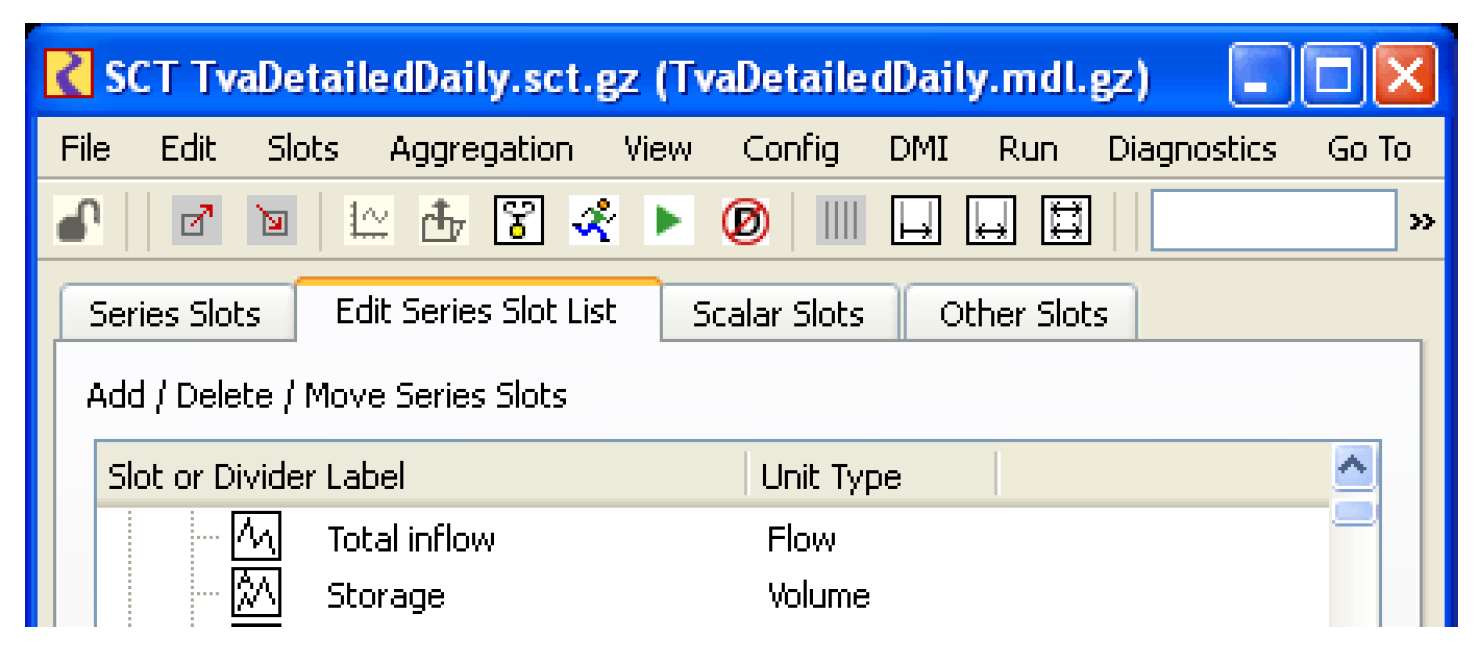
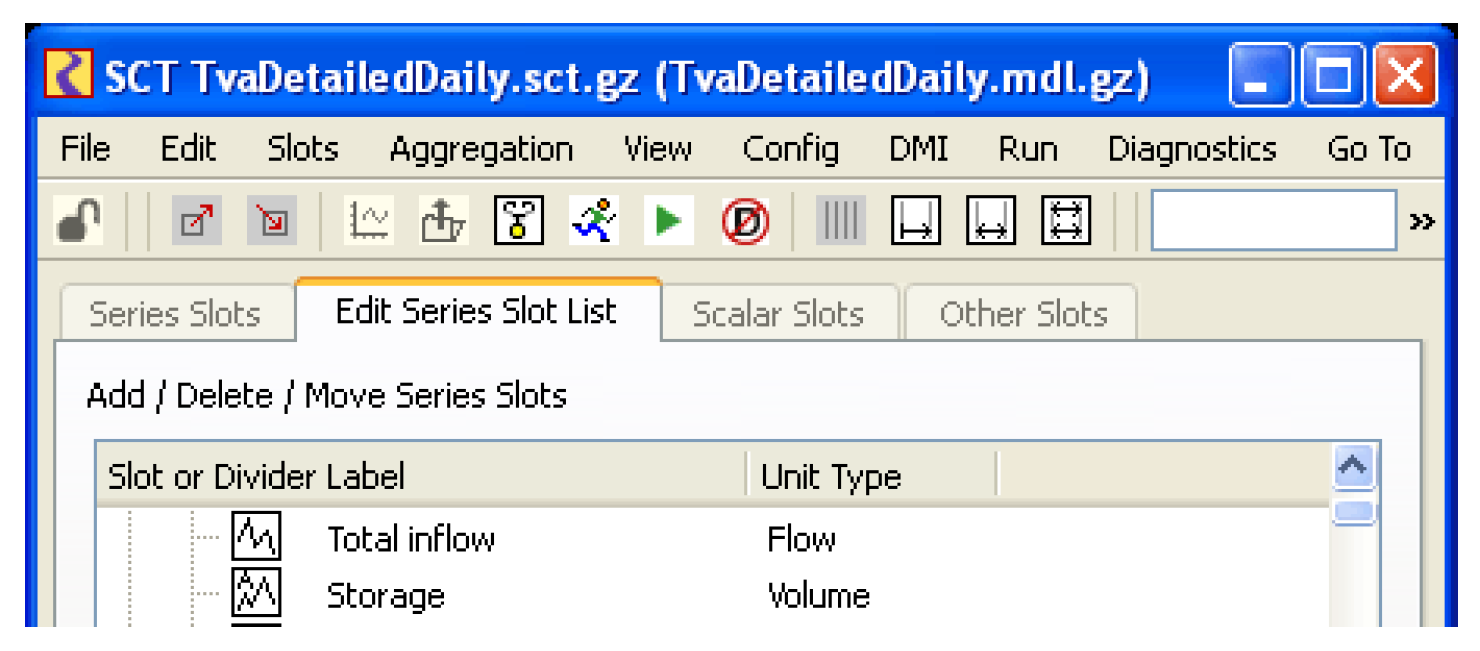
• Edit Series Slot List. A list of series slots can be shown for configuration purposes. Slots can be added/deleted, or re-arranged. Similar sections or groups can be duplicated for other objects. When applied, the organization in this table is used for the Series Slots tab.
• Scalar Slots. A list of scalar and 1x1 table slots can be shown and edited from the Scalar Slots tab.
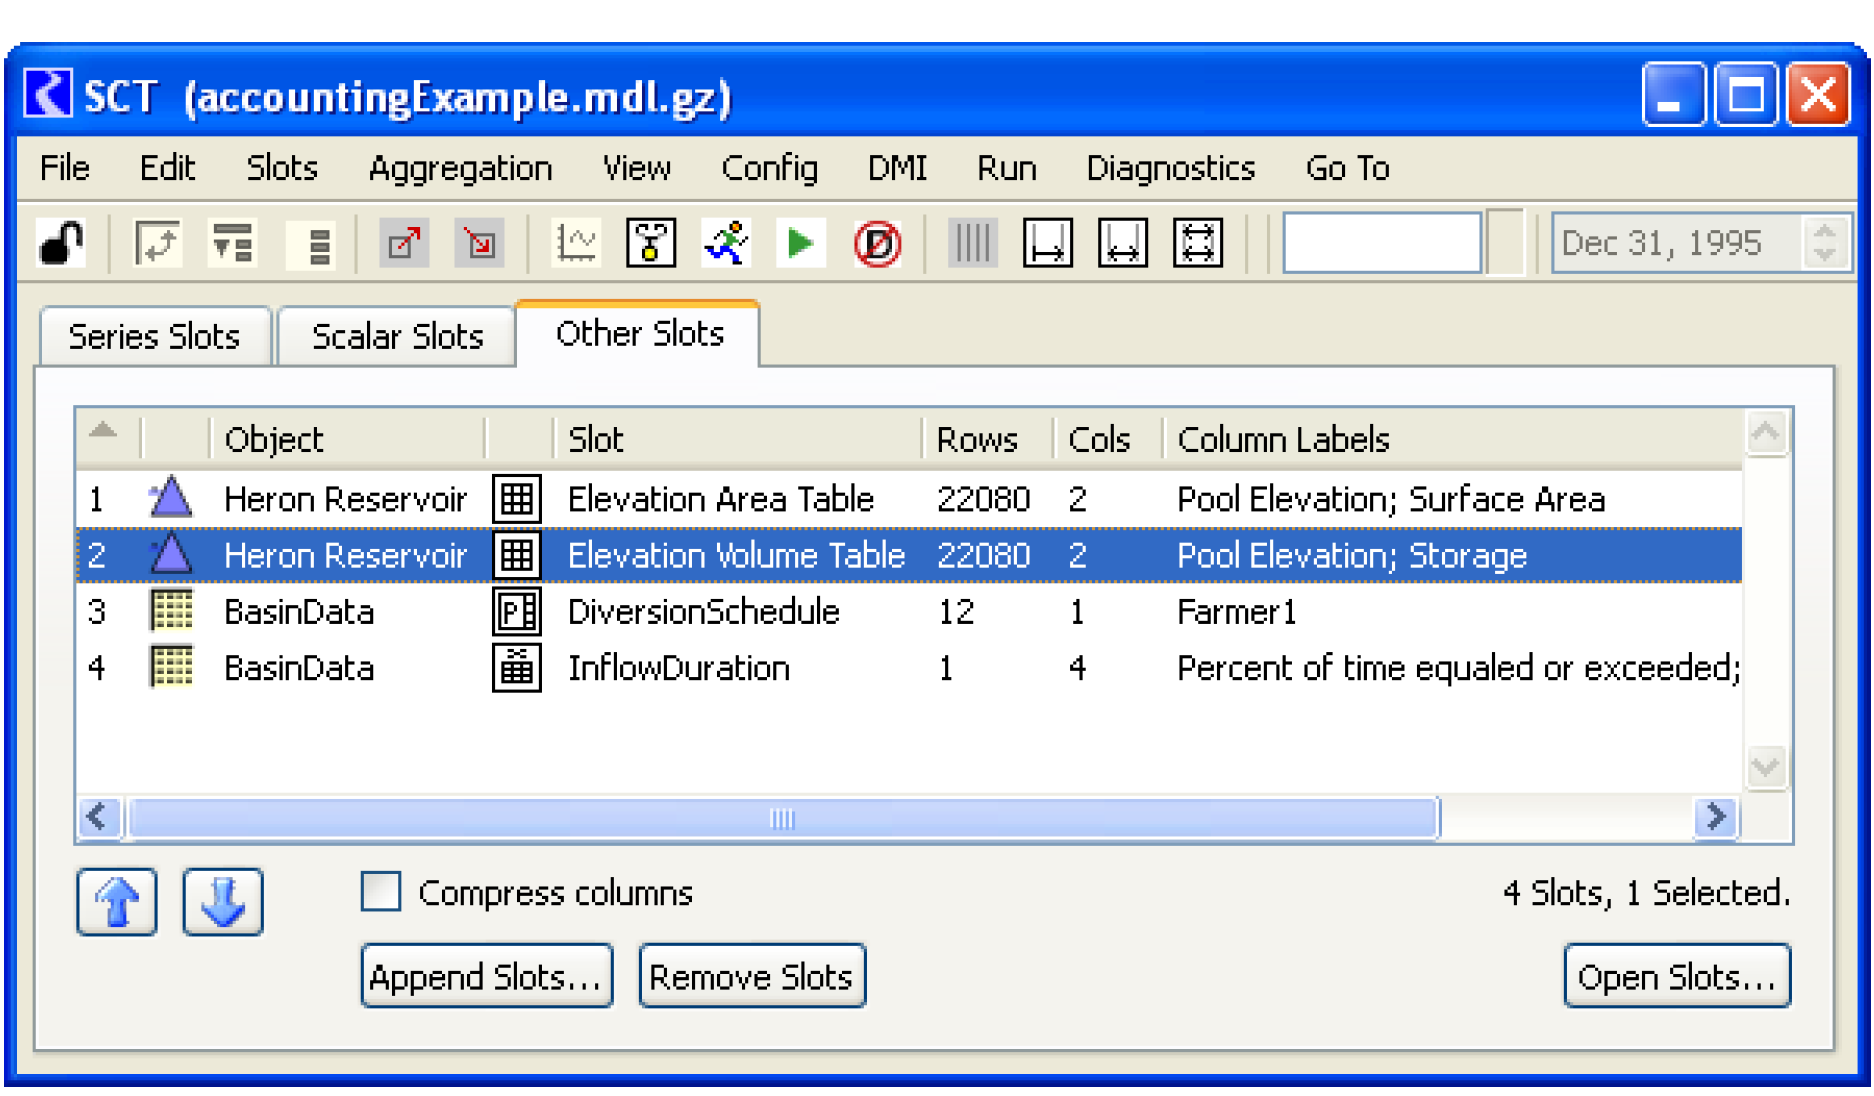
• Other Slots. A list of the other types of slots can be displayed including table, periodic, list, and statistical tables. These are not editable but allow you to keep track of different slots without opening each individually.
• Object Grid. A grid of objects and their contained scalar and table slots can be shown. This view is particularly useful when specifying parameters on objects that interact with one another, like groundwater objects.
Figure 8.1 Annotated illustration of the System Control Table tabs
Data in the SCT
The data displayed in an SCT is contained in the RiverWare model, rather than in the SCT. Therefore, editing data displayed in an SCT does not affect the SCT—it affects only the RiverWare model. The SCT is just a configurable window into the model.
The SCT configuration—i.e., the settings which can be saved and reloaded as an SCT—consists of the following sections:
• Lists of RiverWare slots
• Configurable display properties for each of those slots
• A set of general configurable display properties for the overall SCT
• An aggregation definition for aggregating multiple timesteps within each slot
• Object and slot ordering on the Object Grid tab
The time range displayed by the SCT matches the RiverWare model’s Run Control configuration, plus a configurable number of pre- and post-simulation timesteps. See “Run Menu” for details.
Many SCTs may be used simultaneously within a single RiverWare session (i.e., showing distinct views into the same RiverWare model). An SCT may be used with different RiverWare models as long as the Object and Slot names are the same.
SCT Overview
Following is an overview of the SCT and its organization. First the general areas of the SCT are discussed, then each of the tabs—Series Slots, Scalar Slots, and Other Slots—are discussed.
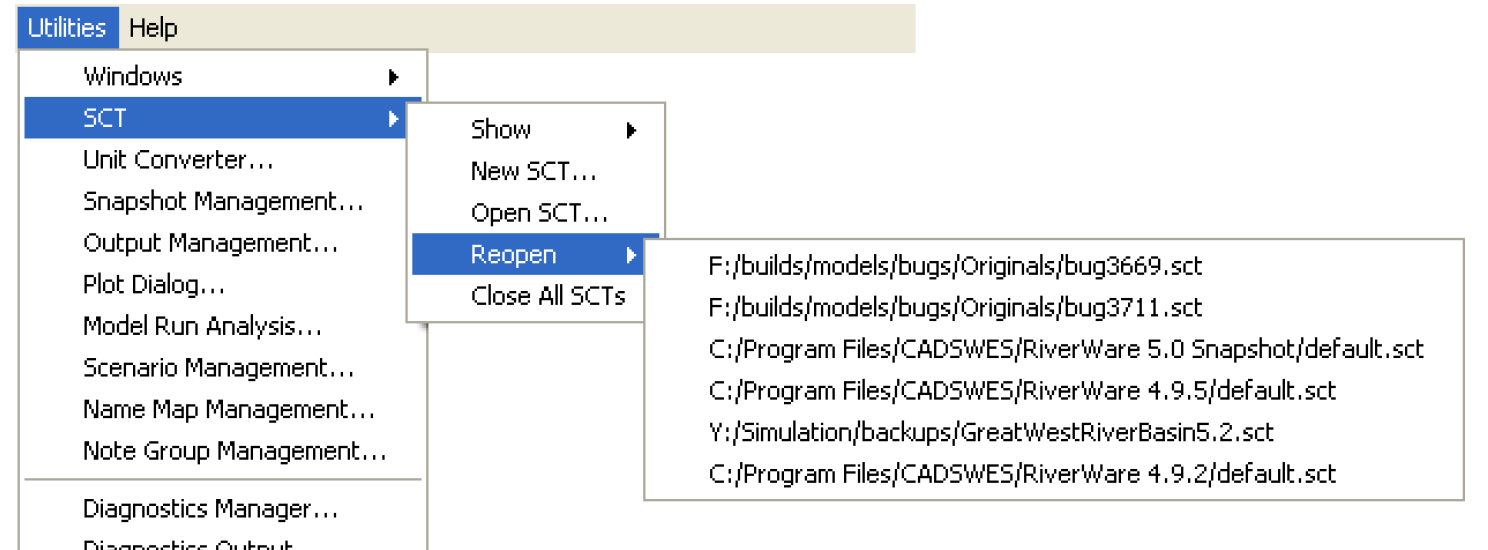
Menus in the RiverWare Workspace (select Utilities, then SCT) and the SCT File menu provide the following functions:
• New SCT. Create an empty SCT in a new SCT window.
• Open SCT file using the file chooser.
• Show and raise an open named SCT.
• Reopen a recently-accessed SCT File. Up to six SCT files are remembered from one RiverWare session to the next. SCTs which are already open are excluded from the Reopen menu. (Those appear instead in the Show menu).
Figure 8.2 shows the SCT menus in the RiverWare Workspace and in the SCT file menu.
Figure 8.2
Create a new SCT from the RiverWare Workspace menu. Select Utilities, then SCT, then New SCT. The SCT initially will have the user-defined default configuration.
After creating a new SCT, the Edit Series Slot List tab is shown (see “Edit Series Slot List Tab”). If you are adding slots to the Series Slots tab, you will want to add Slots and Slot Dividers. Otherwise, you can cancel and go to the desired tab to begin configuration. See “Add Slots, Sheet Tabs, and Slot Dividers” for details.
SCT Menu Bar

The SCT menu bar is described in the following sections.
• DMI Menu
• Run Menu
File Menu
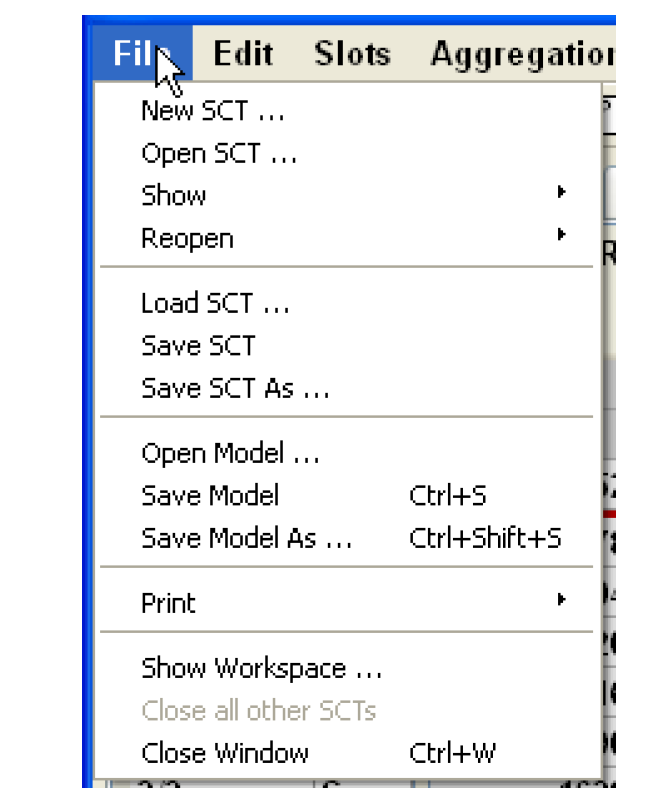
The SCT File menu supports the following operations:
• New SCT lets you create a new SCT.
• Open SCT lets you open an additional SCT so there is more than one SCT open for the model.
• Show lets you select an opened SCT and brings it to the front.
• Reopen lets you select a previously opened SCT and then loads it.
• Load SCT lets you open a different SCT file in place of the particular SCT. The current SCT is replaced with the loaded one.
• Save SCT and Save SCT As saves the current SCT configuration as an SCT file.
• Open Model, Save Model and Save Model As perform the same operations as the Save and Save As operations in the RiverWare workspace. They neither affect the SCT nor cause the SCT configuration to be saved.
• Show Workspace brings the workspace to the front.
• Close all other SCTs closes any other SCTs except the given one.
• Close Window closes the SCT; however, this does not automatically save the SCT configuration.
Edit Menu
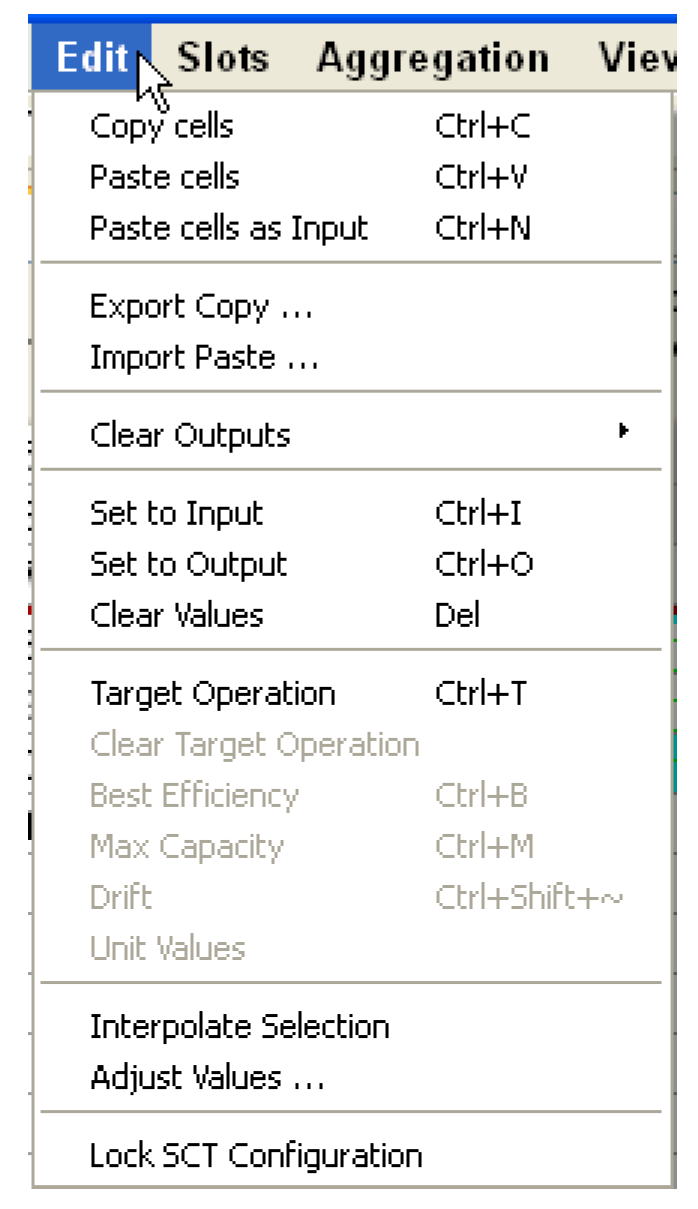
The SCT Edit menu supports the following operations.
The behavior of the Copy and Paste operations depends on the nature of the current selection within the SCT. See the following topics:
Note: These Copy and Paste operations use the internal clipboard to store data. The Export Copy and Import Paste operations use the system clipboard.
See “Copy and Paste” for the difference between the default paste operation and paste as input.
Slots Menu
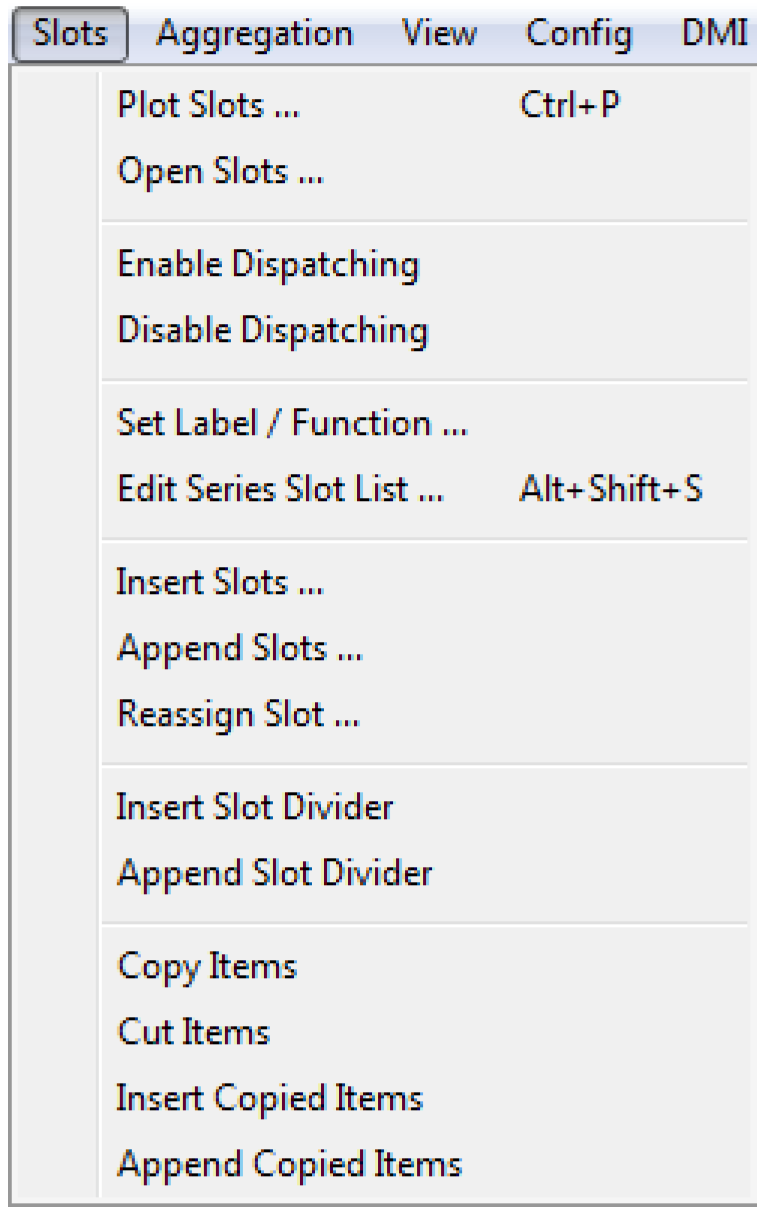
The SCT Slots menu supports the following operations:
• Open Slots. Opens selected slot(s).
• Enable Dispatching and Disable Dispatching. Set the dispatching state of the simulation objects containing the current SCT slot selections. Slots on a simulation object with dispatching disabled are indicated with a crosshatch of a configurable color (see “Color Tab”) on slot labels in the row header table (in Horizontal Timestep Axis Orientation only).
• Edit Series Slot List. Takes you to that tab.
• Other copy, cut, insert, and append operations. See “Move Slots and Slot Dividers” for details.
Aggregation Menu
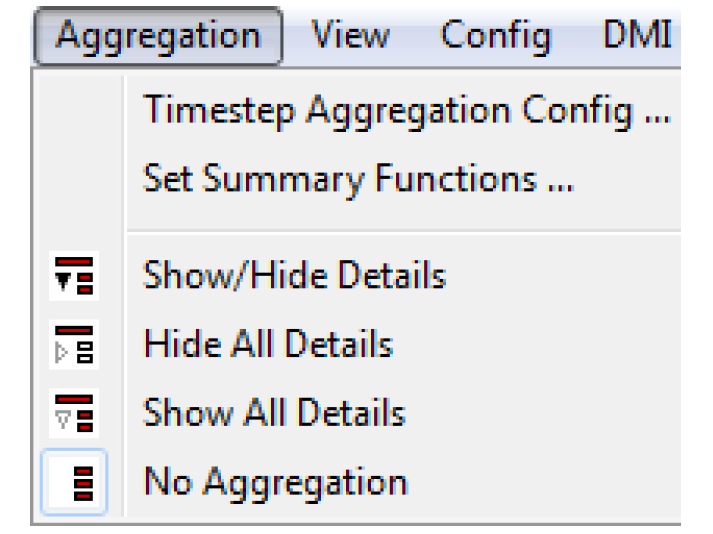
The SCT Aggregation menu allows you to aggregate the data up to a larger timestep. For example, for an 1 Hour timestep model, aggregate and show values at a 1 Day timestep. The following operations are available in the Aggregation Menu:
• Timestep Aggregation Config. Shows the SCT Timestep Aggregation Dialog.
• Set Summary Functions. Shows the Set SCT Aggregation Summary Functions dialog
• The Show/Hide Details, Hide All Details, Show All Details, and No Aggregation exclusive checkboxes select the SCT detail mode. The first three choose the aggregated view of the currently selected Axis Orientation (see “View Menu”), and No Aggregation shows the corresponding non-aggregated view. See “Show or Hide (Aggregation) Summaries” and “Show or Hide Details” for details.
View Menu
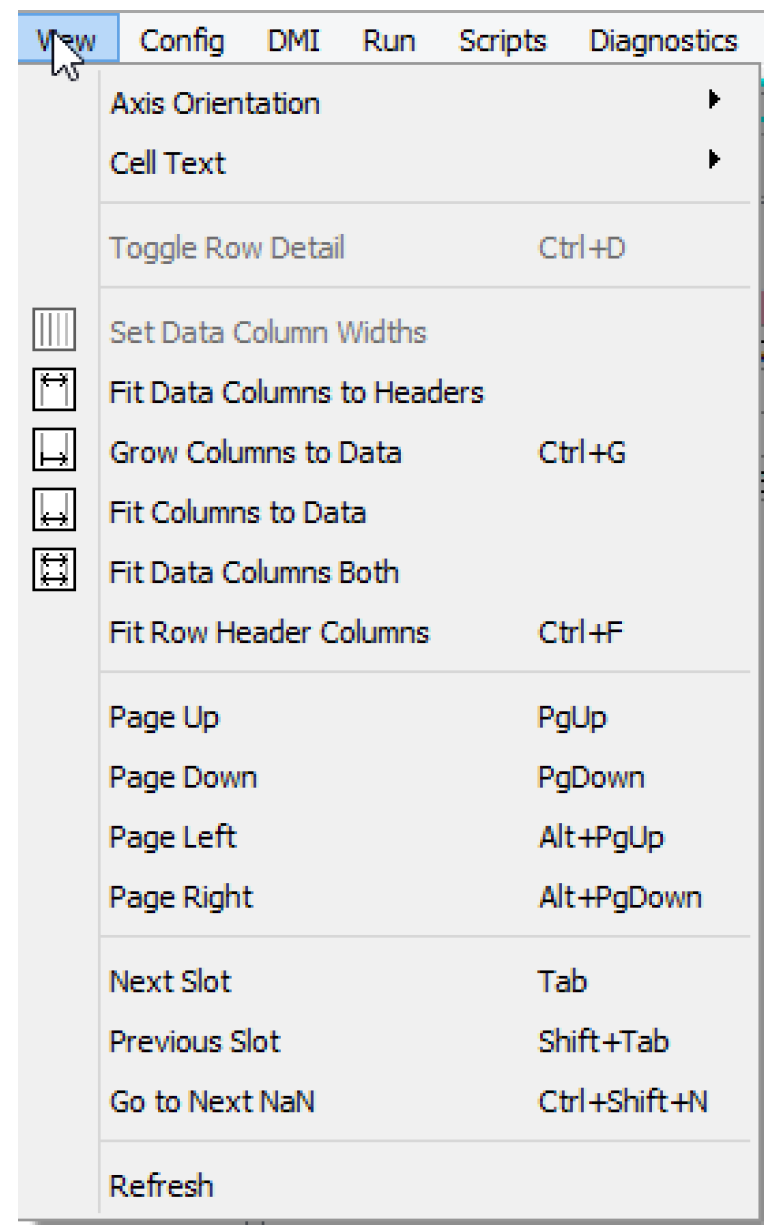
The SCT View menu supports the following operations.
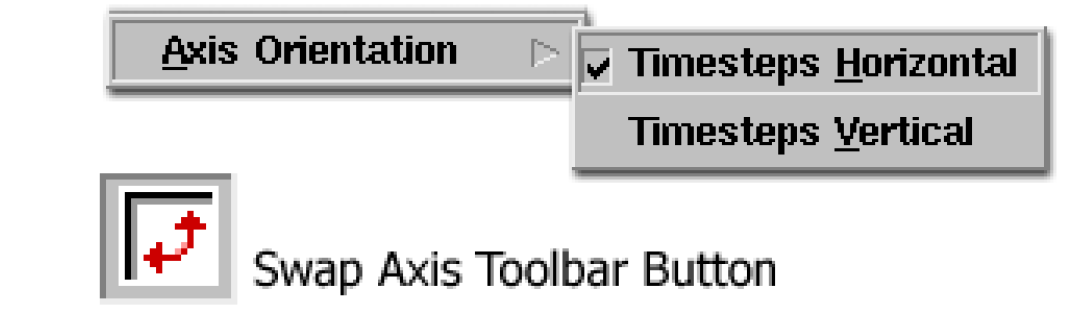
• Axis Orientation. The Axis Orientation selections switch between horizontal timestep axis orientation and vertical timestep axis orientation. See “Axis Orientation” for details.
• Cell Text. The Cell Text menu allows you to show numeric Values Only, values and flag letters (also Flag Letters), or values, flag letters and priority numbers (also Priority Numbers). Priority numbers are only relevant when using rulebased simulation. This is a temporary setting—it is not saved in the SCT file.
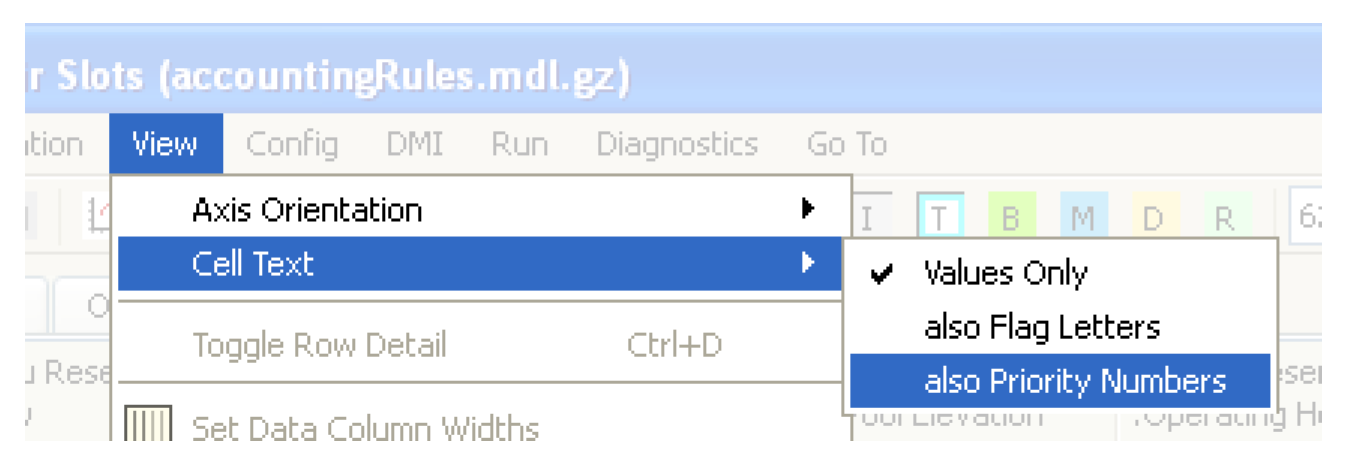
The SCT also shows tooltips indicating which rule or DMI was responsible for the value, where applicable. Hover over a value to see this information. See “Tooltips” for details.
• Alternate Row Detail. See “Show or Hide Details” for details.
• Column Width. See “Adjust Column Widths” for details on Set Data Column Widths and the various fit column operations.
• Page Up/Down/Left/Right. The various page operations scroll the SCT window in the indicated direction. Although you generally will access these via the indicated keyboard accelerators, these operations are included in this menu to document their implementation.
• Next Slot/Previous Slot. The Next Slot and Previous Slot operations move the active cell to the next or previous Slot.
• Go To Next NaN. The Go To Next NaN operation navigates to the next NaN (Not A Number) in the slot. The search always go first through timesteps, then through the subsequent slots. An accelerator key combination Ctrl+Shift+N also executes the search.
Config Menu
The SCT Config Menu allows you to access the configuration settings. The menu choices open the configuration dialog to the specified tab. See “SCT Configuration Settings” for details.
See “Use the Default Configuration” for details on the Defaults operations.
DMI Menu
The DMI menu includes all defined Input and Output DMIs and DMI Groups, along with I, O, or G icons. The menu has a checkbox to switch between the presentation of all items in the single top-level menu (if there aren’t too many items), or cascaded into three menus. Choosing a DMI or Group will invoke that DMI! You can also show the DMI Manager from this menu.
Run Menu
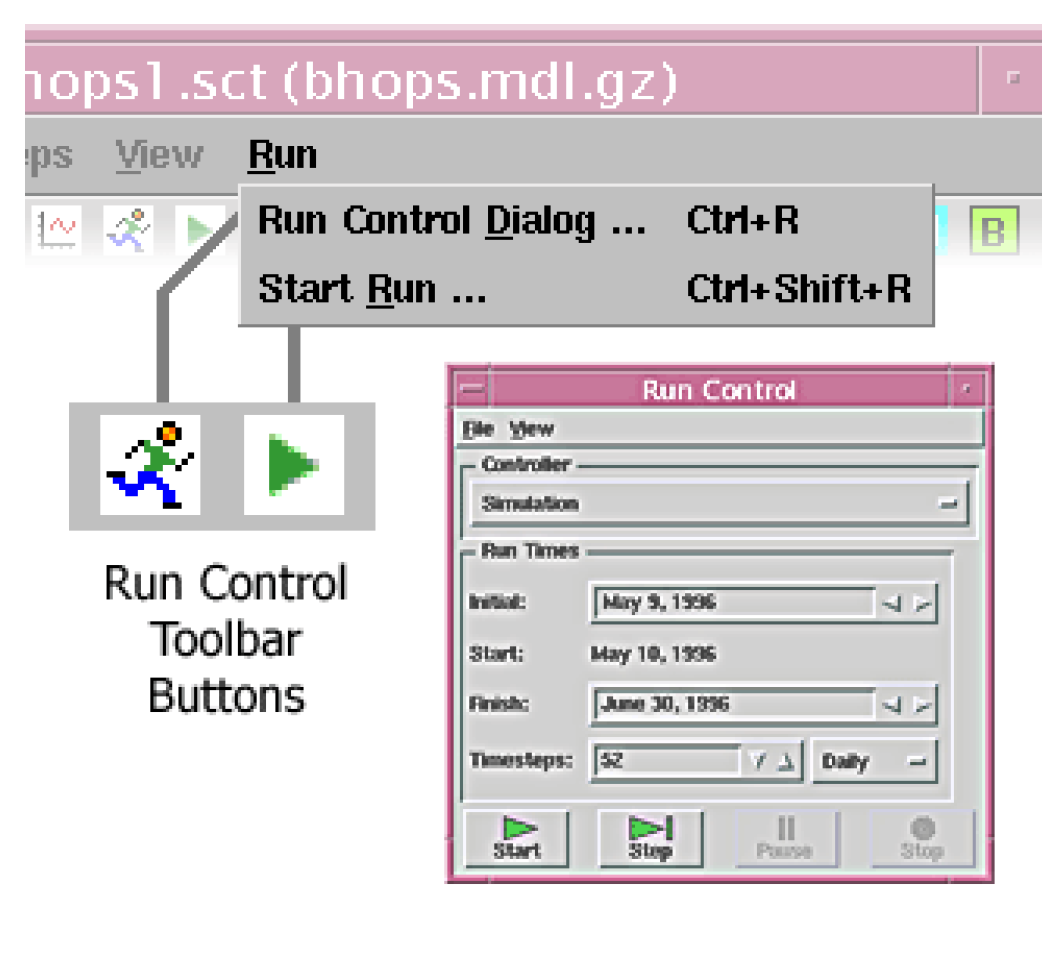
The SCT Run menu and toolbar buttons allow you to make a run directly from the SCT.
• Run Control Dialog shows the Run Control dialog (also pictured here).
• Start Run initiates a run using the selected controller and run times indicated in the Run Control dialog.
• Run Analysis opens the Model Run Analysis tool.
Scripts Menu
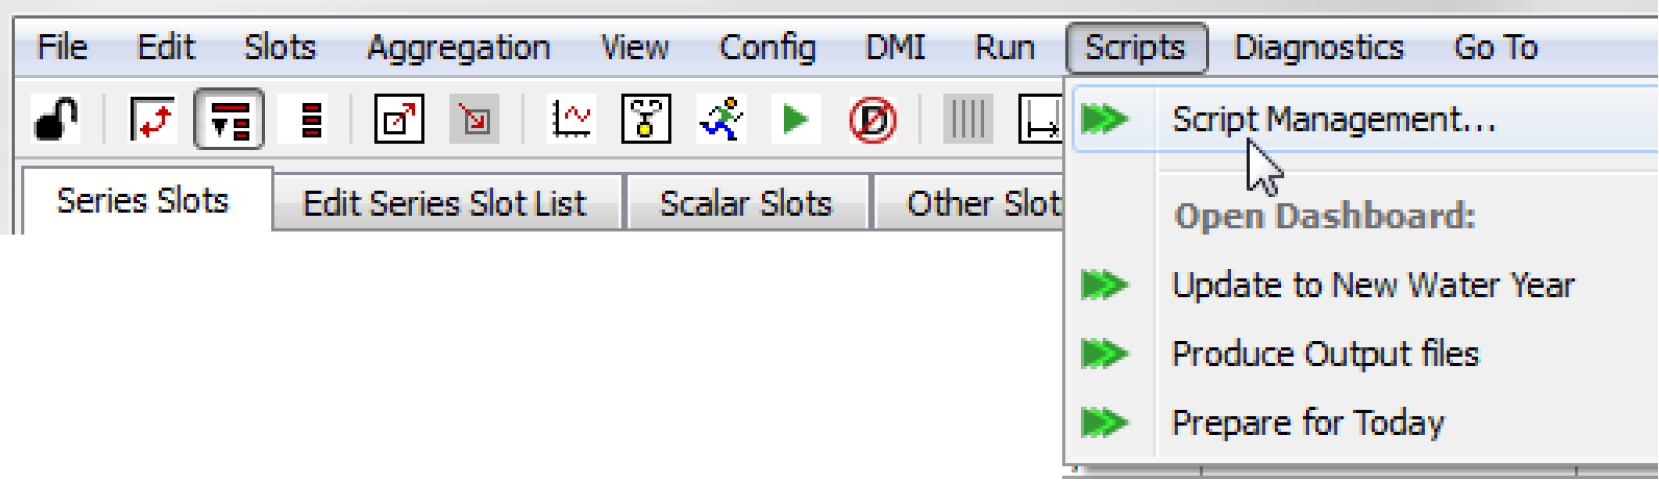
The SCT Scripts menu allows you to access scripts directly from the SCT.
Use the Script Management menu to open the Script Manager. Or use the menu options for each named script to open that script’s dashboard dialog.
Diagnostic Menu
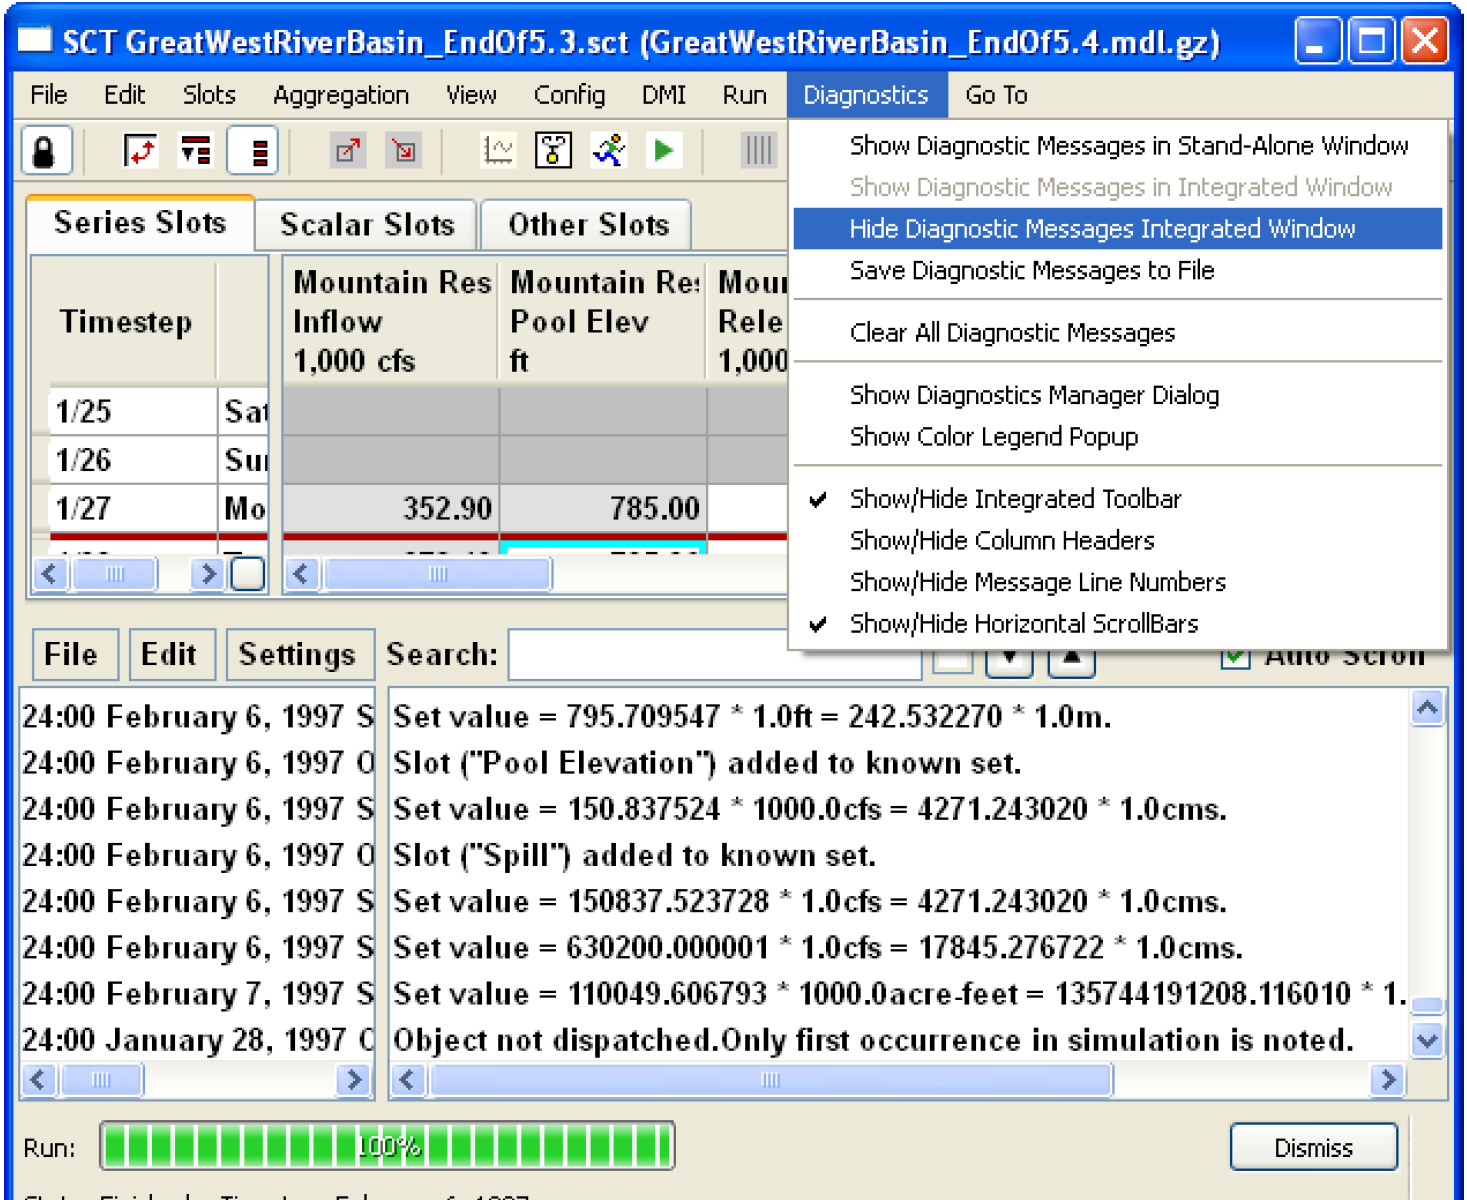
The Diagnostic Output window can be shown as a panel at the bottom of a single SCT or as a stand-alone window. It will appear in only one place at any given time. Diagnostics can be enabled in or out of the SCT using the stethoscope icon in the SCT toolbar or the SCT Diagnostics menu.

To reduce the amount of vertical space taken up by the Diagnostic Output panel, you can hide the Diagnostic Window’s integrated menu/toolbar. The menu operations in integrated menu-/toolbar are also available in the SCT Diagnostics menu.

Status Area
When a run is started, the selection status area of the SCT is replaced with the a display of the run status (if that is enabled in the SCT configuration). This is displayed until you select somewhere in the SCT table or select Dismiss. Unlike the Diagnostic Output, the Run Status will simultaneously be displayed in multiple SCTs and as a stand-alone dialog. However the stand-alone popup is not automatically raised if the Status can be displayed in an open SCT (i.e. by showing and raising any SCT which is already open).
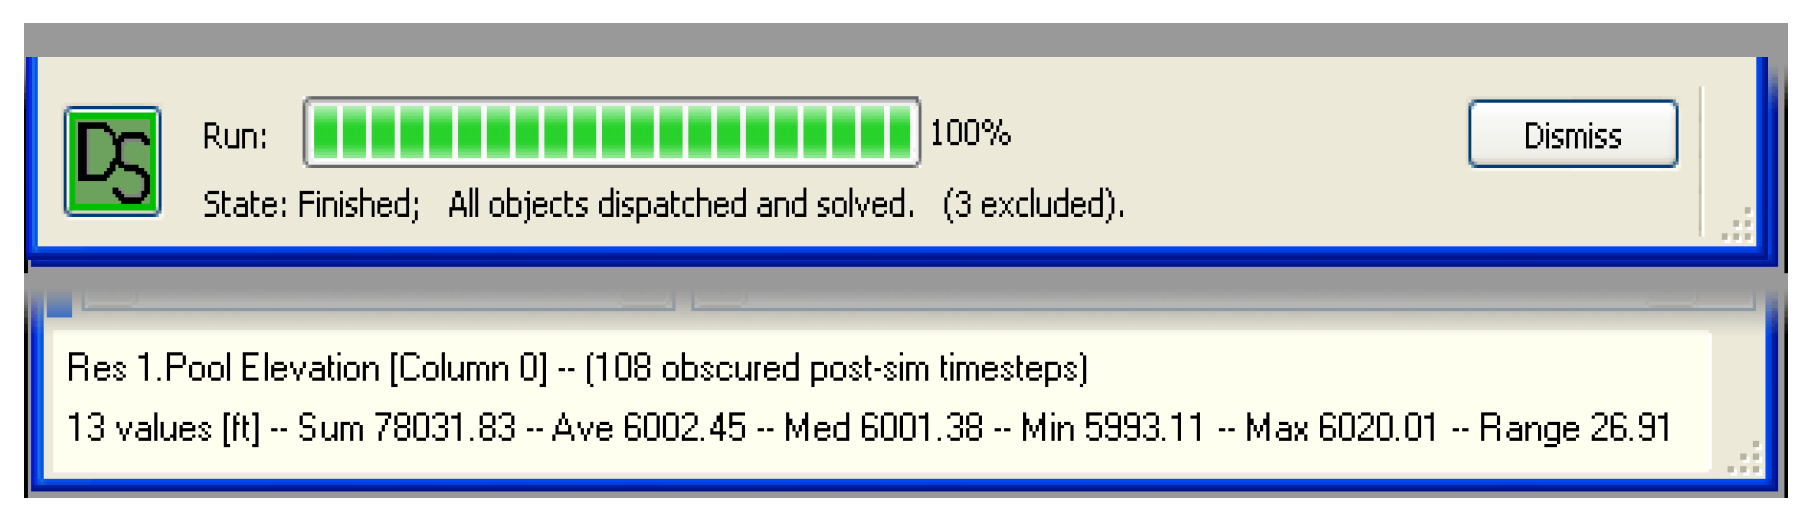
Also shown in the Run Status area is information on the dispatching of objects within the run. An icon is shown that displays the most limiting dispatching of objects within the run. Also displayed are the number of objects that meet the most limiting condition.
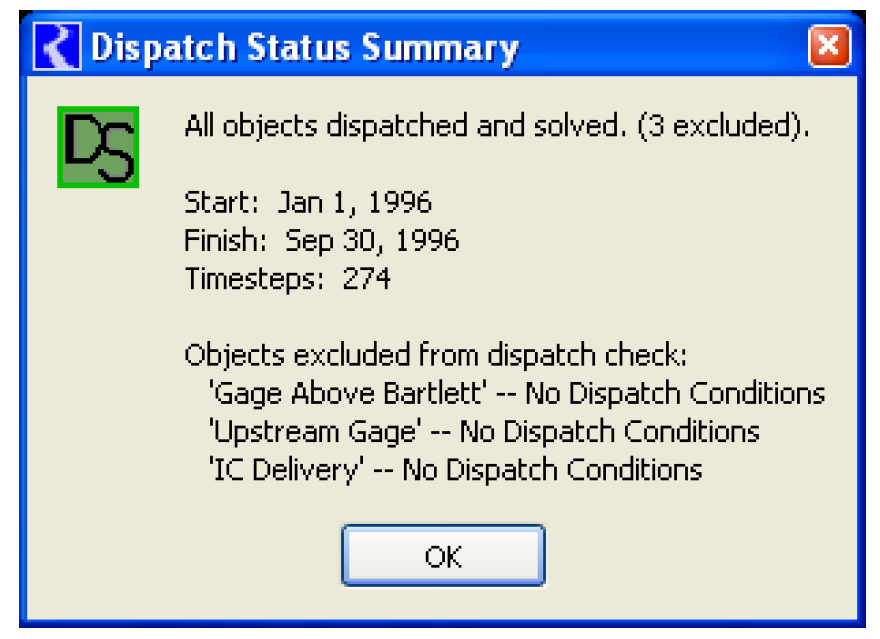
Selecting the icon takes you to the Model Run Analysis tool (see “Simulation” in Debugging and Analysis for details), with the first relevant object at the earliest timestep highlighted. When you Shift-Click on the icon, a dialog is shown with a summary of the run analysis. Listed are the objects and numbers of objects that have dispatched, dispatched but not solved, and those that have not dispatched.
Go To Menu
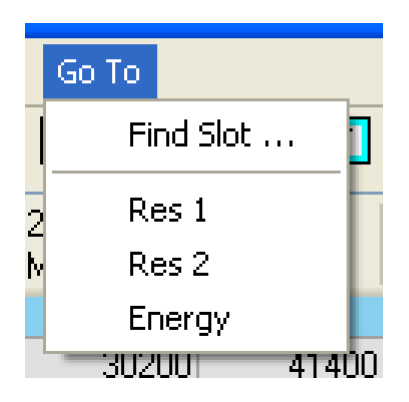
The SCT Go To menu allows you to scroll to named locations in the SCT. This can be useful when an SCT has a large number of slots that do not fit on a single screen.
• Find Slots. The Find Slot option allows you to enter a slot name (including wildcards) and the SCT will search for that name.
• Dividers. The other options in the Go To menu will scroll to any of the Sheet Dividers or Slot Dividers in the SCT, as referenced by name. The divider names are either a unique label (set by selecting Slots, then Set Label / Function when the divider is selected; see “Slots Menu”) or using the default name, which is the slot just to the right of or below the divider as follows:
– If the SCT contains Sheets, Go To menus are presented for each Sheet.
– For Sheets that contain Slot Dividers, a menu is presented with an initial Start of Sheet item, and items for each contained Slot Divider.
– If the SCT doesn't contain sheets, then Slot Dividers are presented as top-level items.
SCT Configuration Settings
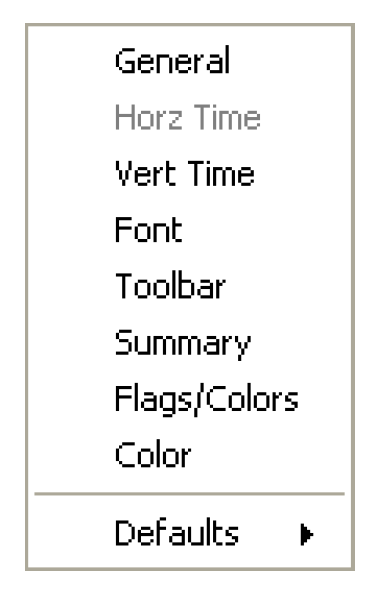
Most of the settings for an SCT are controlled through the SCT Configuration dialog, which you can access from the Config menu. All options will open the configuration dialog but depending on the menu selected, the appropriate tab will be enabled.
The properties this dialog supports are described in the following sections:
General Tab
To display the SCT Configuration dialog, select SCT Config, then General.
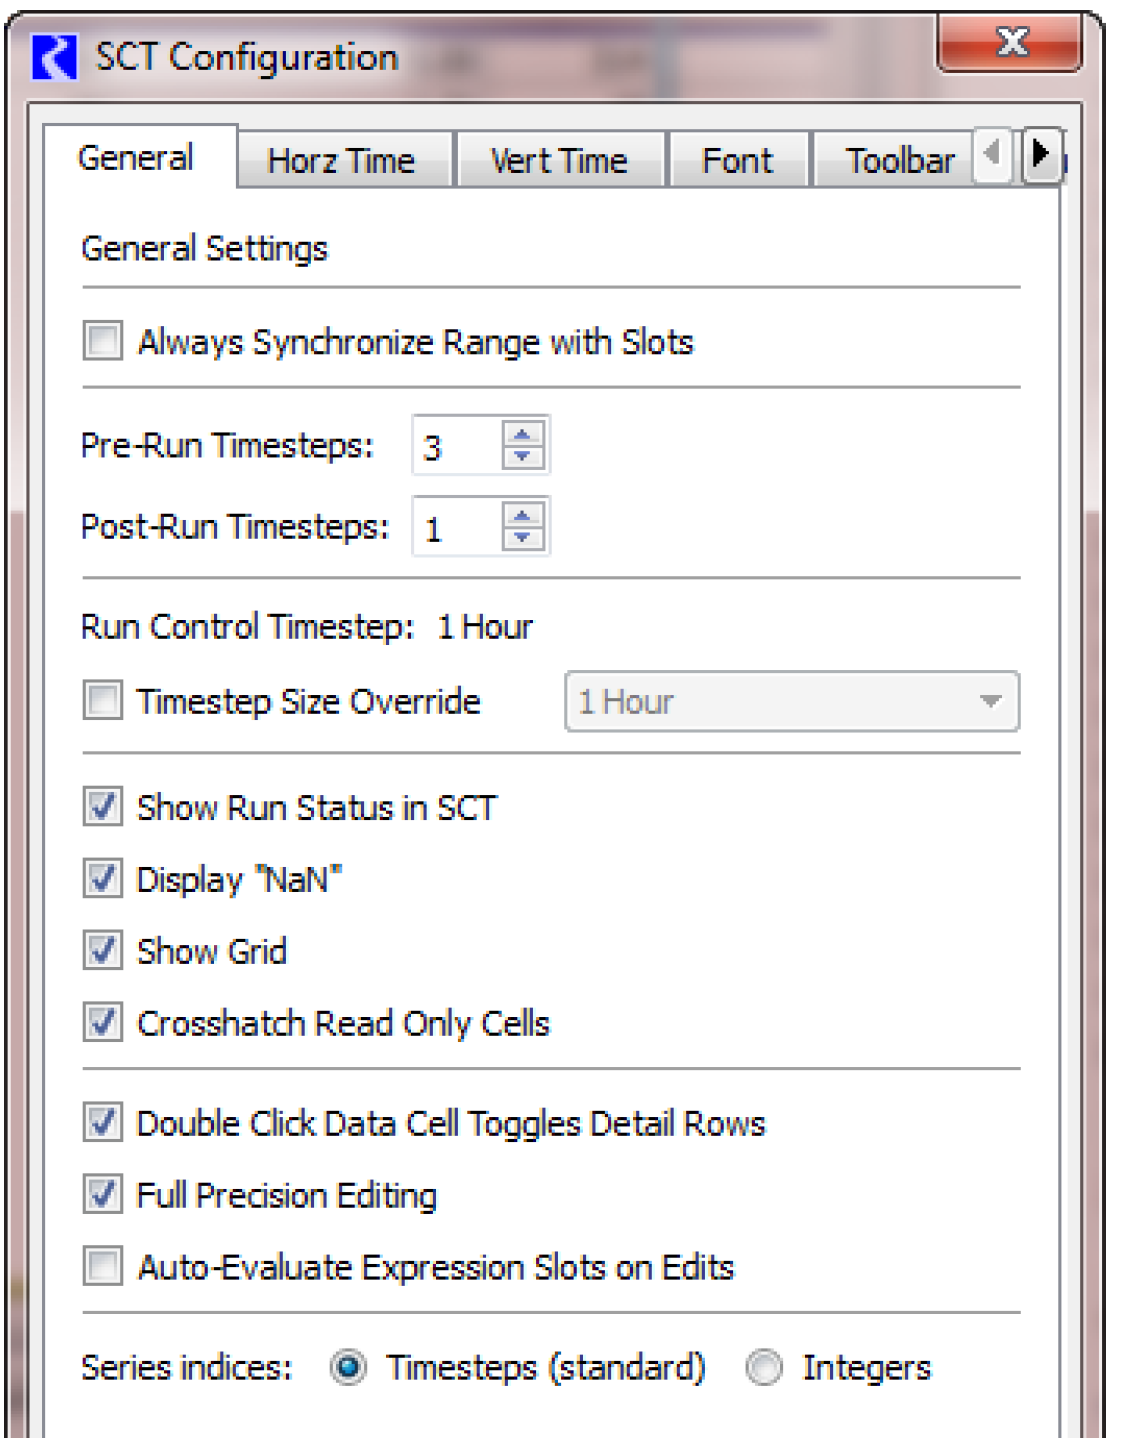
• The Always Synchronize Range with Slots option disables the time range settings in the SCT. The SCT timesteps will be the same as the timesteps of the slots shown in the SCT. Checking this box disables the next three settings.
• The Pre-Run Timesteps and Post-Run Timesteps integer selector values are used to extend the SCT beyond the run range. The indicated timesteps number is added to the RiverWare model’s Run Control time range. See “Run Menu” and “Timesteps” for details.
• The Timestep Size Override lets you configure the timestep to use a timestep different than the run.
• See “Change Ornamentations” for details on the various display options in the middle area of the SCT Configuration dialog.
• The Double-click Data Cell Toggles Detail Rows setting allows you to change the behavior of double selecting the SCT data table. Turning this option on replaces the default behavior of double-clicking (i.e., initiating an edit) with an open/close details operation. Although the latter functionality is relevant only for the aggregated views, for consistency, it still prevents an edit when not aggregated. See “Set a Single Value” and “Show or Hide Details” for details.
• The Full Precision Editing checkbox allows you to specify whether you edit values using full precision or with the display precision.
• The Auto-Evaluate Expression Slots on Edits checkbox allows you to specify that expression slots shown on the SCT should fully evaluate (all timesteps) any time a value on that SCT is edited. Checking this box allows the SCT to behave like a spreadsheet where expression slot calculations are performed immediately after editing a value. For example, you might have an expression slot that sums the Outflows from multiple reservoirs. This checkbox allows you to see this sum each time you edit an Outflow.
Note: This checkbox could cause refresh delays if there are many expression slots or their evaluation is not quick.
Horizontal Time Tab
To display the SCT Configuration dialog, select SCT Config, then Horz Time.
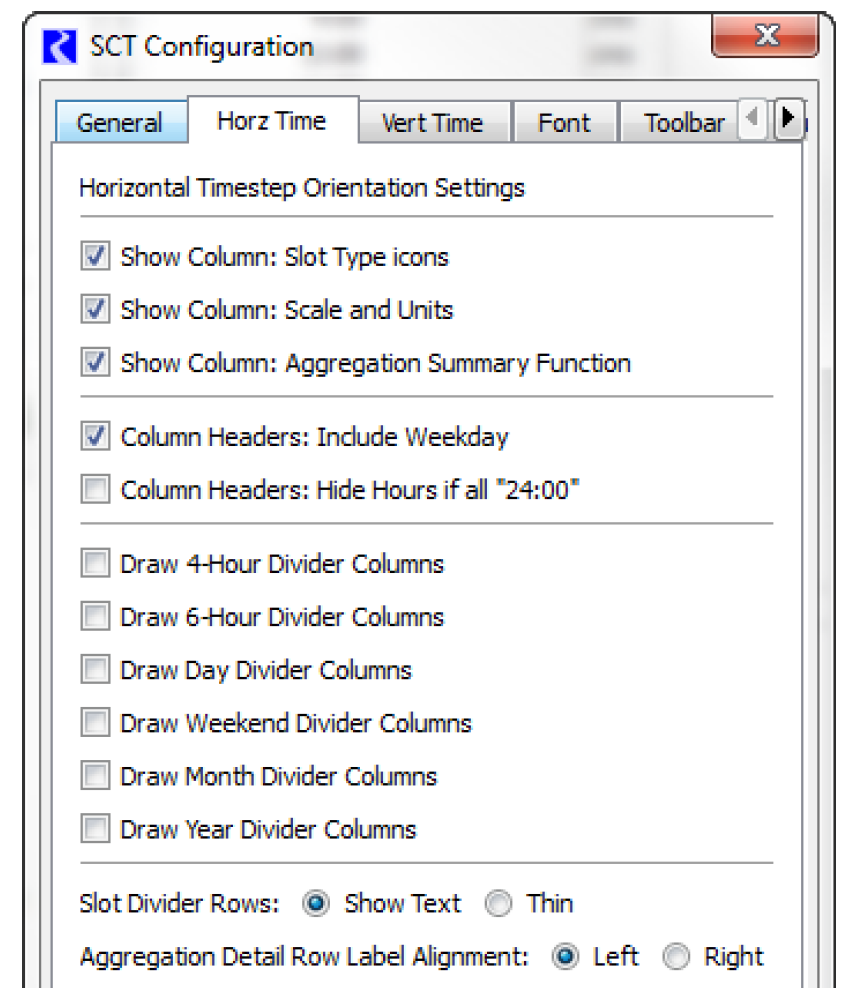
These settings affect the appearance of the horizontal timestep axis orientation views (time on top).
• In the top part of the tab, choose the columns that you wish to show. Options include showing a column for Slot Types, Scale and Units, and the Aggregation Summary function (i.e. Min, Max, Avg).
• In the column headings, do you want to see the weekdays or 24:00 for timesteps greater than 12hrs? The middle of this tab has checkboxes for these options.
• The bottom section allows you to configure automatic divider columns for standard time intervals. Each of these six types of time dividers can be independently enabled or disabled, and can be shown with independently configurable colors.
• The next setting is used to specify if you want to see text labels in divider rows. If so, you can add custom text to the divider row labels. If not, the divider rows are shrunk to conserve height.
• The final setting allows you to specify the alignment of the aggregation detail row labels. See the following topics for explanations of these settings:
Vertical Time Tab
To display the SCT Configuration dialog, select SCT Config, then Vert Time.
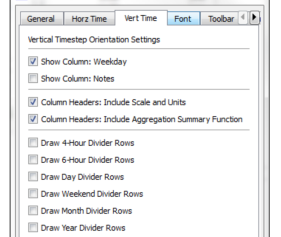
These settings affect the appearance of only the vertical timestep axis orientation views (time down the side).
• On this tab, you can specify whether to see a column containing the Weekday (i.e. Sunday, Monday, etc) and/or a column containing Notes. See “Notes on Series” for details on Showing Notes on the SCT.
• You can also specify if you want to include scale and units and the aggregation function in the column heading.
• The bottom section allows you to configure automatic divider rows for standard time intervals. Each of these six types of time dividers can be independently enabled or disabled, and can be shown with independently configurable colors. See the following topics for explanations of these settings:
User-configurable Fonts
To display the SCT Configuration dialog, select SCT Config, then Font.
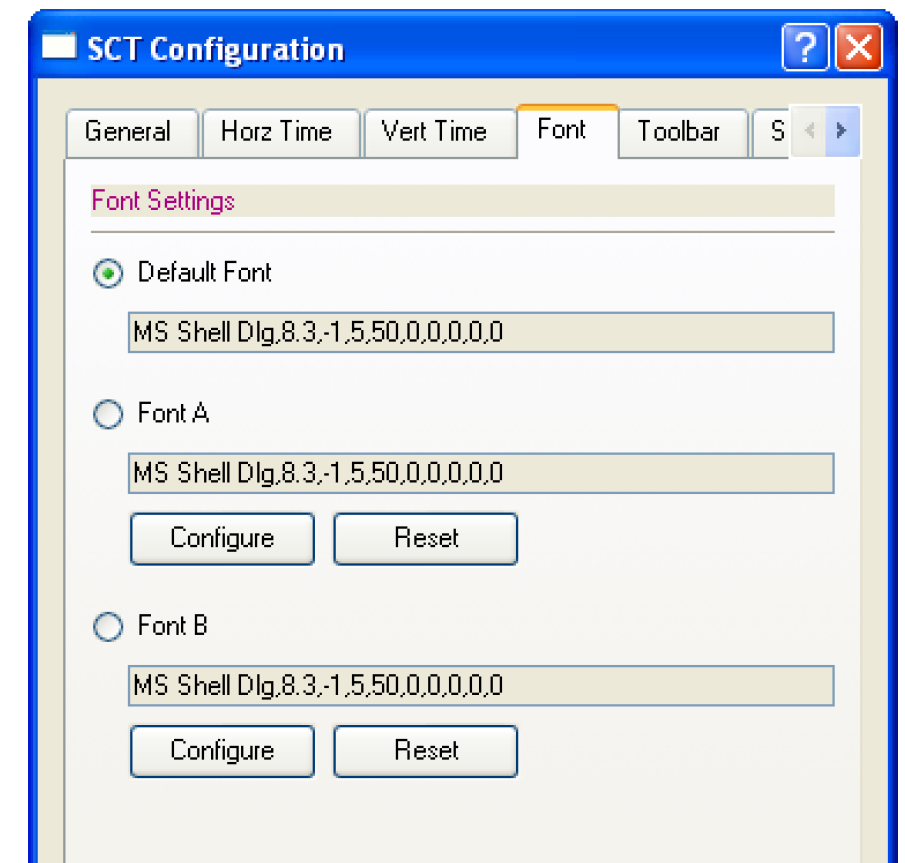
In this tab, you can choose the SCT font. Only one font can be displayed at any given time, and that font is used for both screen display and printing.
– Two custom font specifications can be saved with each SCT, and with the default SCT configuration. You can choose to use either of those two custom font specification, or the default font.
– Select either of the Configure buttons to change the corresponding custom font specification. This brings up a font selector which allows you to select a different font face (font family), font size, font weight (e.g. normal or bold), and other font properties.
– Select either of the Reset buttons associated with either the Font A or Font B item to restore that font specification to the default font.Applying a font specification to the SCT (with either the OK or Apply button) may take a moment to complete since the SCT geometry needs to be readjusted.
Toolbar Tab
To display the SCT Configuration dialog select SCT Config, then Toolbar.
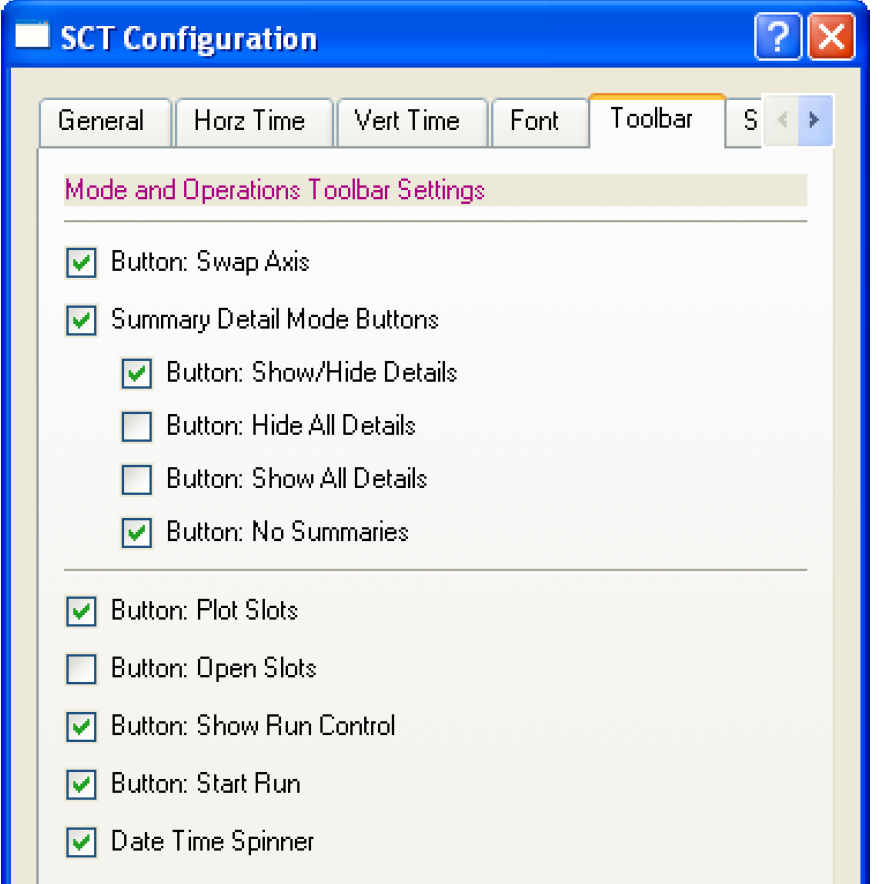
These settings control which toolbar buttons are displayed in the SCT Toolbar. See “SCT Overview” for details.
The operations associated with each of the configurable toolbar buttons are also represented in the SCT menus.
Note: The flag setting buttons are configured through the Flags tab rather than through the Toolbar tab. See “Flags Tab” for details.
Summary Tab
To display the SCT Configuration dialog, select SCT Config, then Summary.
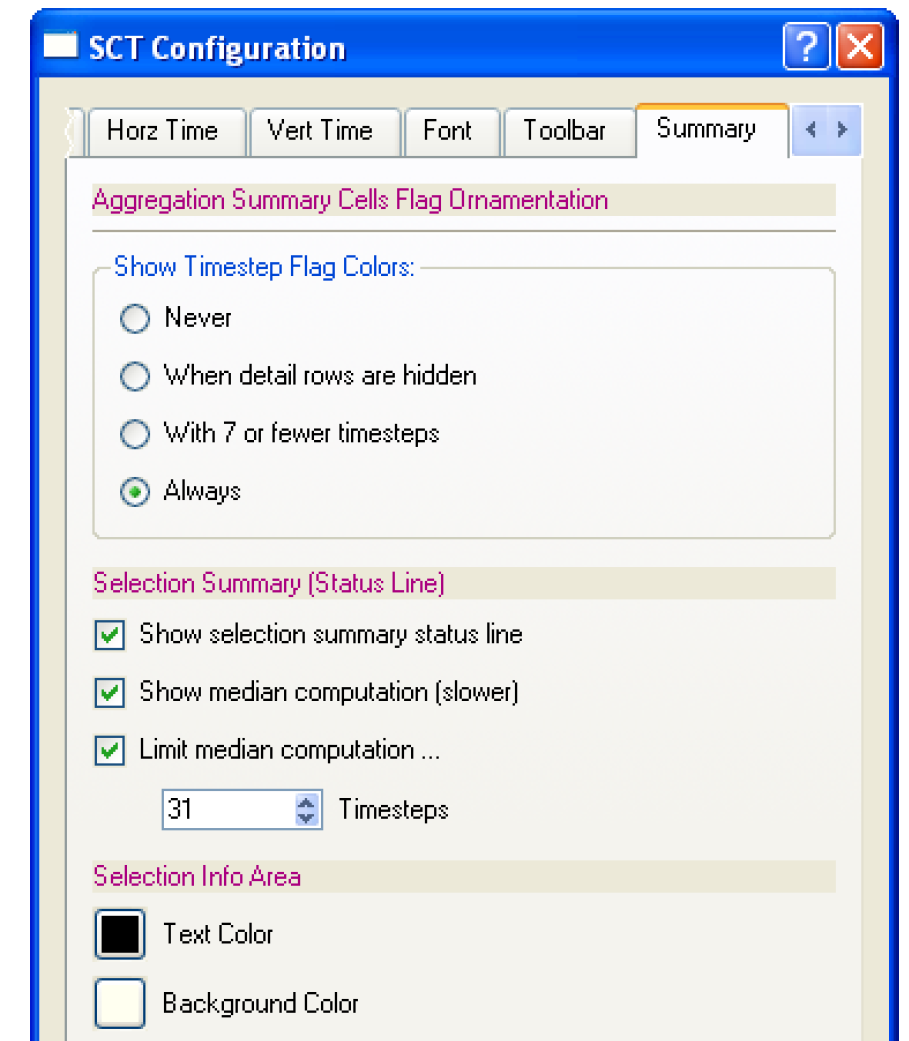
The settings on this tab allow you to change the colors shown when timesteps are aggregated. See “Change Ornamentations” for details on the Show Timestep Flag Colors options.
• The Selection Summary (Status Line) options disable or limit the second status line displayed at the bottom of the SCT. The three components are used for limiting the median computation, which is the only statistic that requires a set of values to be sorted.
• You can configure the colors for the background and the text displayed in the area at the bottom of the SCT. Pressing either of these buttons brings up a Color Chooser:
Flags Tab
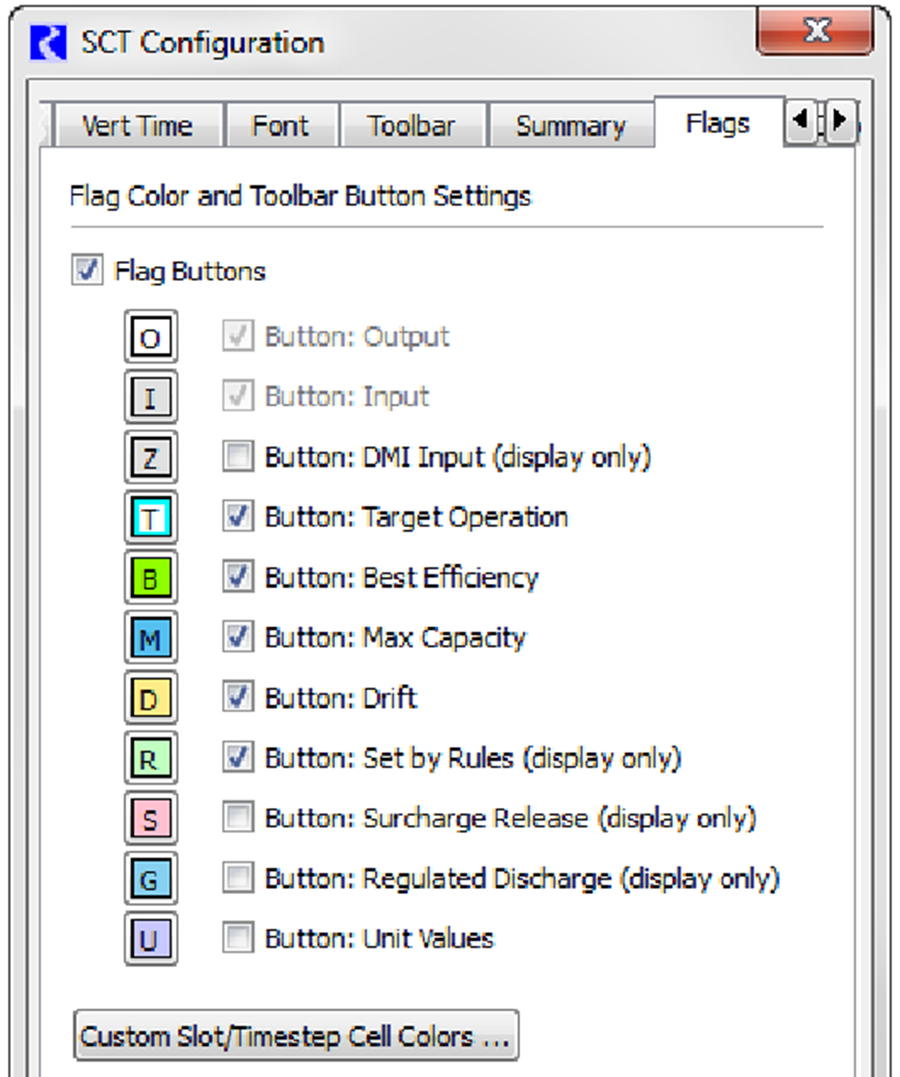
The Flags tab is used for three types of settings related to the support of slot timestep flags in the SCT.
• The checkbox controls are used to determine the presence of the flag toolbar buttons in the SCT Toolbar (see “SCT Overview” for details). If the Flag Buttons checkbox is selected, the Input and Output flag toolbar buttons are displayed unconditionally. The other flags can be enabled or disabled as desired.
• The colored buttons on the Flags tab illustrate the appearance of the flag toolbar buttons. Selecting the colored buttons brings up a color chooser, allowing you to select a different color for that flag. See “Flags Tab” for details.
• Custom foreground (text) color and background colors can be configured by selecting the Custom Slot/Timestep Cell Colors button. This is described in the next section.
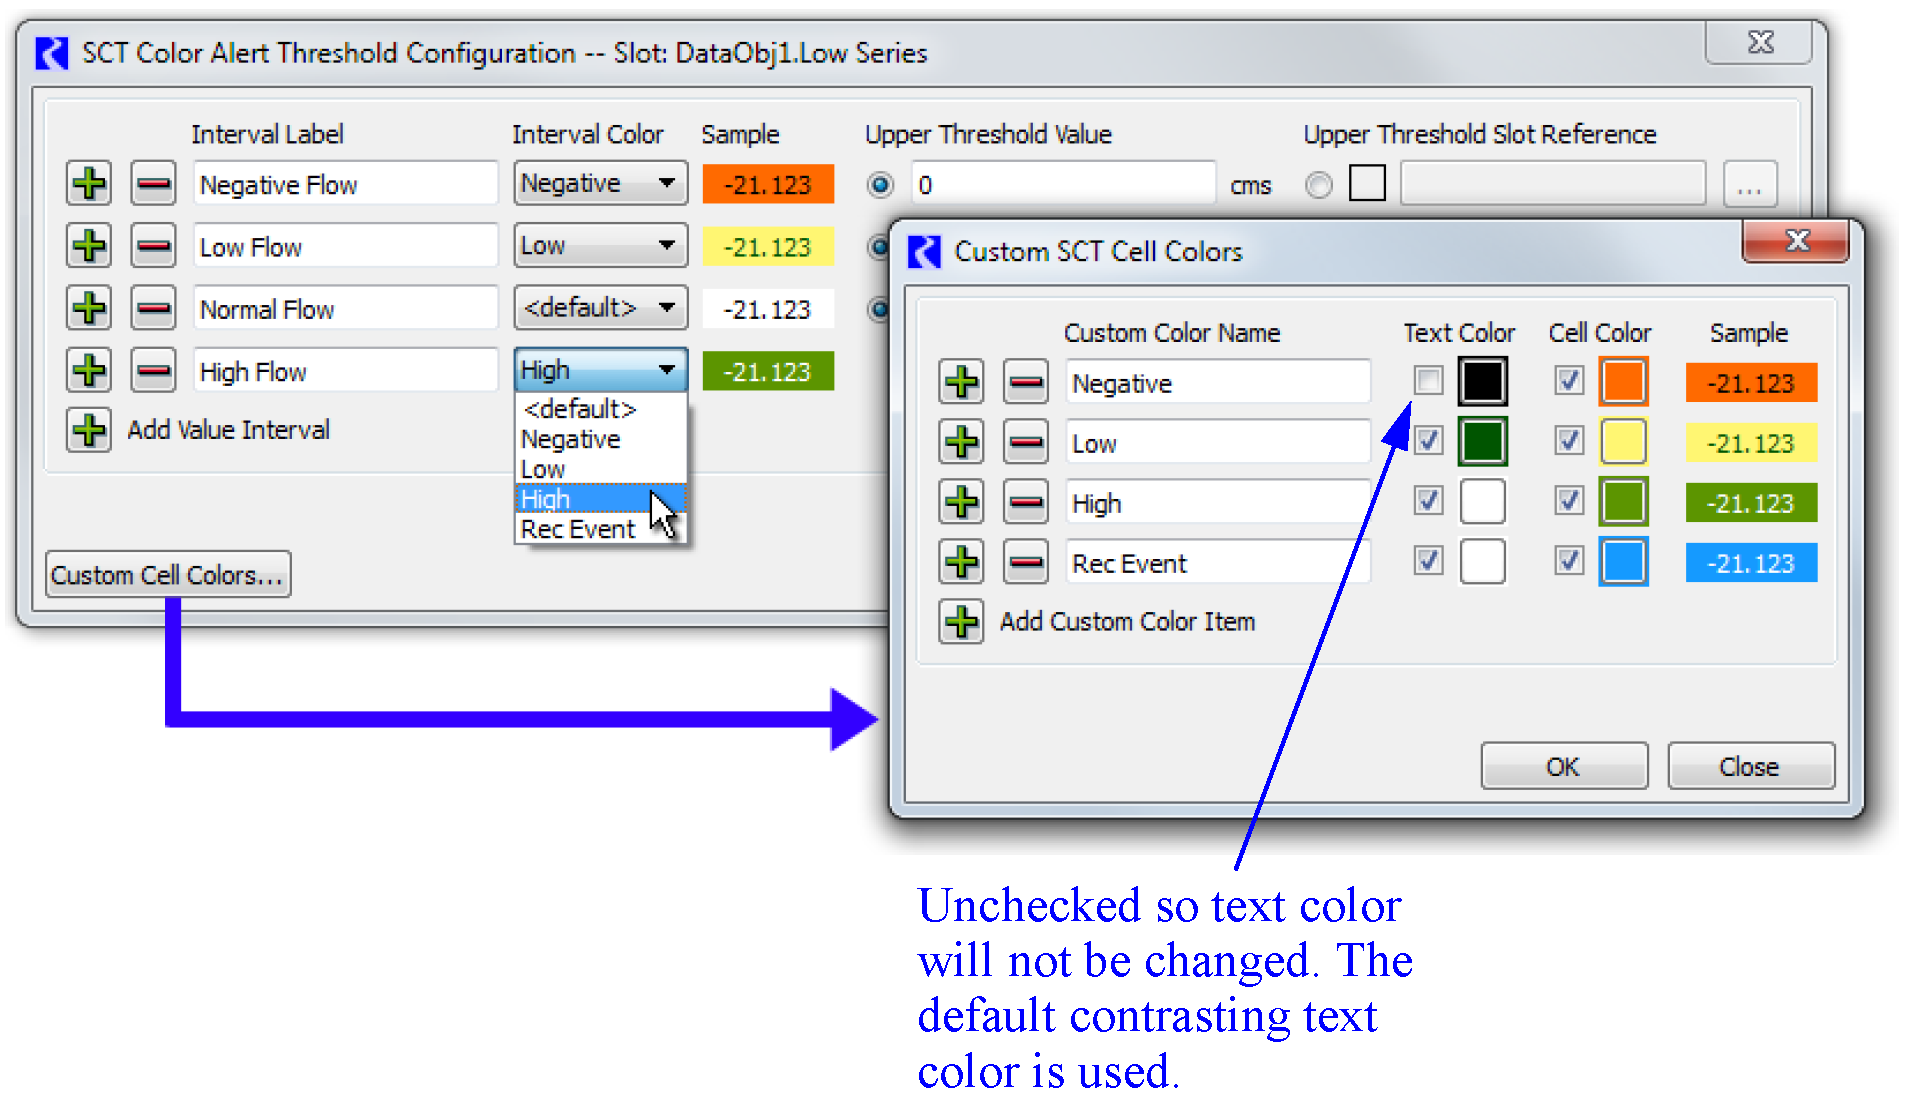
Custom Cell Colors
Use the following steps to edit the definition of custom colors.
1. Select the Custom Slot/Timestep Cell Colors button on the Flags tab.
Each row represents a named custom cell color including the name, Text Color, Cell Color and a sample.
2. Select the green Plus button to insert/append a row of controls for a new custom color item. Select a red Minus button to remove the row/color.
3. Specify the name of a custom color item directly in the Custom Color Name field. The name must be non-blank and unique.
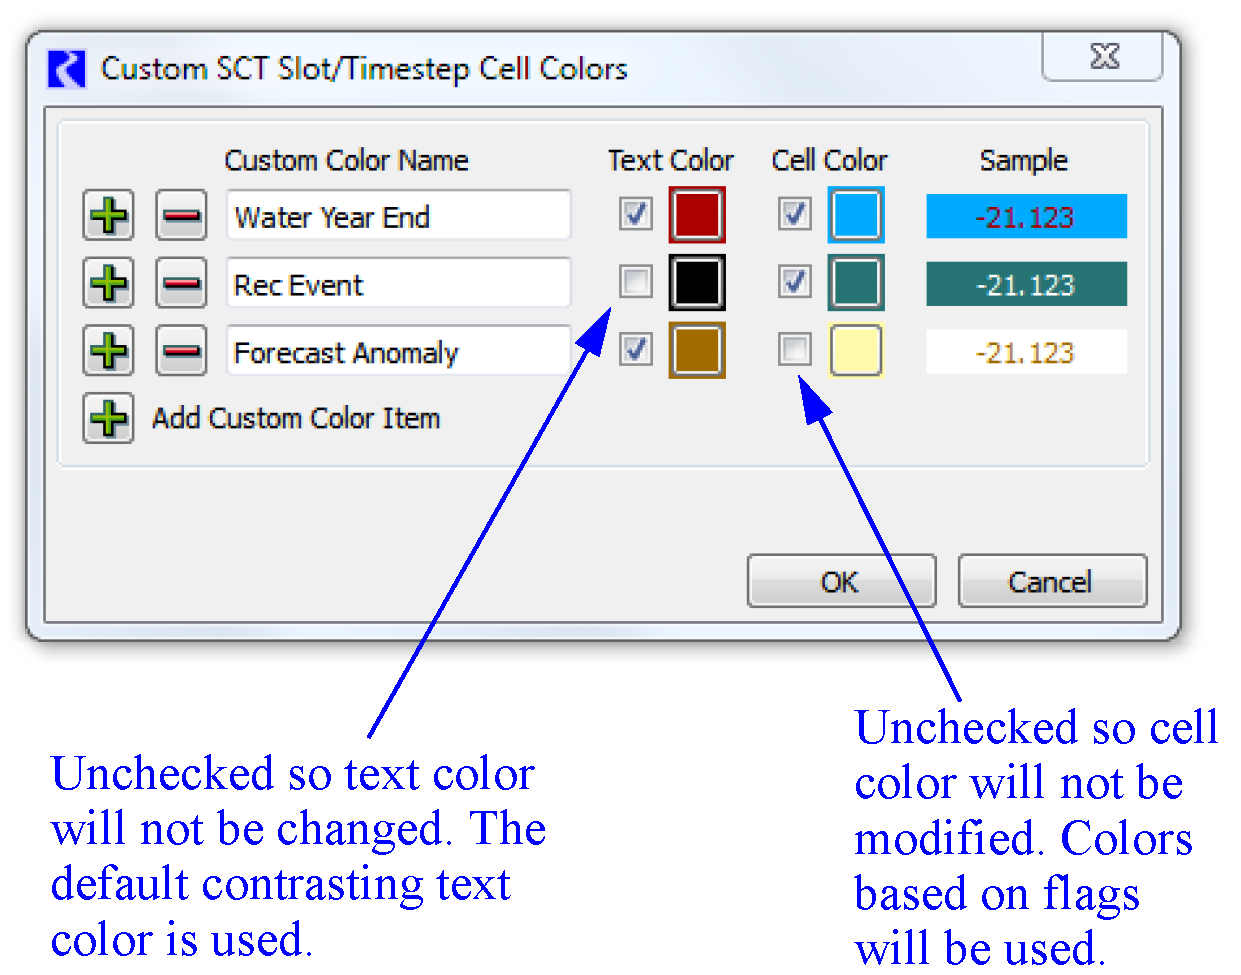
4. Use the checkboxes to specify whether the Text color or Cell Color will change.
Note: One or both must be selected. If cleared, the color will remain the default color.
5. Select the color buttons and specify the desired color. The Sample field shows the result.
6. Select OK to confirm the changes.
7. To have these definitions applied to the SCT, you must then select the OK or Apply buttons in the SCT Configuration dialog.
See “Apply Custom Colors to Slot/Timestep Cells” for details on applying the custom colors to specific cells in the SCT. See “Configure Color Alerts” for details on using the custom colors for Alerts (i.e. conditional formatting).
Color Tab
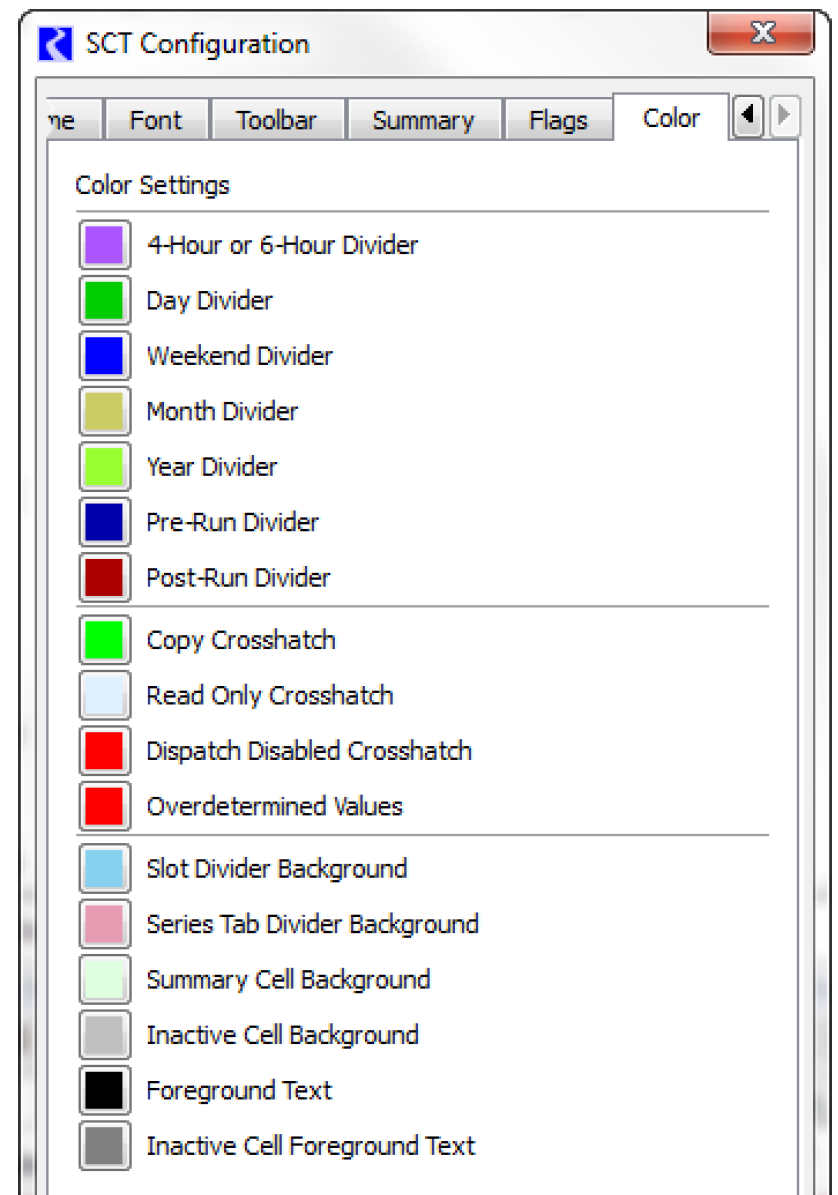
The Color settings tab lets you configure colors, other than flag colors that are set on the Flags tab (see “Flags Tab” for details).
For an explanation of these settings, see the following topics:
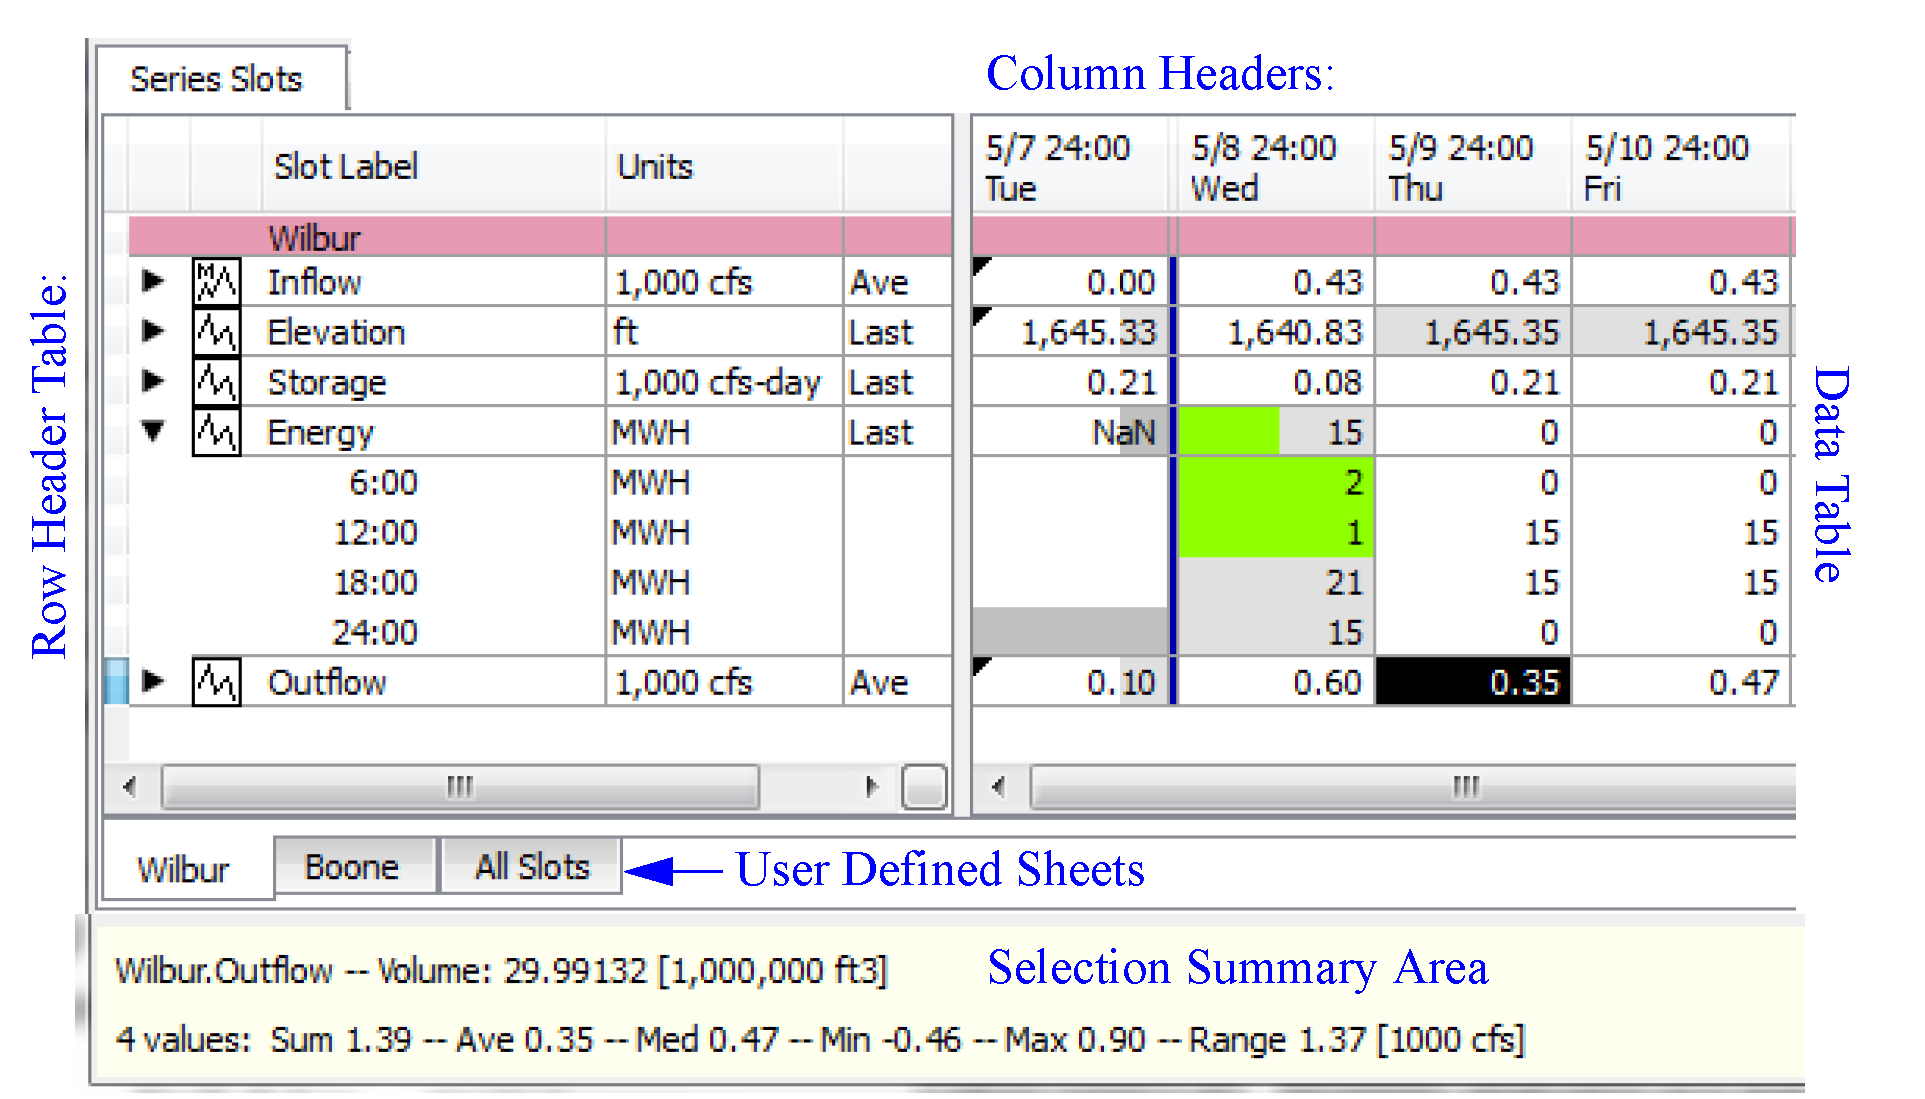
Series Slots Tab
Series data is represented in a spreadsheet view on the Series Slots tab of the SCT. This table supports swapable axis (slots vs. timesteps) and optional timestep aggregation. The following screenshot shows the areas of the Series Slots tab. Row Headers and Column Headers provide the slot label, units, aggregation information, and timestep information. Columns and rows are swapable so this information is displayed differently depending on the orientation.
Further, you can organize your series slots into user configurable sheets where there is a tab at the bottom of the SCT. When there are multiple sheets, there will always be an All Slots tab that shows all of the slots on one tab. You can tear off or show any sheet as a new SCT. See“Create a new SCT from a Series Sheet tab” for details.
At the bottom of the SCT is the Selection Info Area also called the Summary area. This displays information on the selected cells in the SCT including the name or number of slots and then statistics on the selection. Statistics include Sum, Average, Median, Min, Max, Range, and Difference. All, some or none of these may be shown depending on the number of cells selected and the units of those cells. Figure 8.3 shows the areas of the Series Slots tab of the SCT.
Figure 8.3
Slots and Slot Dividers
Either rows or columns (depending on the current axis orientation) correspond to slots and slot dividers. See “Axis Orientation” for details.
Slots
RiverWare slots are identified with a fully qualified name (including the name of the simulation object, account, or other entity the slot is on). SCT slots for which a match cannot be found on the workspace are indicated as disabled—no data is shown, and you cannot provide data for such slots. See “Slot Names and Slot Labels” for details.
Properties associated with slot items (within the SCT configuration) include the following:
• Single-line Slot Text Label (used when slots are shown as rows).
• Multiple-line Slot Text Label (used when slots are shown as columns).
• Slot Column Width (in pixels) (used when slots are shown as columns).
• Summary Function for computing the value shown for aggregates of timesteps within the particular slot. See “Summary Functions” for details.
Dividers
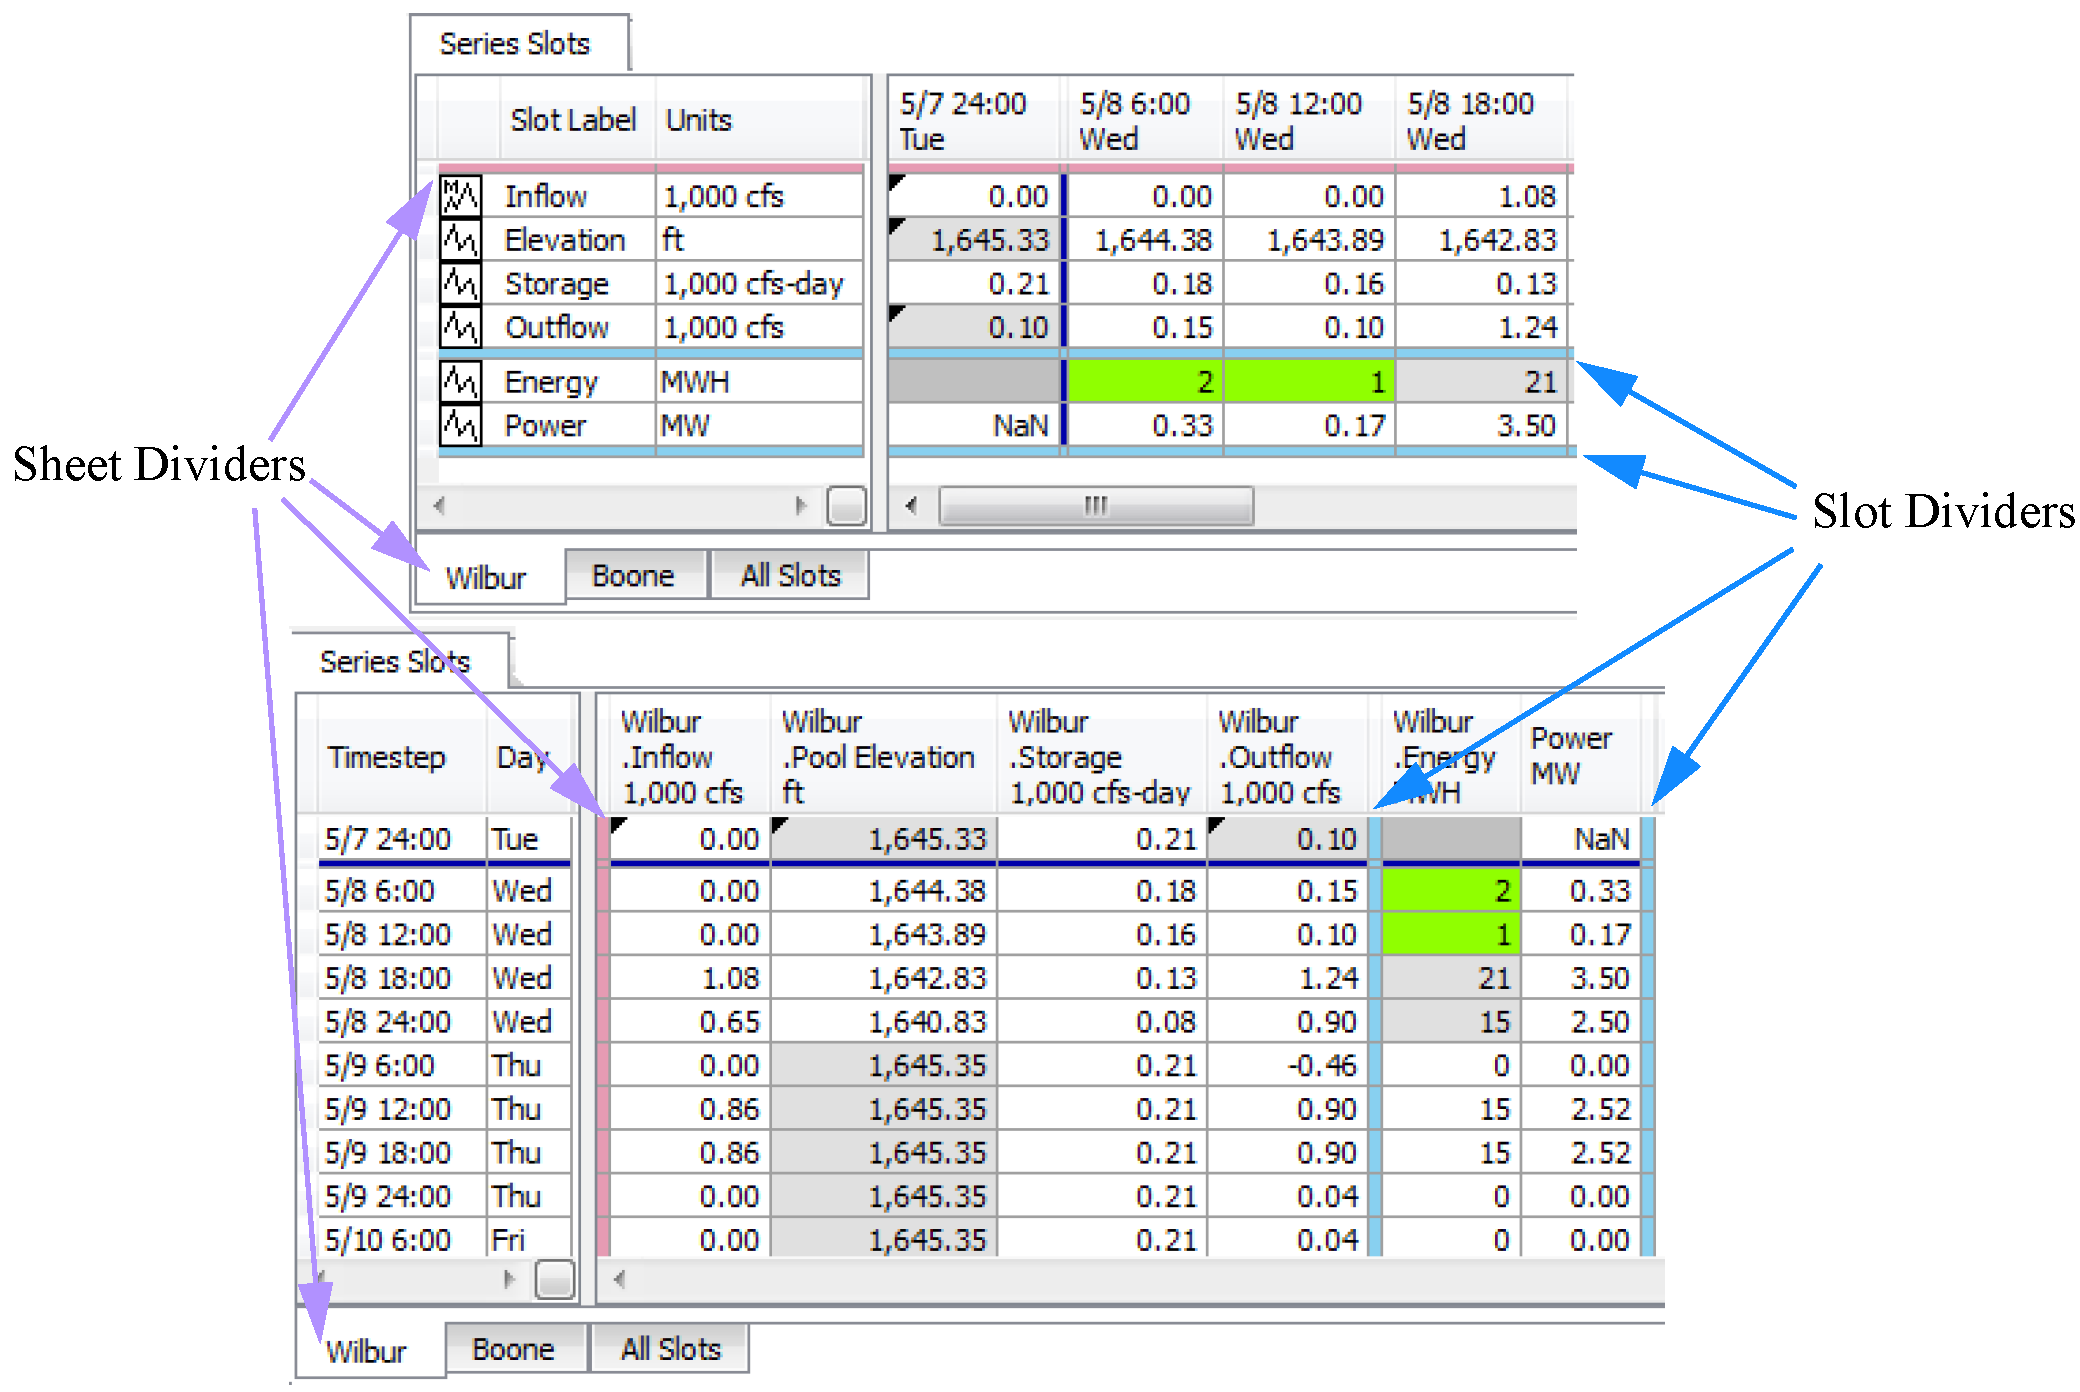
There are two kinds of dividers you can add to organize your SCT, as follows:
• Slot dividers. Rows or columns (depending on the current axis orientation) that you can place between slot rows or columns. You can choose one particular background fill color for all slot dividers. When slot dividers display as rows, they are tall enough for a line of text. In this orientation, you can enter text in the Slot Label field of the slot divider (row). When the SCT is unlocked, you can edit slot divider row text by double-selecting that field. When slot dividers display as columns, they are drawn as thick lines. In this orientation, you cannot place text within the slot divider (columns). See “Axis Orientation” for details.
• Sheet Dividers. Delineate on which sheet a series slot it shown. You can choose one particular background fill color for all sheet dividers. The sheet dividers is shown at the top/left of each tab.
See “Change Ornamentations” for details on changing background colors.
In Figure 8.4, thin slot dividers display as blue, while sheet dividers are pink. Each graphic shows multiple tabs and two slot dividers.
Figure 8.4
See the following topics for more information:
Slot Names and Slot Labels
RiverWare uses Slot Names to refer to a particular slot. Generally, the slot name includes the simulation object or account that the slot is on. You cannot change a slot’s name within the SCT. (Simulation slots cannot be renamed; custom slots can be renamed from the open object dialog.) See “Ornamentation of Hidden Pre- and Post-Run Timesteps” for details.
Slot Labels are text strings that you can use to label a slot within a particular SCT. Two slot labels text strings are associated with a slot item, as follows:
• A single-line text string for use when slots are shown as rows
• A (potentially) multiple-line text string for use when slots are shown as columns
In the horizontal timestep axis orientation (where slots are rows), if the SCT is unlocked, you can edit a slot label in-line. In either orientation, you can edit a slot label by selecting the slot (e.g., select a data cell within the slot) and then selecting Slots, then Set Label / Function; see “Slots Menu”.
Note: The SCT must be unlocked.
You can set the label for multiple slots to standard values; see “Edit Multiple Slot Labels” for details.
Slot Labels are always visible within the SCT as either row or column headers. If the current SCT selection includes only a single slot, the name for a slot displays in the Selection Info area (at the bottom of the SCT).
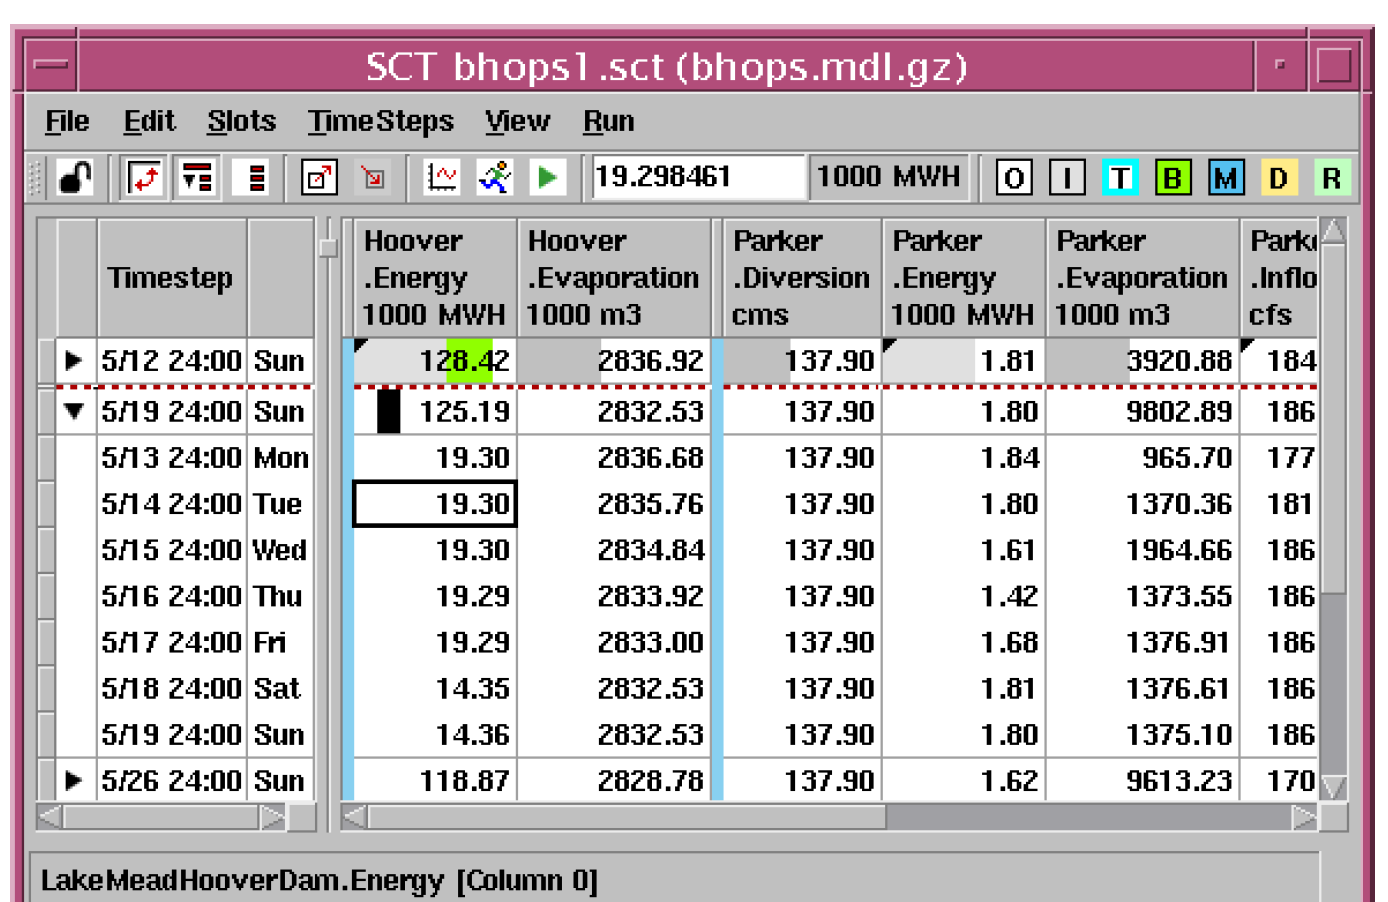
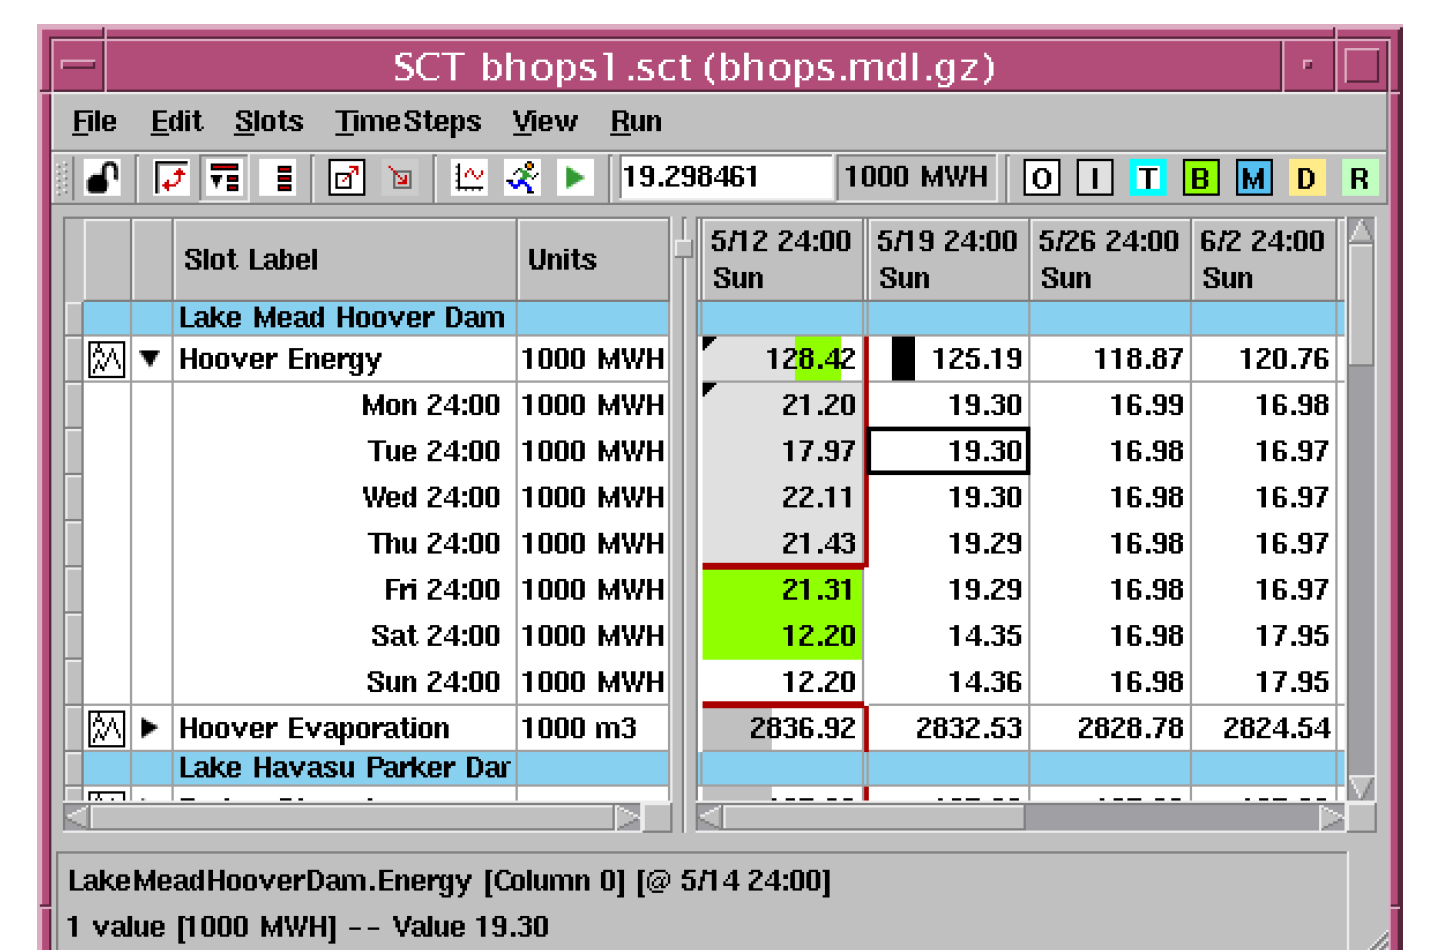
In the following examples, one slot is selected (by virtue of one of its timesteps being selected). See “Vertical Timestep Axis Orientation” for details.
1. Its Slot Label is Hoover Energy.
2. Its Slot Name is LakeMeadHooverDam.Energy (see bottom of SCT).
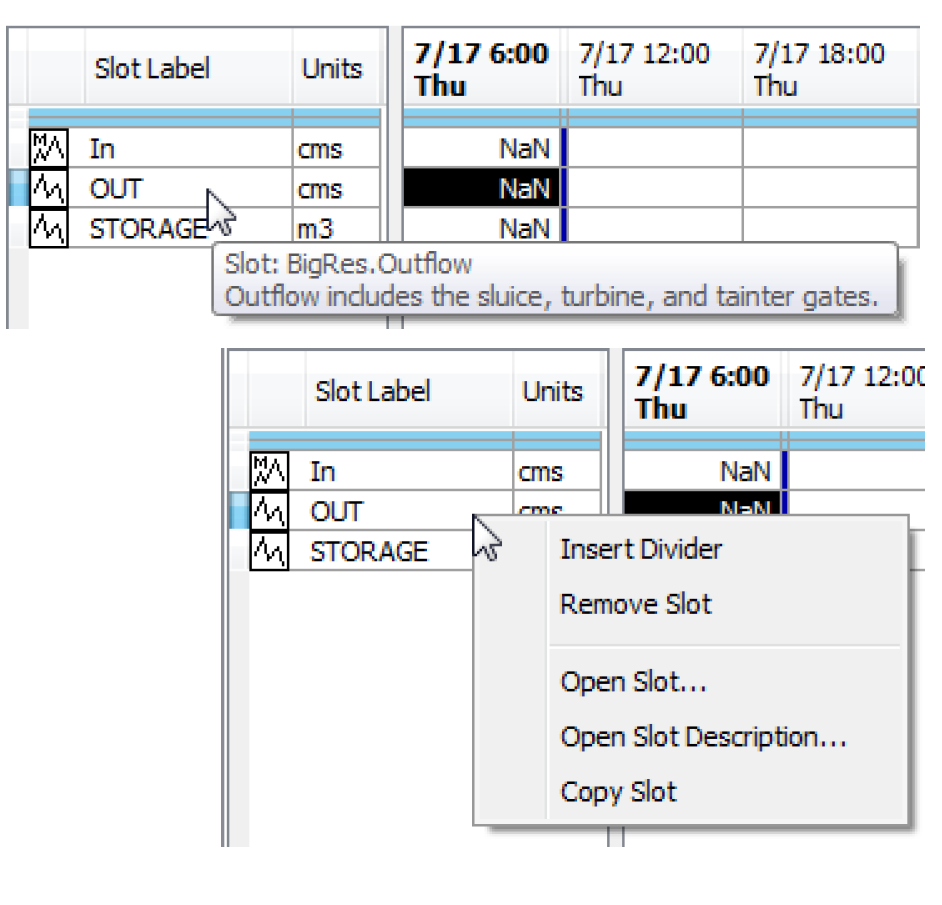
Note: Hover over a slot name or label to see a tooltip with the full slot name and any description defined on that slot. Use the right-click menu to choose Open Slot or Open Slot Description to see that slot’s dialog without or with the description panel shown, respectively.
Numeric Values
Although numeric slot (time series) values are stored internally as double-precision floating point numbers, values are presented in the SCT (and elsewhere in the RiverWare interface) with a display precision. Display precision is a non-negative integer that specifies the number of fractional decimal digits (to which the internal value is rounded). The SCT uses a slot’s display precision for all data cells.
The values displayed in a slot are in the units displayed elsewhere for the slot as defined by the Unit Scheme. The SCT does not provide the ability to change display units of slots.
If you select a single value, it is redundantly displayed with model precision in the Toolbar Value Edit field, where it can also be edited. Model precision is not necessarily the full precision of the internal value.
Slot values can be in an undefined state. Depending on an SCT Configuration, undefined values can be displayed as NaN (which stands for Not a Number) or as blanks. See “General Tab” for details.
Note: Show Commas in Numbers setting. In the SCT, commas are shown by default as a thousands separator. This is a global setting that is specified from the Workspace, then Show Commas in Numbers menu on the workspace. See “Show Commas in Numbers” for details.
The SCT also shows tooltips indicating which rule or DMI was responsible for the value, where applicable. See “Series Slots” for details.
Alt Units Toggle
The SCT always provides an alternative units (Alt Units) toggle button on the toolbar as shown in Figure 8.5. The button provides the following display options:
• Standard - Display flows and volumes without conversion
• Flow - Display flow slots as flows and display volumes as flows (as appropriate)
• Volume - Display flow slots as Volumes and display volume slots as volumes.
All flow series slots on the SCT can be displayed as volume over the timestep using the default unit scheme definition for volume. Certain volume slots can be shown as flows. See “Alt Units button” for more information.
Figure 8.5 SCT toolbar with Alt Units button highlighted
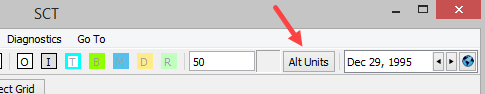
Note: Slots shown in their alternate units are shown with an asterisk next to their unit, if shown.
Custom Cell Colors
You can define and apply custom cell colors for series slots. Use one of the following approaches:
• Specify the named color for particular slot/timestep values.
• Specify intervals and colors for the entire slot such that the colors change based on the values. These Alerts will display on the SCT cells when values warrant.
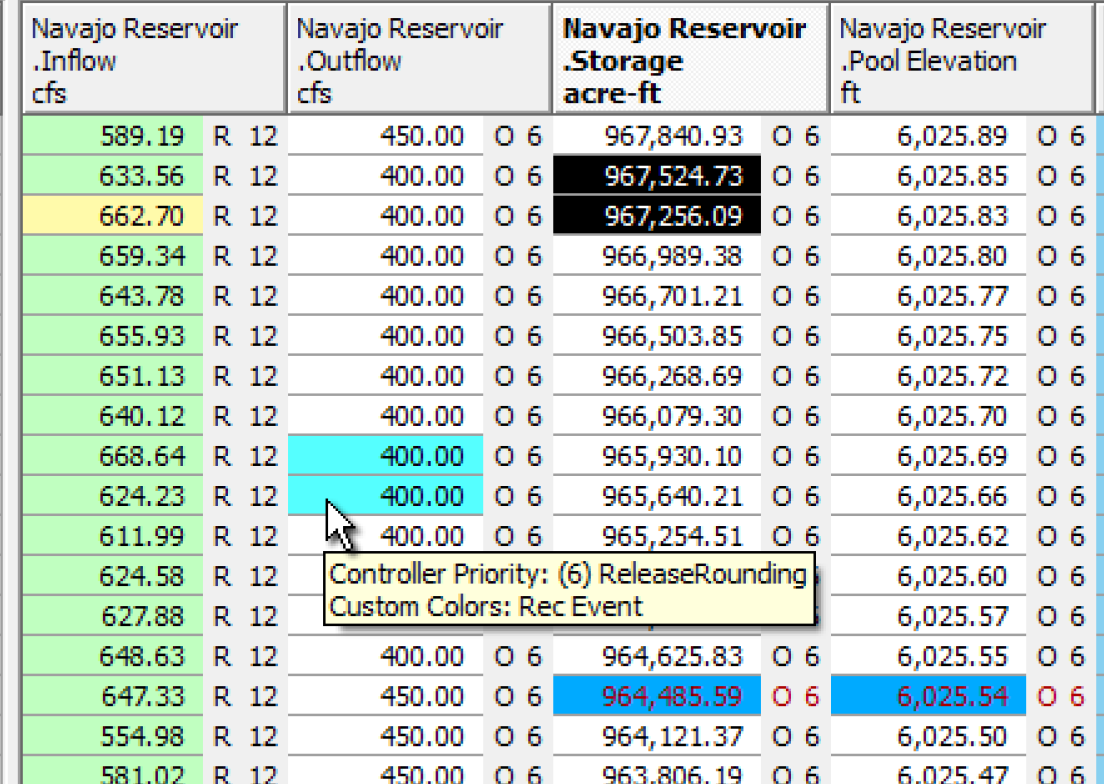
When applied, the configured text and background colors are shown on the SCT instead of the standard flag colors. Tooltips provide the flag information and the custom color label or interval name, as shown in Figure 8.6.
• Configure the set of named color items in the Flags tab of the SCT configuration; see “Custom Cell Colors” for details.
• Apply the named colors using the right-click Apply Custom Colors; see “Apply Custom Colors to Slot/Timestep Cells” for details.
• Configure intervals for a particular slot and choose the colors to show for each interval; see “Configure Color Alerts” for details.
Figure 8.6
Notes on Series
The SCT supports timestep annotations on the Series Slots tab. Operations on Notes are performed with the right-click context menu, with the same operations as those available in the Open Slot dialog. See “Notes on Series Slots” for details.
If a single SCT cell is selected, the note text associated with that cell are displayed in the SCT selection status bar, at the bottom of the SCT. As with the series data shown in an SCT, the notes are associated with the SeriesSlots shown in the SCT, and not with the SCT itself.
Figure 8.7
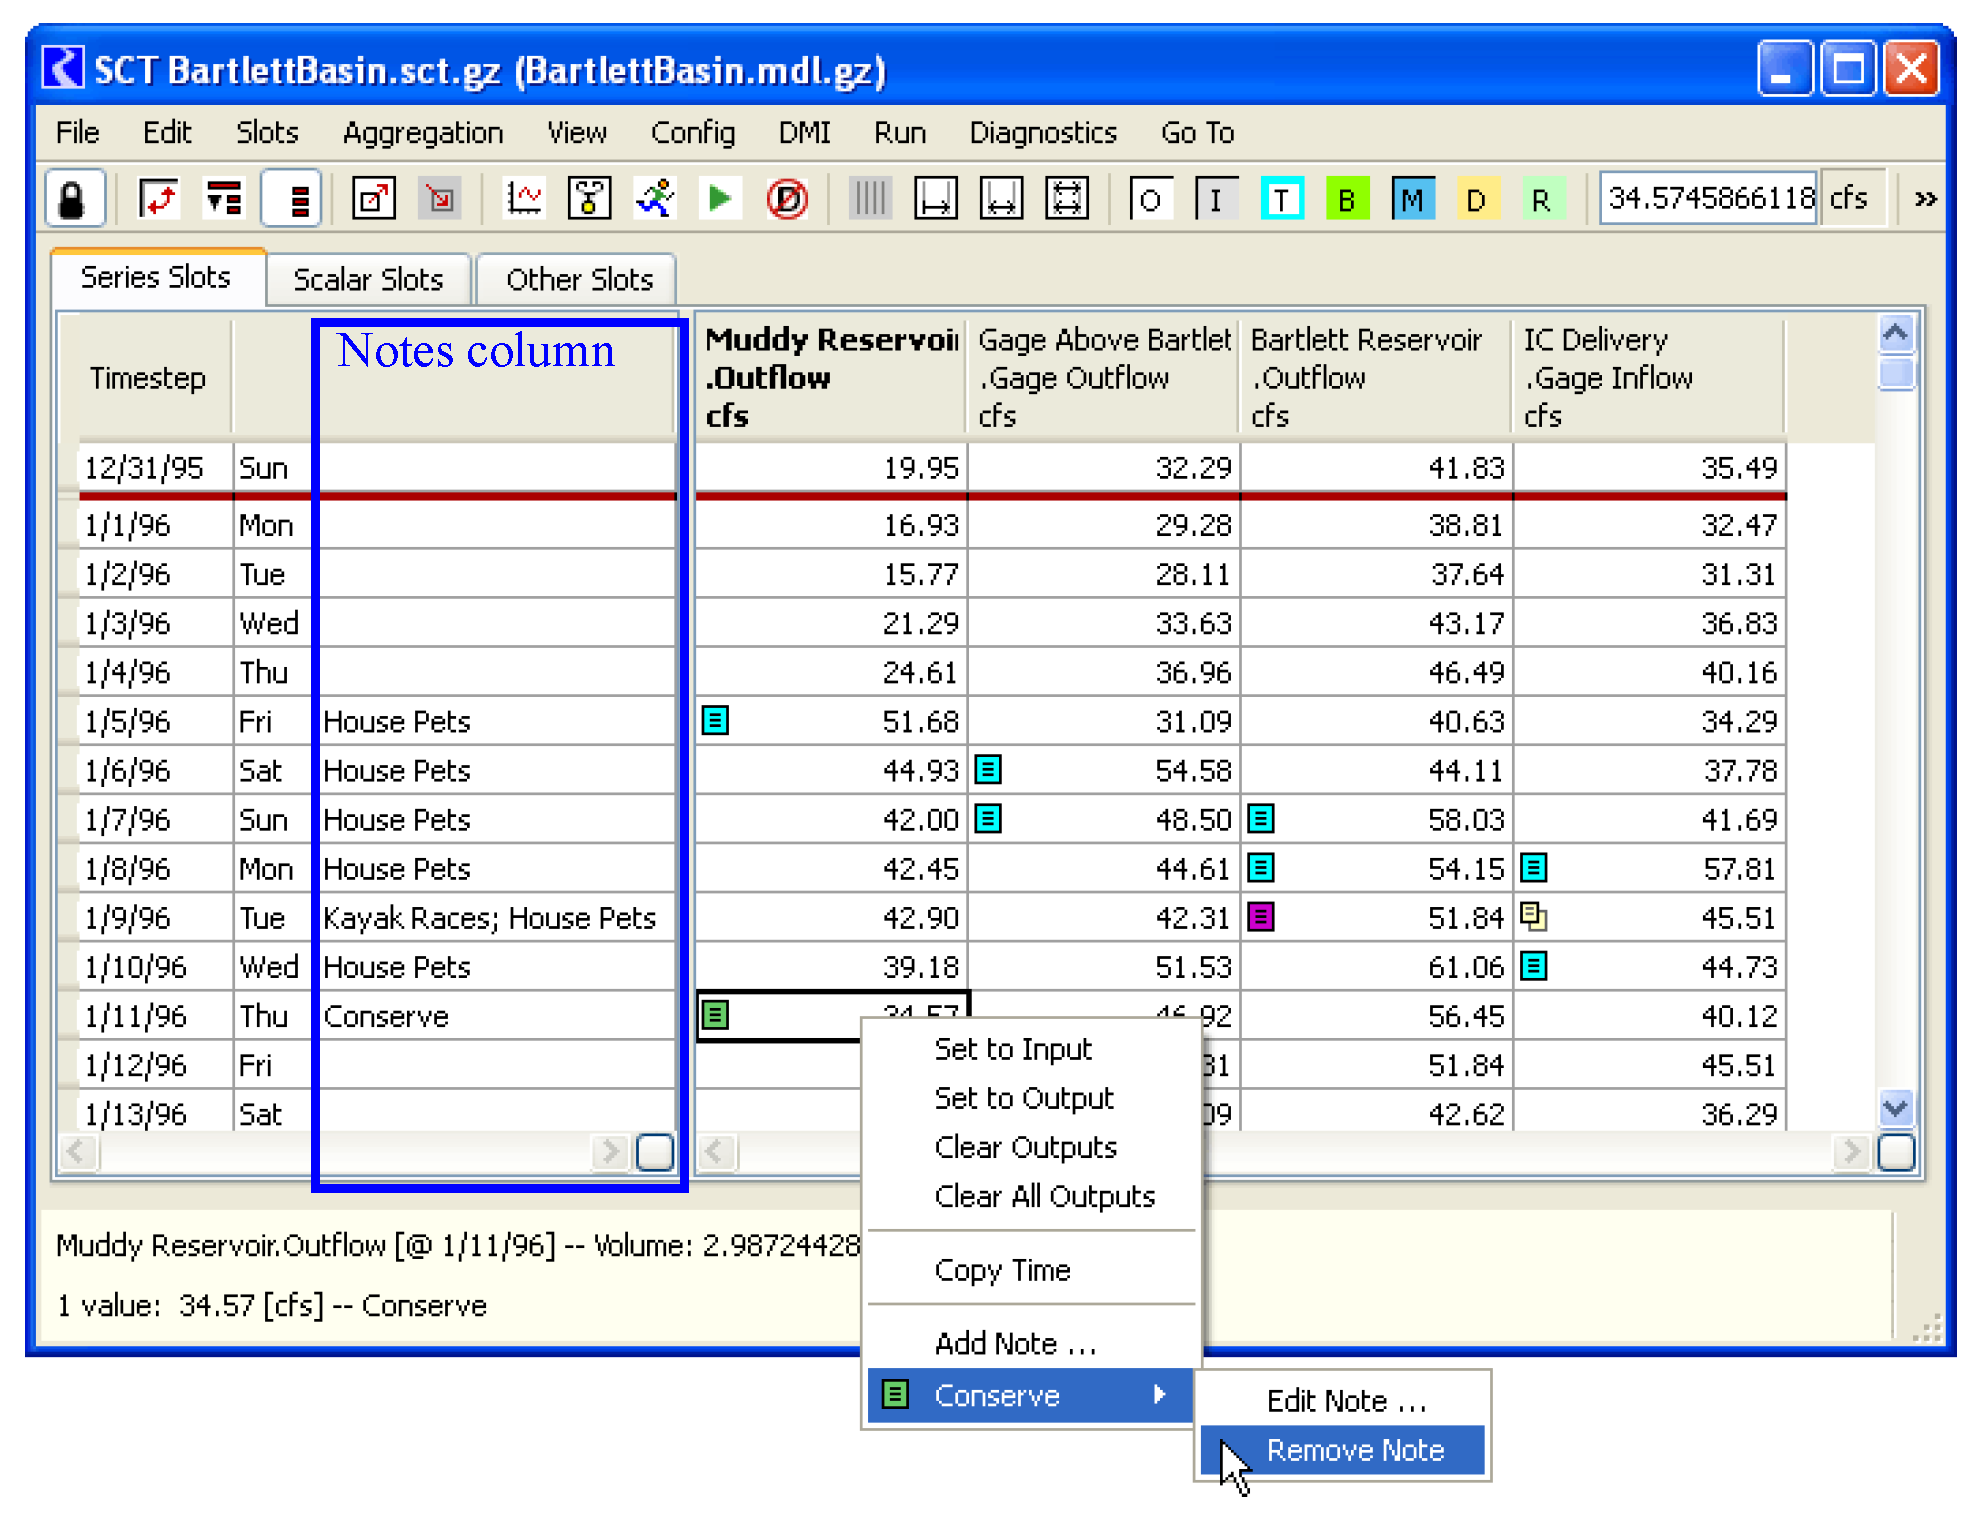
When the SCT is in the Non-Aggregated Vertical Timestep view (see Figure 8.7), the text for all of the notes in each timestep row can be shown in a row header column, depending on the setting on the Vert Time tab of the SCT configuration; see “Vertical Time Tab” for details.
Timesteps
An SCT can be configured to show a timestep interval matching the RiverWare model’s Run Control or any other timestep supported in RiverWare. This feature is configured using a SCT Timestep Size Override property which is configured on the General tab of the SCT configuration dialog. See “Run Menu” for details.
Note: An SCT can only show one timestep size for all series slot sheet tabs. But you can have multiple SCTs open showing different timestep sizes.
In addition, the timestep range of slots in an SCT do not have to match Run Control; SCT cells corresponding to a timestep on a slot that is out of that slot’s defined range display merely as blank.
Conversely, the displayed timestep range of the SCT—the model’s current run control timestep range plus the indicated number of pre-simulation and post-simulation timesteps—may not cover the complete timestep range of slots displayed in the SCT. When this occurs, a special ornamentation (an upper-left or lower-right corner triangle) on the slot’s first and/or last cells indicate the presence of obscured (hidden) timestep values for that slot. See “Ornamentation of Hidden Pre- and Post-Run Timesteps” for details.
Timestep Aggregation
For display (and certain data export) purposes only, groups of timesteps within each Slot can be aggregated and summarized as single numeric values within an SCT. Aggregation is done by choosing an aggregation interval size larger than the timestep interval size—for example, aggregate 1 Hour timestep data up to a 1 Day timestep. It is also possible to select a constant number of timesteps for aggregation. See “Timesteps” for details.
When in an Aggregated View, each slot displays only the summary cells.
To configure the aggregation, access the SCT Timestep Aggregation Configuration dialog by selecting Aggregation, then Timestep Aggregation Config. See “Aggregation Menu” for details.
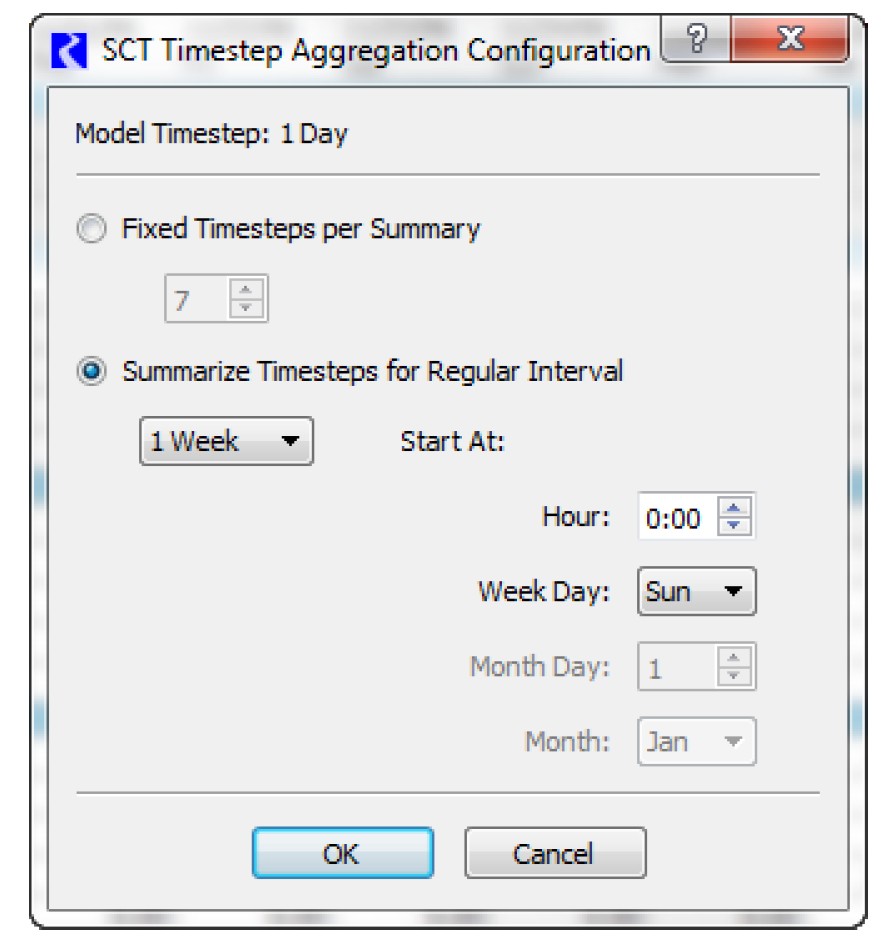
Within the dialog choose one of the following:
• Fixed Timesteps Per Summary. A specified constant number of timesteps is used for each aggregation. Aggregations start with the first timestep displayed in the SCT.
• Summarize Timesteps for Regular Interval. A specified interval of time with a start offset is used. You select the aggregation interval size—which must be larger than the timestep —and Start At (offset) settings. The accompanying graphic shows a weekly aggregation starting on Sunday at 0:00. This indicates it will summarize the following 7 days (1 Day timestep model) Monday to Sunday.
With interval aggregation, the number of timesteps per aggregation can vary for the following reasons:
• Monthly aggregations will have various numbers of timesteps. Other irregular relationships between aggregation and timestep intervals are also possible.
• The first aggregation will have fewer timesteps if the first timestep displayed in the SCT isn’t at the beginning of a regular interval aggregation (with respect to the selected offset).
• The last aggregation will have fewer timesteps if the last timestep displayed in the SCT does not fall at the end of a regular interval aggregation (with respect to the selected offset).
The SCT supports both non-aggregated and aggregated views. In non-aggregated views, every data cell displays the value of exactly one timestep. Aggregated views have both detail and summary cells. These are described in the next section.
Detail Cells and (Aggregation) Summary Cells
Aggregated SCT views display the following types of data cells (see “Timestep Aggregation” for details).
• Detail cells display the value of exactly one timestep (of one slot), as do all cells in non-aggregated views.
• Summary cells display the aggregated values. These are the result of a particular Summary Function on the timesteps that make up the aggregation. See “Summary Functions” for details.
In both axis orientations, summary cells and detail cells have the same relative arrangement. An aggregation’s detail cells (showing each of the individual timesteps within the aggregation) are laid out immediately below the aggregation’s single summary cell. Also, the two types of cells are laid out in rows—i.e., Summary Rows and Detail Rows—though the correspondence of those rows to the same slots versus the same timesteps differs in the two axis orientations. See “Axis Orientation” for details.
In the aggregated views, summaries are always displayed while detail cells can be displayed or hidden. The non-aggregated views display only details without summaries.
Summary Functions
You can select a Summary Function for slots in the model based on the unit type, slot name or individually for each slot in an SCT. The function is applied to the set of timesteps within each timestep aggregation and displayed in a Summary cell. See “Timestep Aggregation” and “Detail Cells and (Aggregation) Summary Cells” for details.
The following Summary Functions are supported:
• 1st
• Last
• Sum
• Ave. Mean
• Med. Median, Since Median requires a sorting of values, this can slow down the speed of SCT refreshes. If there is an even number of non-NaN values, the Median is defined as the mean of the middle two values.
• Min. Minimum
• Max. Maximum
• Nth (particular n—e.g., 5th)
For the arithmetic functions, undefined values (NaNs) are ignored.
How To:
Custom Aggregation Rows
For time-aggregated, vertical timestep view (where slots are columns), you can specify one or more custom Summary Rows at the end of each time aggregation.Figure 8.8 shows eight custom rows (including dividers as the first and last custom summary rows).
Figure 8.8
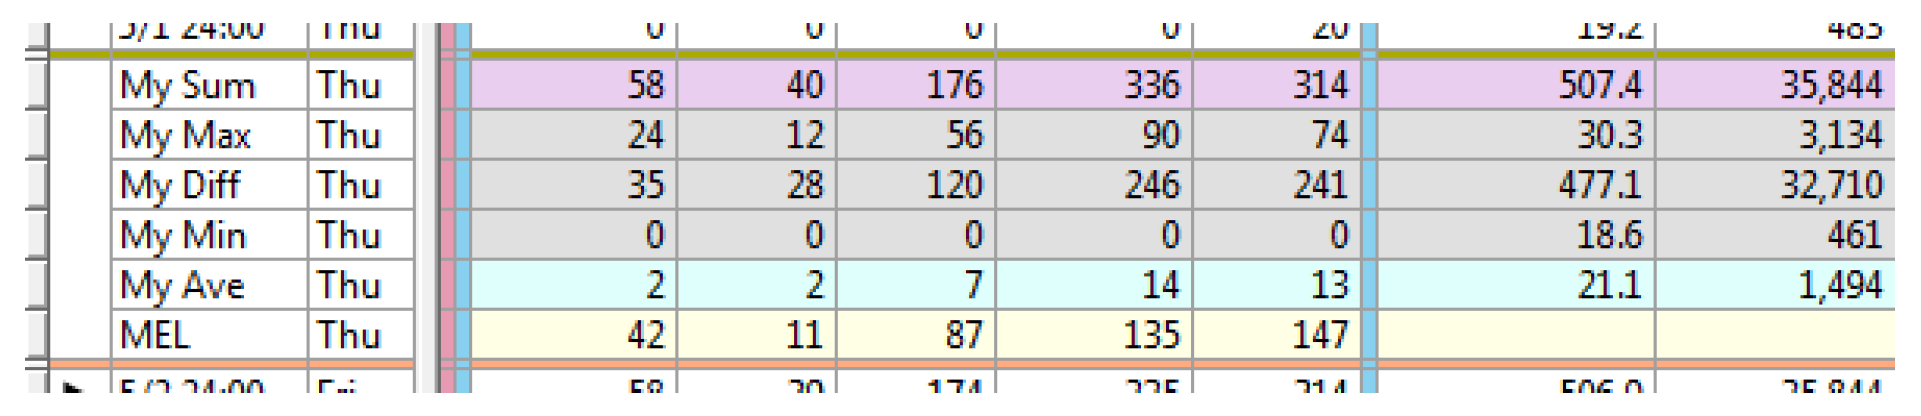
The following custom summary row types are supported.
• Divider. A thin row, without text, having a configurable color.
• Sum of all timesteps in the time aggregation.
• Average of all timesteps in the time aggregation
• Maximum of all timesteps in the time aggregation
• Minimum of all timesteps in the time aggregation
• Difference of the prior two data rows.
• Slot Reference. This resolves to either a scalar slot or a series slot having a timestep size of the timestep aggregation.
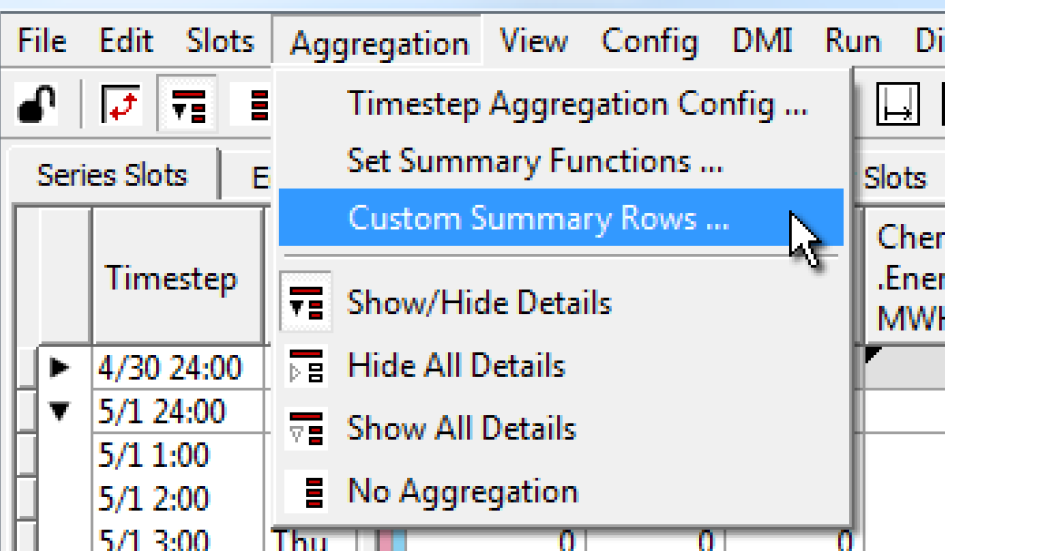
Each custom summary row can be configured with a unique background color. To display the Custom Aggregation Summary Rows configuration dialog box, select Aggregation, then Custom Summary Rows.
Each row is configured through these controls.
•  button. insert a new row, above.
button. insert a new row, above.•  button. delete the row.
button. delete the row.• Row Type. an option menu for selecting among these different types of aggregation
• Color. background color. Select the button to choose a color.
• Label. A text field used to label the row.
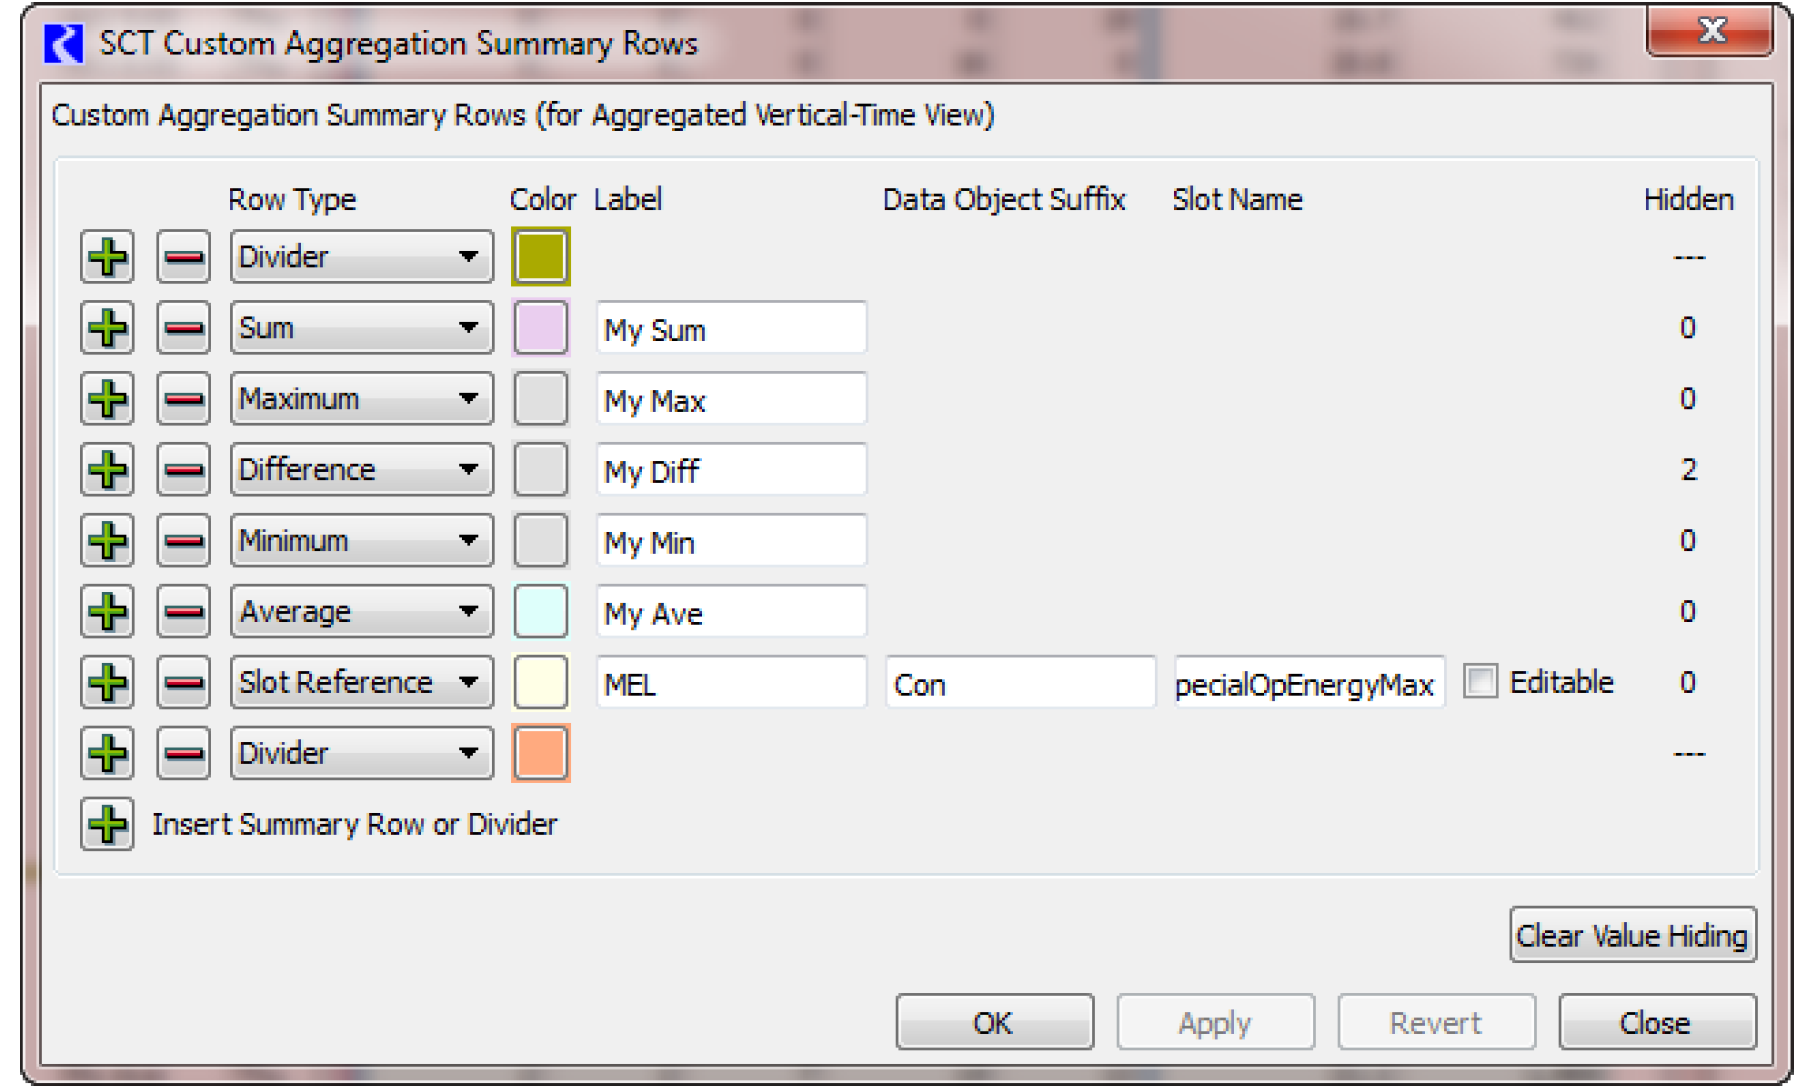
Slot Reference Rows
These contain the following additional controls to identify a particular series slot (of the aggregation size) or scalar slot for each simulation object column. The primary reference simulation object will be the object containing the SCT column's associated series slot. The reference slot must have the same unit type as the slot. If they have different unit types, no data will be shown in the reference row. The additional controls are:
• Data Obj Suffix. optional object name suffix to specify a Data Object associated with the reference object.
• Slot Name. the name of a slot on the reference object or associated data object.
• Editable. checkbox to indicate if the data should be editable in the SCT.
Custom Summary Row Behavior
The Custom Summary Rows support only single-cell selection, and such a selection is active only if no other SCT cells are selected. The Custom Summary Row cells are primarily read-only, but the read-only cross-hatch is not shown. Custom Summary Row cells are automatically updated whenever changes to any of the other SCT cell values change. In the case of Slot Reference rows, changes to the referenced slot are also automatically reflected.
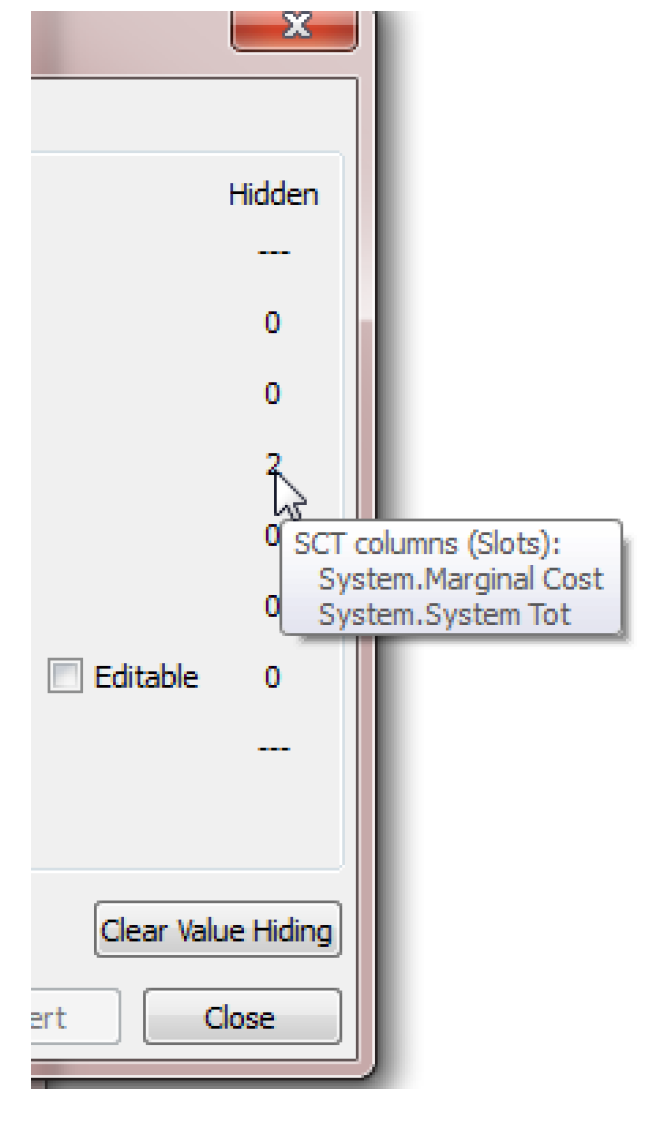
Hiding Row Values
The content of a custom summary cell can be hidden by right-clicking the cell and selecting Hide Aggregation Value. This can be useful to hide the aggregation if it does not make sense for a particular slot. A cell value hidden in this way can be reshown by selecting the Show Aggregation Value context menu operation.
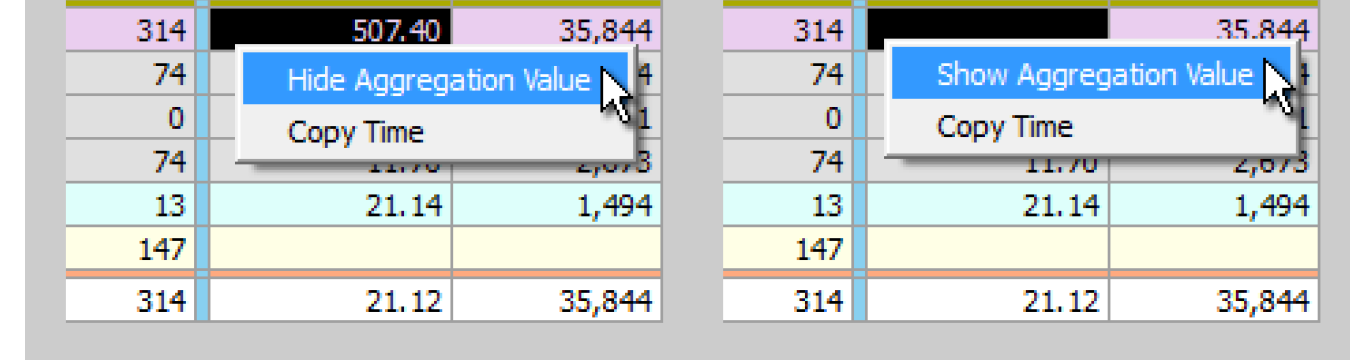
All such hidden cell values can be reshown with an operation in the configuration dialog accessed from the Aggregation, then Custom Summary Rows The Hidden column lists the number of hidden slot values. Hover over a number to see the slots hidden. Select the Clear Value Hiding button to show all values.
Axis Orientation
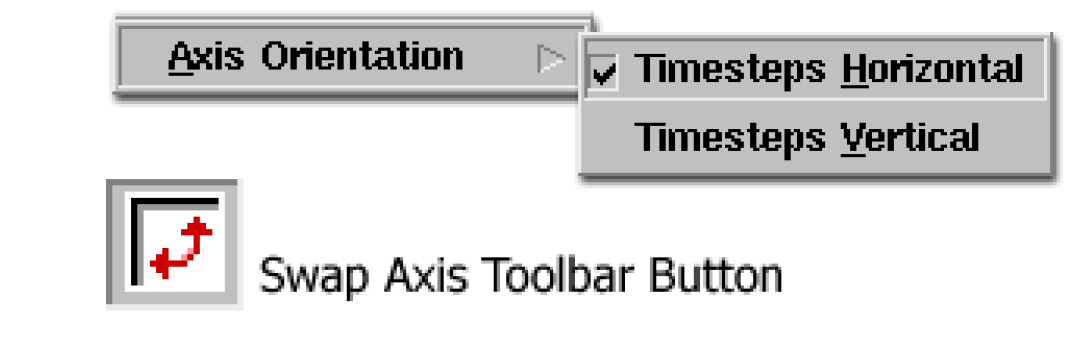
Use one of the following methods to swap the two SCT axes:
• Select the Swap Axis Toolbar Button.
• Select View, then Axis Orientation.
You can display either axis orientations as Aggregated or Non-Aggregated views (see“Timestep Aggregation” for details).The axis orientations are referred to in the interface and in SCT documentation as vertical or horizontal timestep axis orientation.
Vertical Timestep Axis Orientation
• Columns are Slots
• Rows are
– Timesteps or
– Timestep aggregate summaries
– Custom aggregation summary rows
Horizontal Timestep Axis Orientation
• Rows are Slots
• Columns are Timesteps or Timestep Aggregates
Copy and Paste
See the following topics for descriptions of the types of Copy and Paste that can be done in an SCT:
Copy and Paste
The default Copy operation (Ctrl+C) copies the selected cell’s values to the INTERNAL RiverWare SCT clipboard (i.e. it is available only to the SCT not elsewhere in RiverWare or other applications). The copy action is only available for selection within a single slot or across one or more entire timesteps. The default paste operation (Ctrl+V) (and the Paste toolbar button) pastes only Input values into the current selection. Values computed as a result of a model run are not pasted. Specifically:
• Input flagged values are pasted to the destination timesteps with the Input Flag.
• The final timestep value of a Target Operation is copied to the destination with the Target Flag, and the Begin Target is pasted if an explicit Begin Target timestep was defined (but only if the entire Target Operation was included in the copied selection).
• Best Efficiency (B), Max Capacity (M), Drift (D) and Unit Values (U) flagged timesteps in the copied (source) selection are pasted as undefined (NaN) values in the destination timesteps but with the source flag.
• Other timesteps are cleared—that is, set to NaN with an Output Flag.
Copy and Paste as Input
The default Copy operation (Ctrl+C) copies the selected cell’s values to the INTERNAL RiverWare SCT clipboard (i.e. it is available only to the SCT not elsewhere in RiverWare or other applications). The copy action is only available for selection within a single slot or across one or more entire timesteps. Selecting Edit, then Paste as Input (also, Ctrl+N) pastes all defined (non-NaN) values from the copied (source) selection to the destination timesteps, assigning the Input Flag to those values. Undefined (NaN) values from the copied (source) selection are pasted as NaN / Output Flagged values in the destination timesteps.
Export Copy and Import Paste
The Export Copy operation copies the selected cell’s values to the SYSTEM clipboard (i.e. it is available for any other application and within RiverWare where an Import Paste is supported). Select Edit, then Import Paste to paste all defined (non-NaN) values. Both operations provide a dialog that gives options on what to export/import.
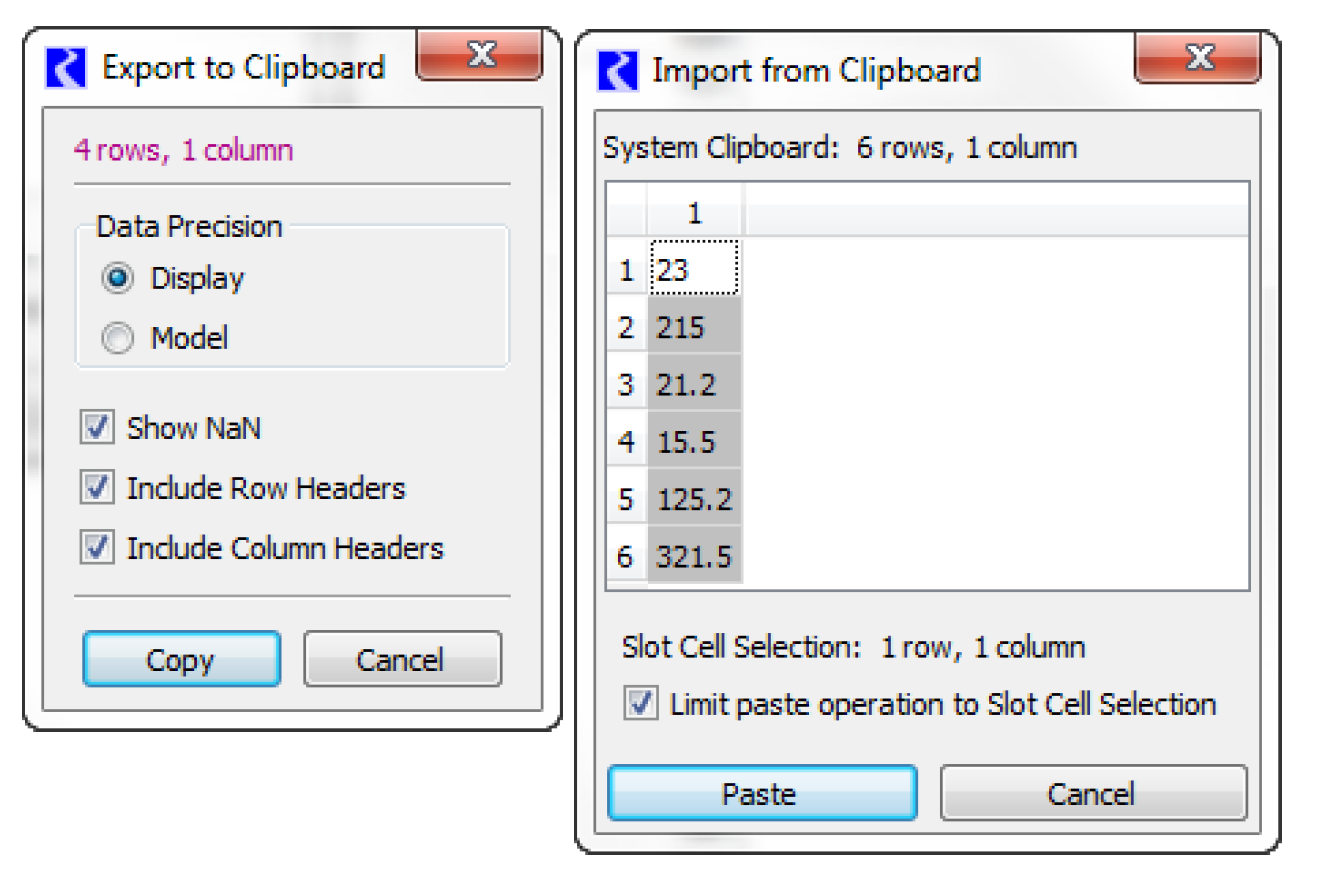
See “Copy/Paste Data to/from the Clipboard (e.g., to Excel).” for additional information on using Export Copy and Import Paste.
Integer Indexed SCTs
Up to this point, we have presented the SCT and assumed that the you are always displaying timeseries data. It is also possible to display integer indexed slots. See “Integer-indexed Series and Agg Series Slots” for more information on Integer Indexed Series Slots. An SCT can show integer indexed slots, but because a SCT must have the same timestep size for all slots displayed, it cannot also show time indexed slot. As a result, you are prohibited from adding integer indexed slots to a SCT that already has time indexed slots and vice versa. When an SCT is created, if you add an integer indexed slot, that SCT becomes fixed using integer indices. An Integer Indexed SCT is slightly different than a normal SCT because certain operations are not allowed. The following describes the differences when an SCT is displaying integer indexed series
• SCT dialog. The following controls are disabled as they are not valid:
– Aggregation, then Aggregation Config
– Aggregation, then Show/Hide Details
– Aggregation, then Hide All Details
– Aggregation, then Show All Details
– Aggregation, then No Aggregation
– Config, then Save Current Settings as Default
• SCT dialog. The following controls are relabeled to better indicate the operations
– View, then Axis Orientation, then Timesteps Vertical becomes Indices Vertical
– View, then Axis Orientation, then Timesteps Horizontal becomes Indices Horizontal
• SCT Configuration dialog, General tab. Options have been disabled
– Always Synchronize Range to Slots checked and disabled
Note: Selecting this item indirectly disables alternative range controls.
– Double-click Data Cell Toggles Detail Rows unchecked and disabled
• SCT Configuration dialog, Horz Time tab. Options have been renamed or disabled
– Tab renamed to Horz Index
– Description becomes Horizontal Index Orientation Settings
– Column Headers: Include Weekday unchecked and disabled
– Column Headers: Hide Hours if all “24:00” unchecked and disabled
– Show Column: Agg. Summary Function unchecked and disabled
– Draw Day Divider Columns unchecked and disabled
– Draw Weekend Divider Columns unchecked and disabled
– Draw Month Divider Columns unchecked and disabled
– Draw Year Divider Columns unchecked and disabled
• SCT Configuration dialog, Vert Time tab. Options have been renamed or disabled
– Tab renamed to Vert Index
– Description becomes Vertical Index Orientation Settings
– Column Headers: Include Agg. Summary Function unchecked and disabled
– Show Column: Weekday unchecked and disabled
– Draw Day Divider Rows unchecked and disabled
– Draw Weekend Divider Rows unchecked and disabled
– Draw Month Divider Rows unchecked and disabled
– Draw Year Divider Rows unchecked and disabled
• SCT Configuration dialog, Toolbar tab: Options have been renamed or disabled
– Summary Detail Mode Buttons unchecked and disabled
– Button: Show/Hide Details unchecked and disabled
– Button: Hide All Details unchecked and disabled
– Button: Show All Details unchecked and disabled
– Button: No Summaries checked and disabled
– Date Time Spinner unchecked and disabled
• SCT Configuration dialog, Summary tab: Options have been renamed or disabled
– Show Timestep Flag Colors: Never cleared and disabled
– Show Timestep Flag Colors: When detail rows are hidden cleared and disabled
– Show Timestep Flag Colors: With 7 or fewer timesteps cleared and disabled
– Show Timestep Flag Colors: Always selected and disabled
• SCT Configuration dialog, Color tab: Options have been renamed or disabled
– Day Divider button disabled
– Weekend Divider button disabled
– Month Divider button disabled
– YearDivider button disabled
– Simulation Boundary Divider button disabled
Edit Series Slot List Tab
The Edit Series Slot List tab contains a list of series slot columns shown in the Series Slots tab and consists of two modes:
• Add / Delete Move Series Slots. This is used to configure which slots are shown and their ordering and grouping on the SCT.
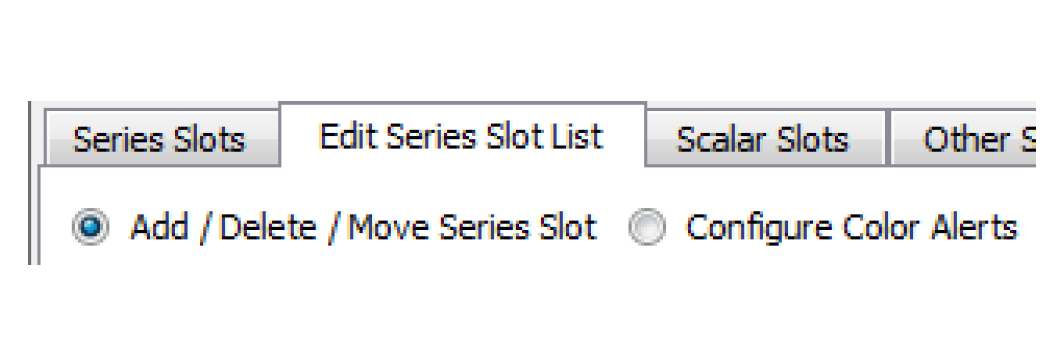
• Configure Color Alerts. Configure thresholds for color alert interval ranges. Essentially, this mode allows you to create conditional coloring on the Series Slots tab.
These two operations are described in the following sections. For both modes, the dialog shows a two-level tree-view with dividers as top-level items and subsequent slot items as children of the divider.
Note: Dividers without text are shown with the text of the following slot item when the divider's tree is closed.
Adding, Deleting, and Moving Slots
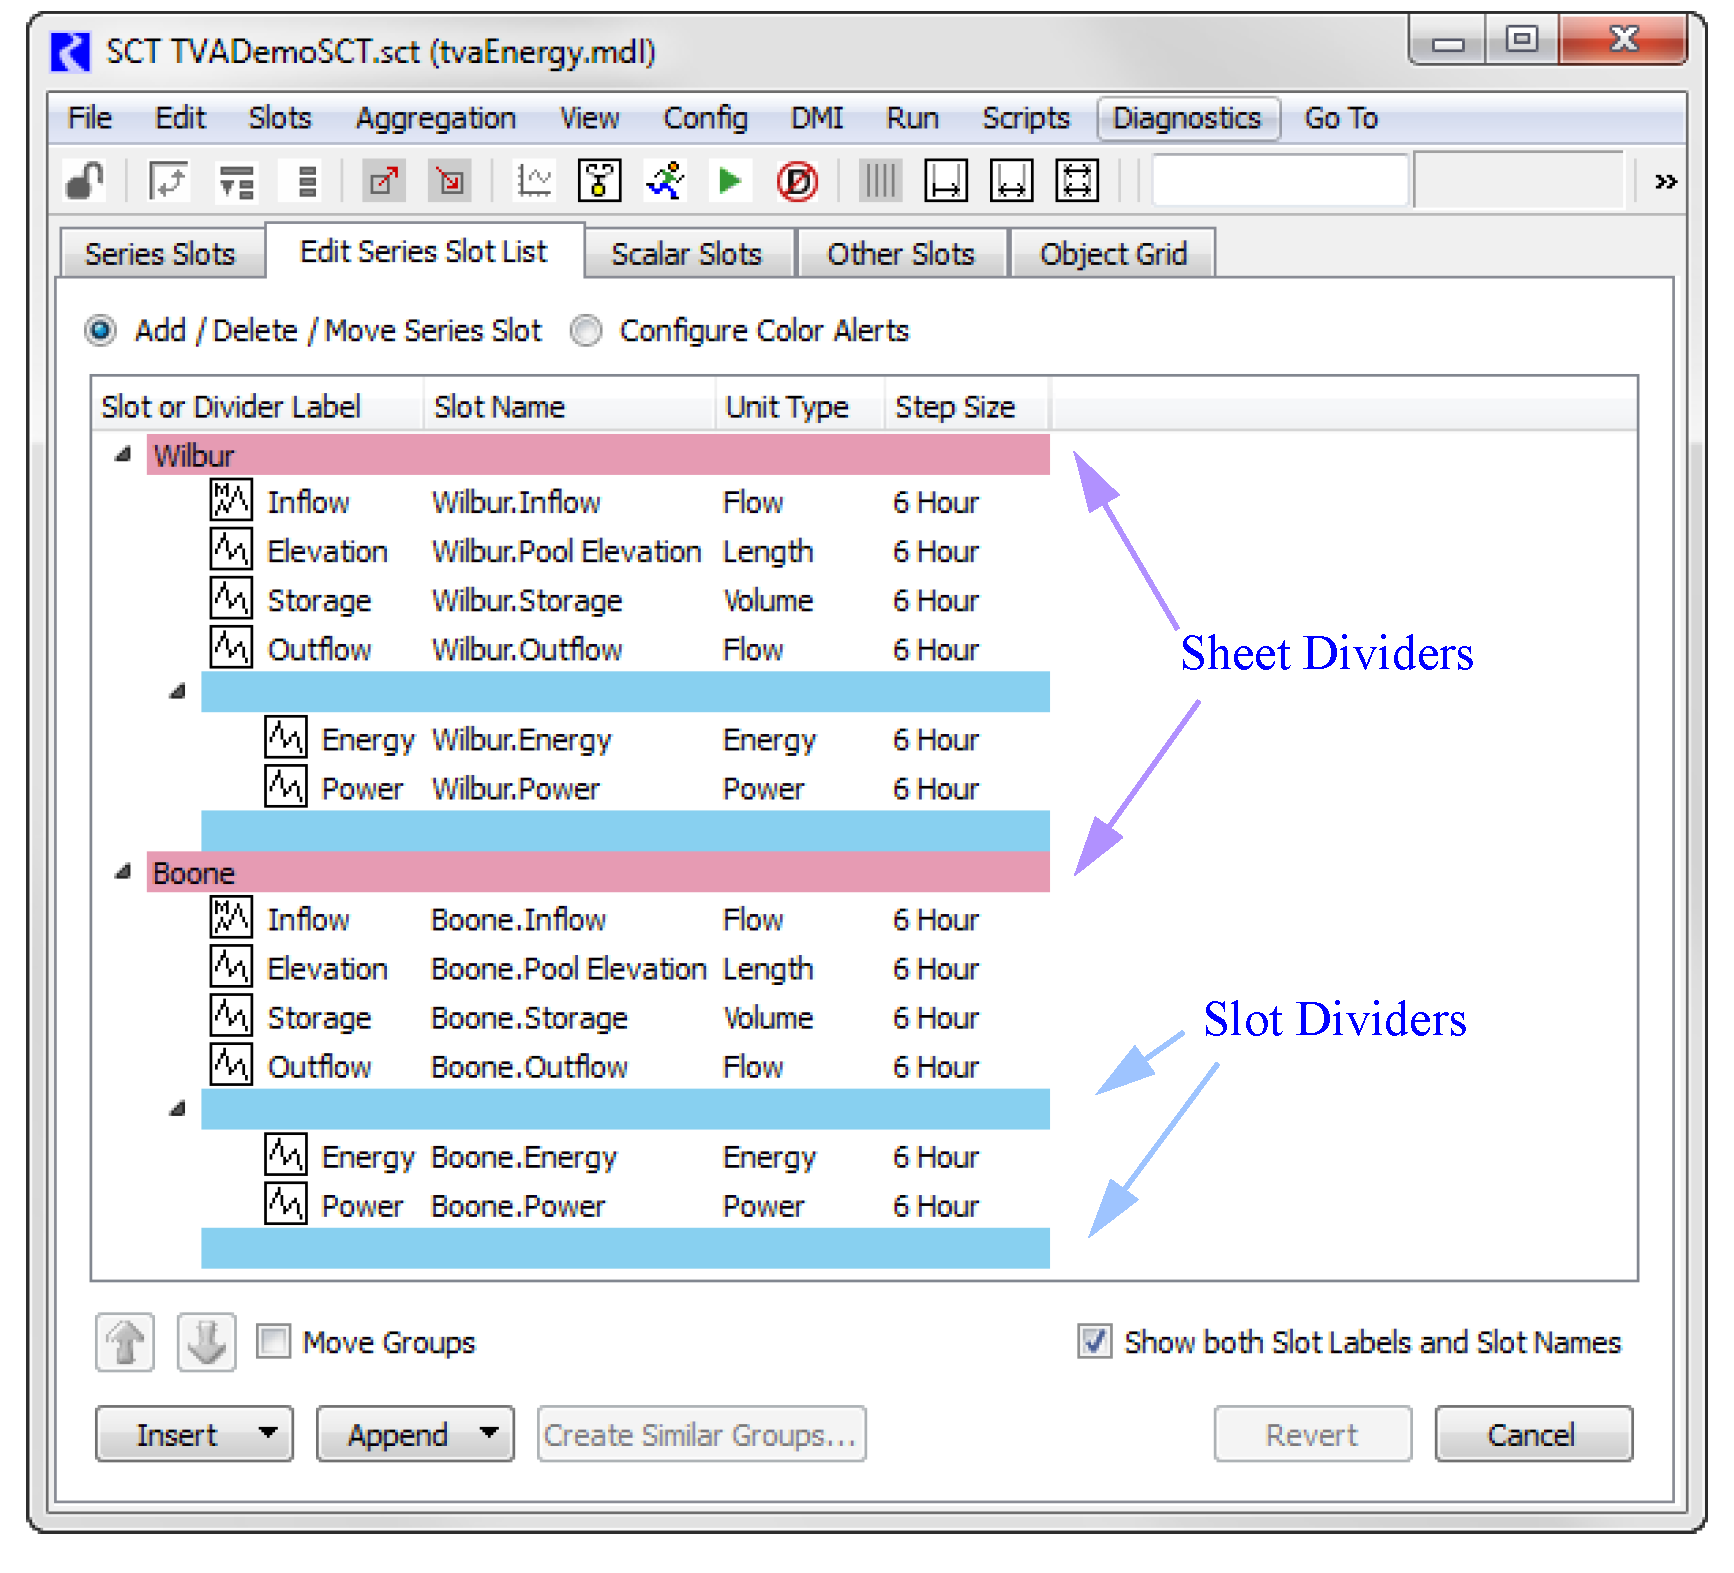
When in Add / Delete Move Series Slots mode, this dialog is used to organize your series slots. You can re-arrange the order, create groups, and even create separate sheet tabs from this dialog. There are two kinds of dividers:
• Sheet Dividers are used to create separate sheets with a tab for each sheet located at the bottom of the SCT.
• Slot Dividers are graphical elements that are used to separate slots on each sheet
Both types of dividers behave the same in this dialog in terms of moving and creating similar groups. The slot list has an initial divider item so there is always at least one group.
Following is a description of the buttons available on this tab:
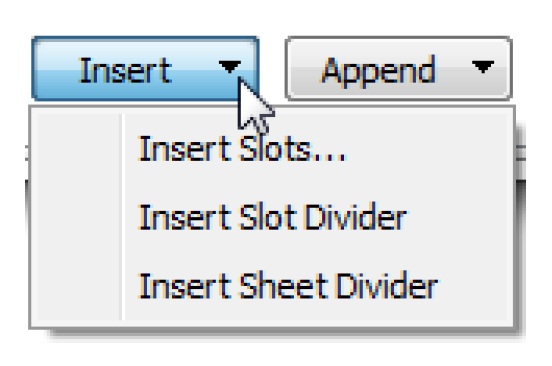
• Insert. Use the menu to Insert Slots, Insert Slot Divider, or Inset Sheet Divider. You must select a row before this option is enabled. The Insert Slots option opens the slot selector to insert new slots onto the SCT.

• Append. Use the menu to Append Slots, Append Slot Divider or Append Sheet Divider. You must select a row before this option is enabled. The Append Slots option opens the slot selector to append new slots onto the SCT.
• Create Similar Groups. special operation for groups containing slots on a single simulation object or account.
• Revert. discards changes made to the series slot list since the series slot list edit mode was started. This button is enabled only if changes have been made.
• Accept / Cancel. takes you to the Series Slot tab. If any changes to the slot list had been made, the button label will be Accept, and selecting the button applies those changes to the series slot data table. If no changes had been made (or if changes had been reverted), the button label is Cancel and selecting the button has no effect on the series slot data table.
The SCT must be unlocked for any operation to be enabled. If the SCT is locked, the Edit Series Slot List tab is disabled.
When showing the Edit Series Slot List tab, the SCT Lock controls (toolbar button and menu item) become disabled. The other SCT tabs remain enabled until a change is made to the Series Slot list.
Once a change is made to the Series Slot list, the other tabs become disabled. You can Revert or Accept the changes.
Adding Slots and Dividers
In general, use the Insert or Append buttons at the bottom.
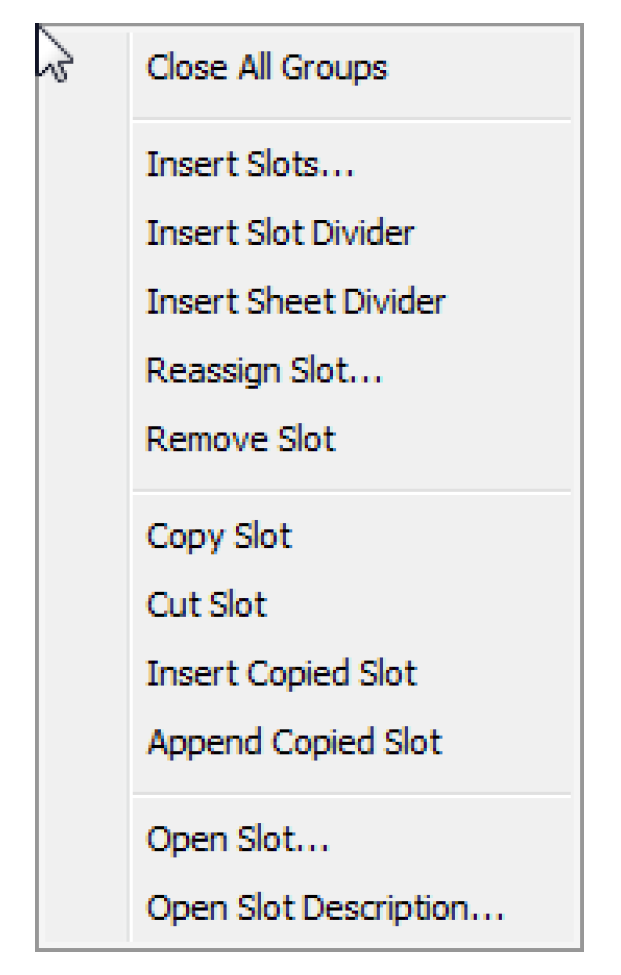
Alternatively, use the right-click context menu to access a list of possible actions.
Slot Dividers can be added at either the top or secondary level. Sheet Dividers are always added at the outermost level.
Organize Slots
Two different move modes are supported. You can switch between these two modes by toggling the Move Groups checkbox. Selected items or groups are moved up or down one logical position (defined by the mode) by selecting the Up or Down arrow buttons.
• Move Groups ON. The Up and Down arrow buttons are enabled only when at least one divider is selected (and only when the divider selection doesn't include an item already at the top or bottom, for the two respective move directions). In this mode, the order of the slots within each group is preserved.
Note: When all groups are closed, the Move Groups checkbox is forced on, and is disabled.
• Move Groups OFF. Selected slot and divider items are moved up or down without respect to the grouping defined by the dividers. This is useful for placing dividers at a different position, and for moving slot items within a group, or between different groups.
Since the text label for a slot item does not have to be the name of the slot, you have the option of showing a Slot Name column. This is done by turning on the Show both Slot Labels and Slot Names checkbox.
Create Similar Groups Operation
The Create Similar Groups button is used to create a group of slots similar to the selected group. The button is enabled when the selection applies to slots on one simulation object or account. Selecting the Create Similar Groups button displays a selector that you use to select new objects or accounts.
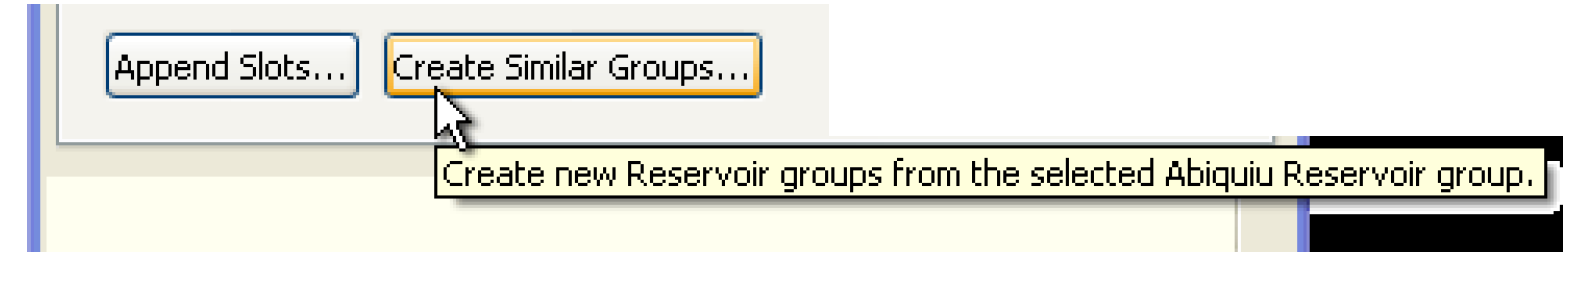
In the case of simulation objects, the object selector is limited to the type of the object of the originally selected group.
After picking one or more simulation objects or accounts, a new group is created for each of those objects (immediately below the originally selected group in the Edit Series Slot List) with the same slots as in the original group. The order of the slots in the original group is used for the new groups.
In Figure 8.9, the original group has slots from one particular power reservoir (Abiquiu Reservoir). This includes slots not present in the two storage reservoirs subsequently picked with the simulation object selector. The slots from the original group that are not present in the picked reservoirs are not included in the new groups.
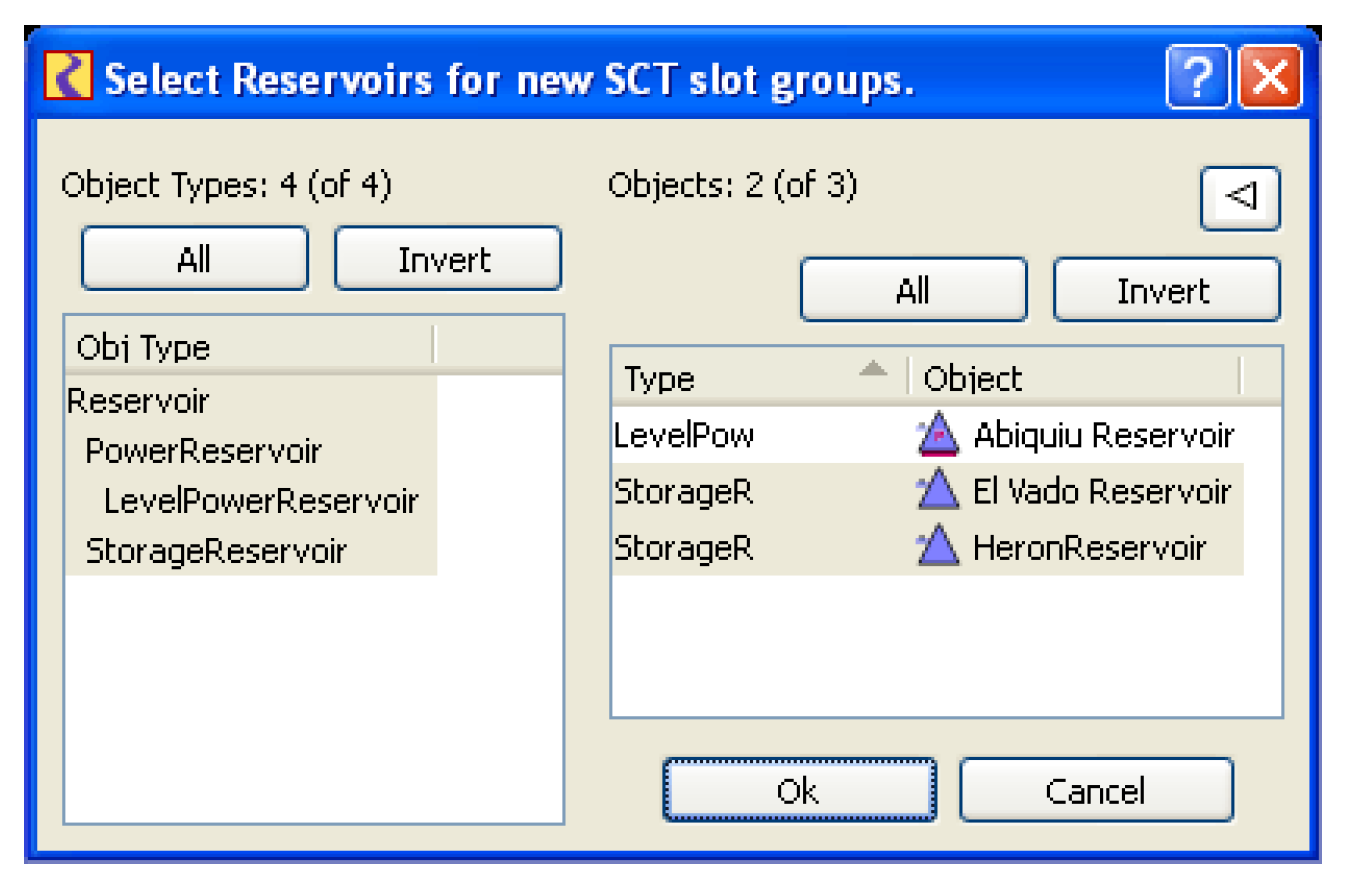
Figure 8.9
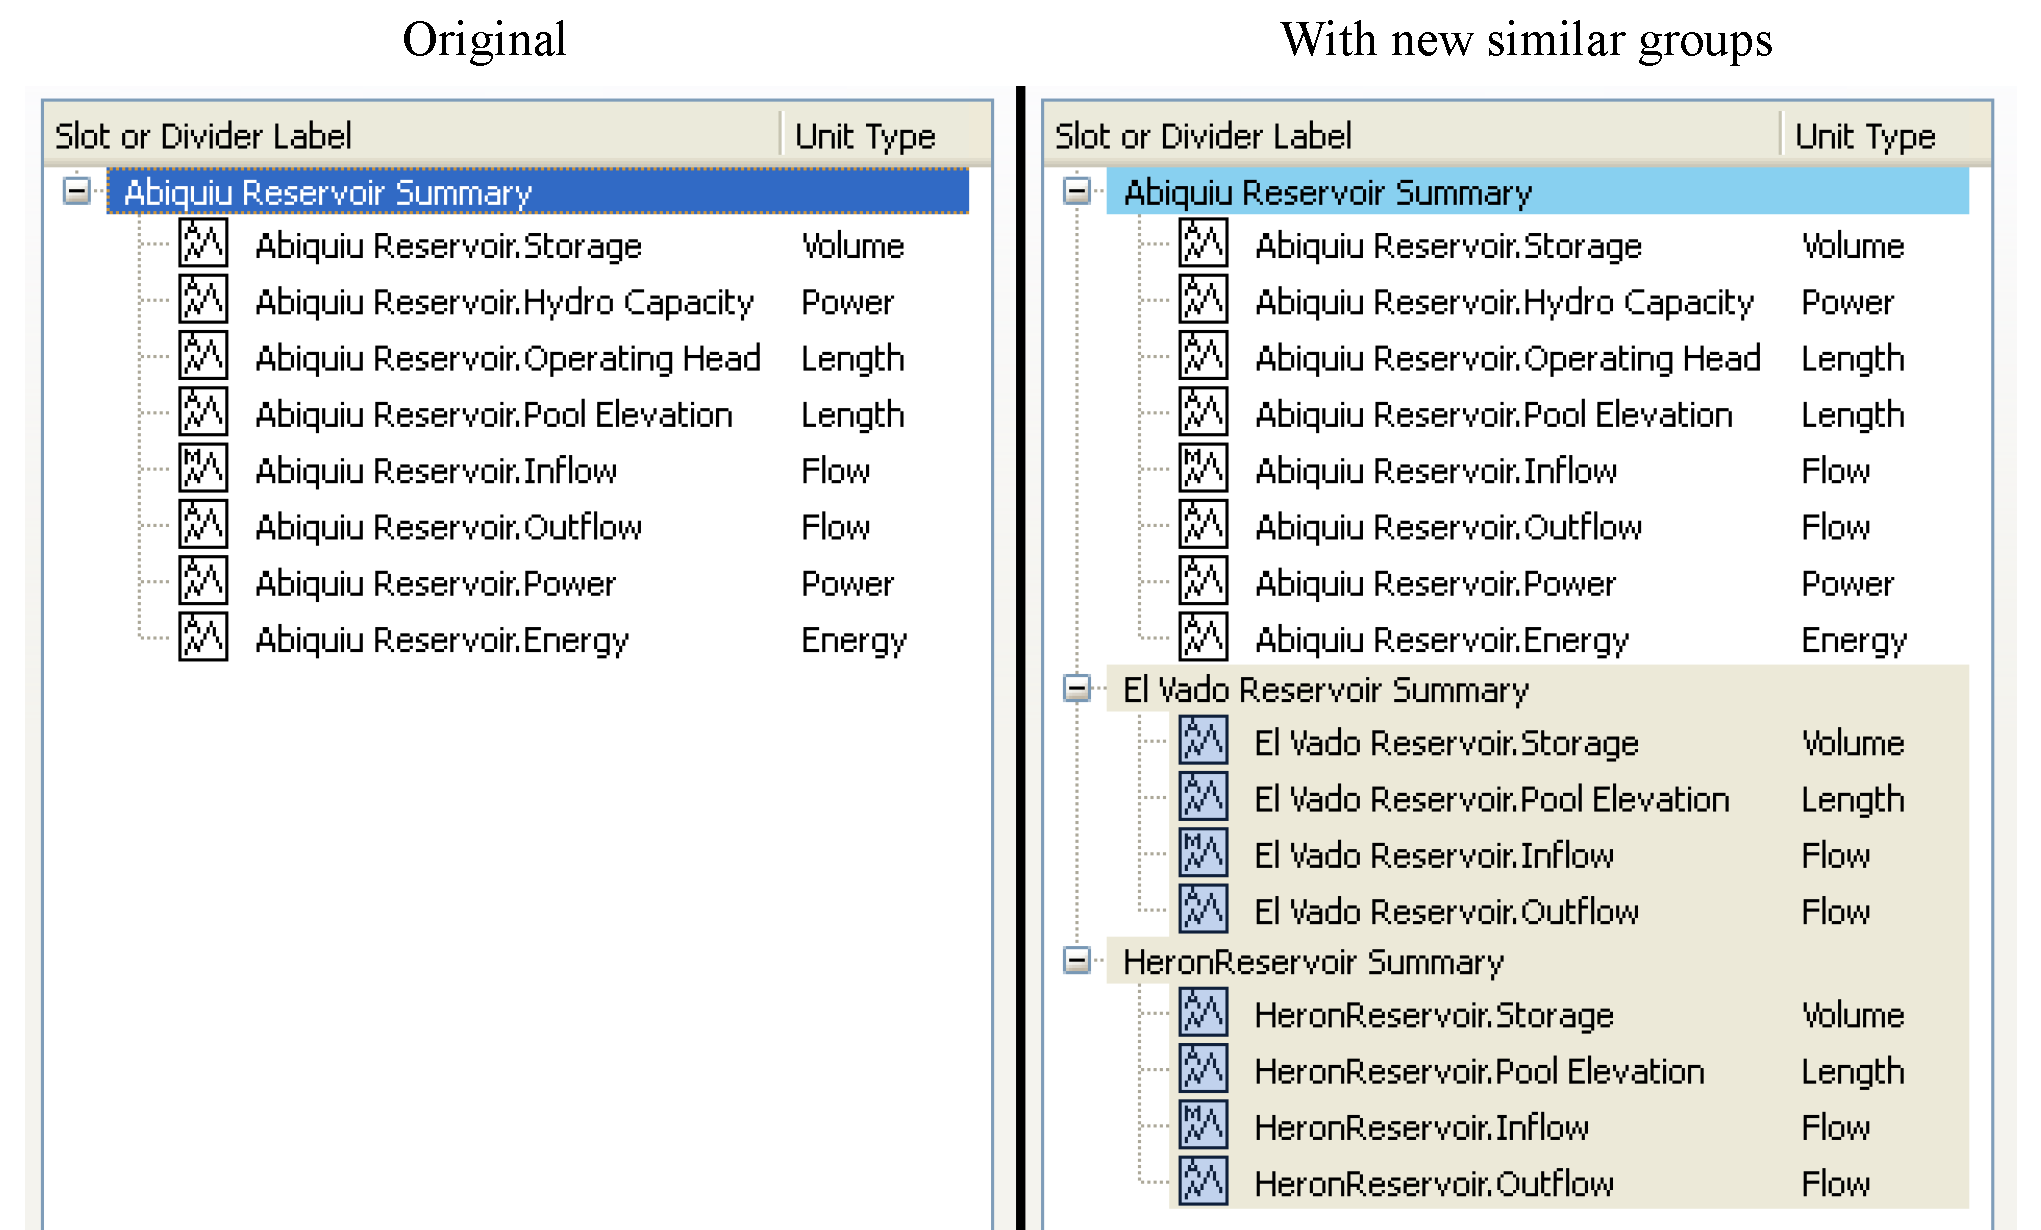
If the original group's divider's text label contains the name of the group's simulation object or account, that name will also be substituted in the divider labels for the new groups.
The Create Similar Groups operation is available only when all the slots within the selected group are from one simulation object or one account.
Edit Multiple Slot Labels
As noted in “Slot Names and Slot Labels”, a slot’s label does not need to match the Slot name. Select Slots, then Set Label / Function and enter any text you like for either the row or column label. See “Slots Menu”.
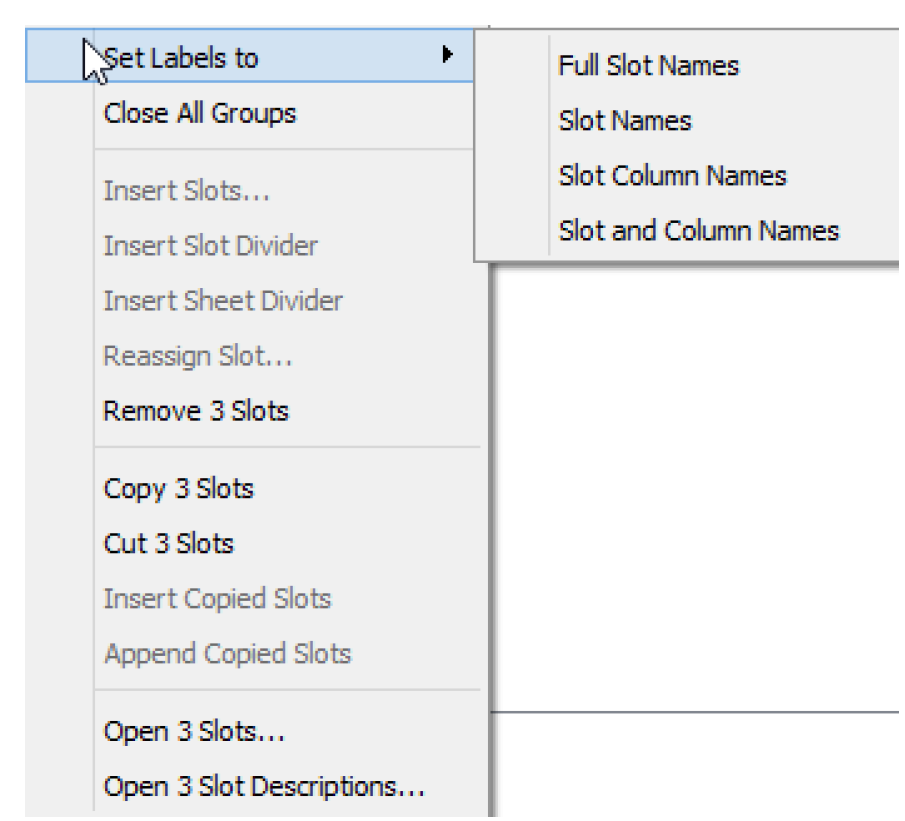
When on the Edit Series Slot List tab, you can set the labels for many slots in one action. Highlight the desired slots, and right-click, then select Set Labels to. Select one of the following options:
• Full Slot Names. Change the label to the Object.Slot name. E.g. “Mead.Inflow”
• Slot Names. Change the label to just the slot name. E.g. “Inflow”
• Slot Column Names. For Agg Series and other multi-column slots, use the column label. E.g. “Rice”
• Slot and Column Names. For Agg Series and other multi-column slots, use the slot and column label. E.g. “Evapotranspiration Rate by Crop.Rice”
Note: This operation will change both the row and column labels.
Configure Color Alerts
When Configure Color Alerts is enabled, the slot list is used to configure the interval/thresholds and colors to use for those values. The intervals and their associated colors are defined for individual series slots.

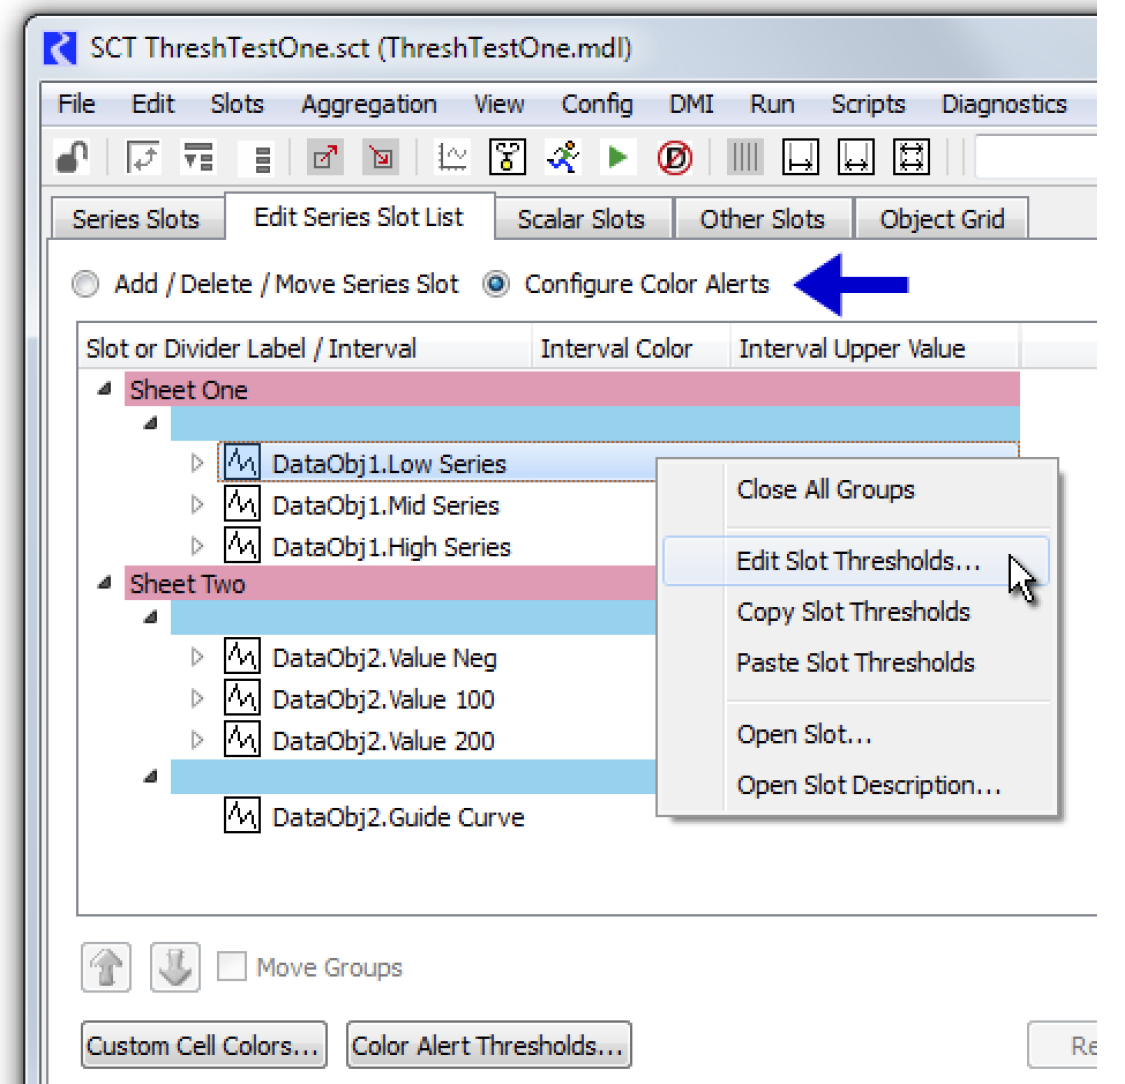
Right-click a slot and select Edit Slot Thresholds context menu to open the SCT Color Alert Threshold Configuration dialog box. This is also accessible from the Color Alert Thresholds button, enabled when a single slot item is selected.
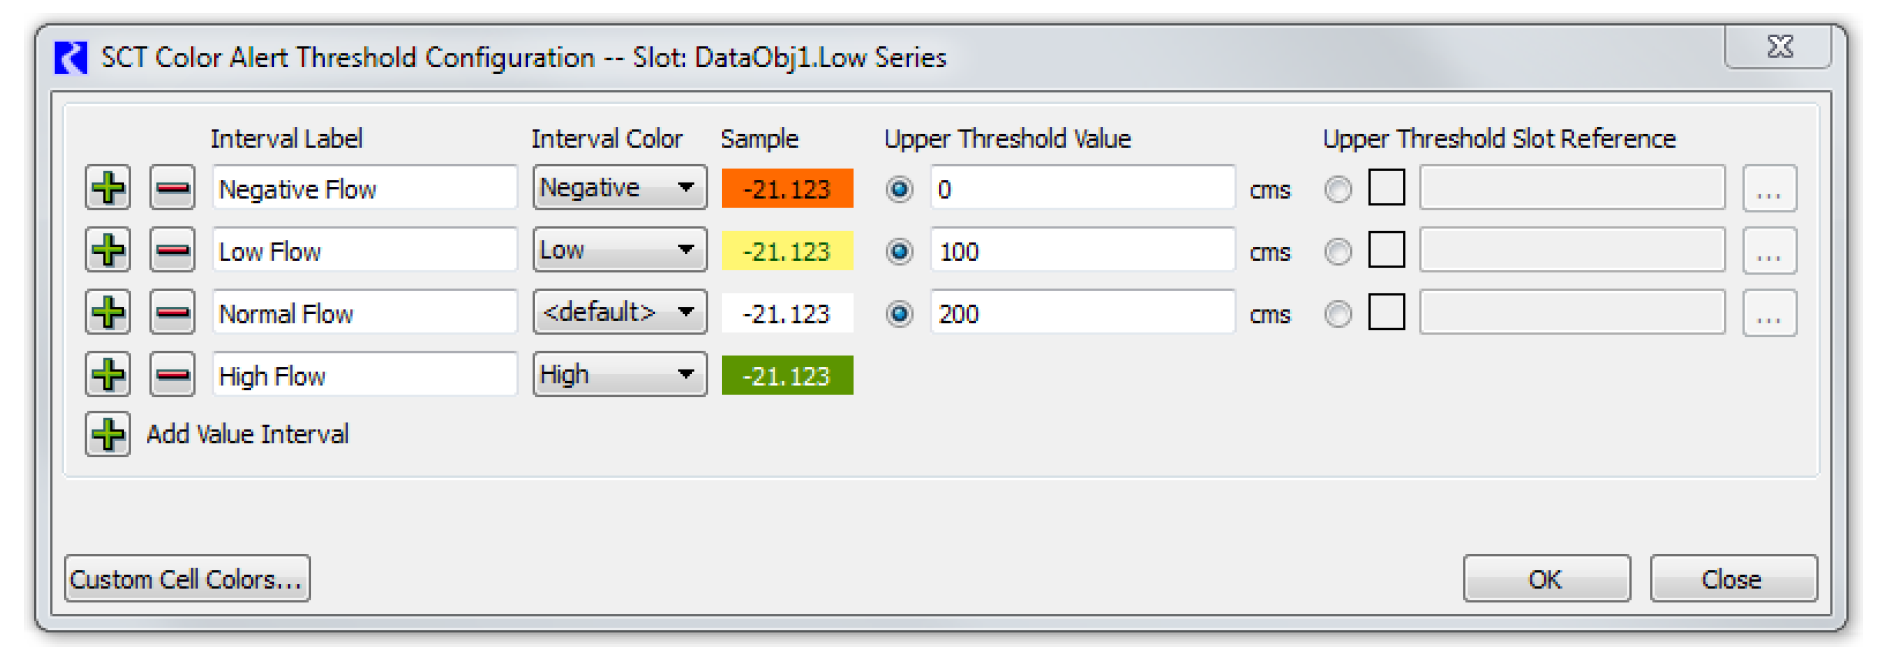
Add intervals using the Plus button. Remove an interval using the Minus button.
For each value interval, you choose among the available Custom SCT Cell Colors defined in the SCT Flags tab or the <default> option, which uses the color associated with the slot timestep cell's series flag. The custom colors can be edited by selecting the Custom Cell Colors button. See “Flags Tab” and “Custom Cell Colors” for details.
Figure 8.10
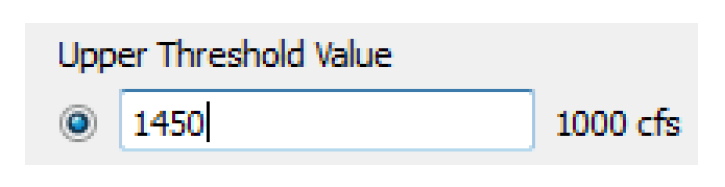
The upper threshold for each interval can be specified as either a static numeric value or you can reference a slot. Select one of the following options:
• Specify a static numeric Upper Threshold Value by entering it into the box. The numeric Upper Threshold Value is shown in the slot's current display units, as determined by the currently active unit scheme.
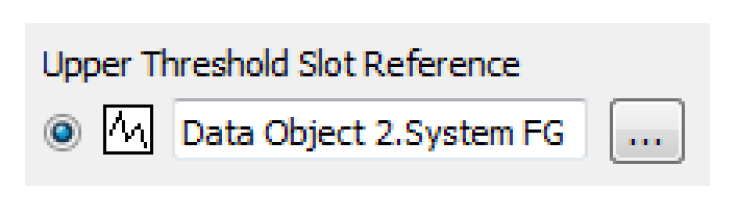
• Specify the Upper Threshold Slot Reference. The name of the referenced slot can be directly edited, or selected using the slot selector (by selecting the More button). The slot selector is shown with the appropriate unit type filter shown, and is limited to the supported types of slots (series, periodic, and scalar).
After accepting the SCT Color Alert Threshold Configuration, the slot's sequence of value intervals is shown as tree view items under the slot.
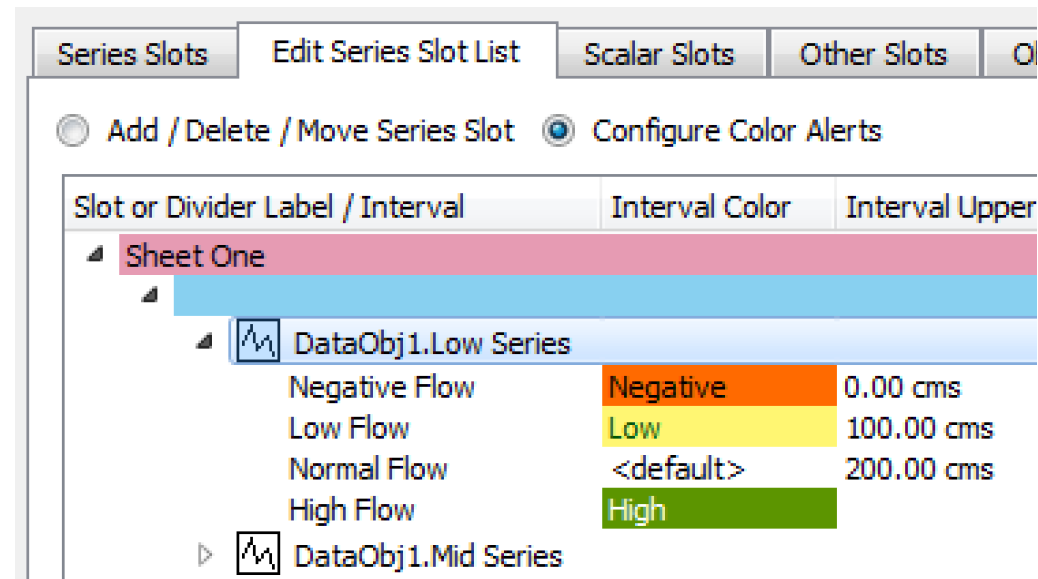
Table 8.1 describes the color values used in the previous examples.
SCT cells with these values | Are shown with these custom colors |
|---|---|
Below 0cms | Negative (orange background). |
Between 0 and 100cms | Low (yellow background) |
Between 100 and 200cms | <default> colors, based on individual cell's slot timestep series flag (e.g. Input, Output, or Rules). |
Above 200 cms | High (green background) |
Note: Custom SCT colors can be applied manually to any set of selected cells, but value alerts have precedence over manually assigned colors. See “Apply Custom Colors to Slot/Timestep Cells” for details.
Note: Several indications are provided for undefined threshold values. This applies both to a missing slot or NaN values within such a slot. A missing slot is indicated in the SCT Color Alert Threshold Configuration dialog with an empty slot type icon. In the SCT series data table, cells for which a missing slot or NaN value is encountered are drawn with a dotted pattern and have a tooltip indicating the threshold value error.
Copying thresholds to other slots
A slot's set of value intervals can be copied to multiple other slots with the use of the Copy Slot Threshold and Paste Slot Thresholds right-click context menu operations.
Note: Slot references are copied as is, no attempt is made to substitute a new object’s name.
Scalar and Other Slots Tabs: Slot Lists
The Scalar Slots and Other Slots tabs display lists of slots. They are used to organize non-series data allowing you to collect these slots together in a convenient location. For example, instead of opening each reservoir and looking for the Elevation Volume table, these can be grouped together on the Other Slots tab.
All slots on the list can be opened and edited from their individual slot dialogs. Also, one or more scalar values can be edited directly from the SCT. The slots are sorted using the same approach used in “Scalar and Other Slots Tabs: Slot Lists”.
Non-series slots are added to the SCT in the same way that series are added. See “Add Slots, Sheet Tabs, and Slot Dividers” for details.
This section describes the two Slot List tabs and their functionality.
Sorting and Reordering Slots
Slots in the Slot List Tabs maintain a custom order. You can change this order or temporarily override it by selecting a column header, which re-sorts, or reverses the sort using data in the selected column.
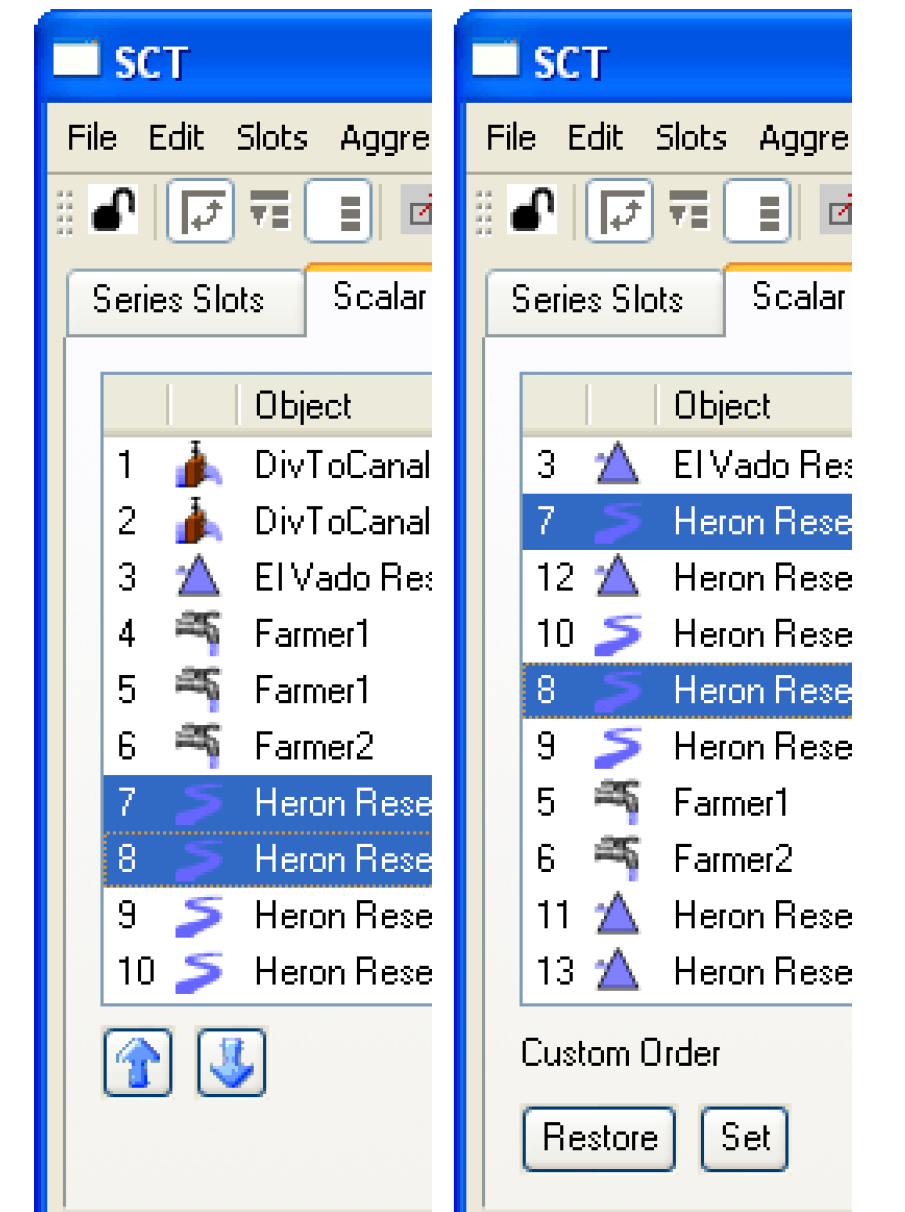
If the list is currently sorted by the custom order, then Up and Down arrow buttons are shown to move the selected items up or down. These buttons immediately modify the custom order.
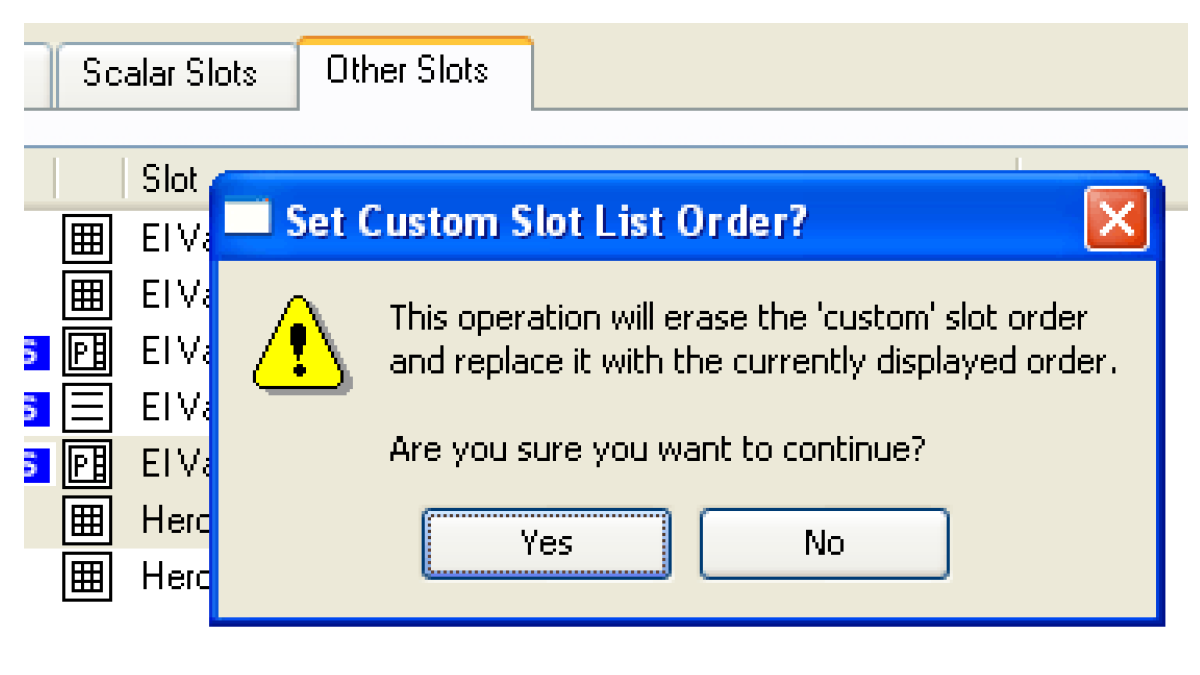
If the list is not currently sorted by the custom order, the following two Custom Order operations are available (see image)
• Restore. Resort to the custom order.
• Set. Reset the custom order from the currently displayed sort order. Before this operation is performed, you must select Yes in the confirmation dialog.
Compress Columns Checkbox
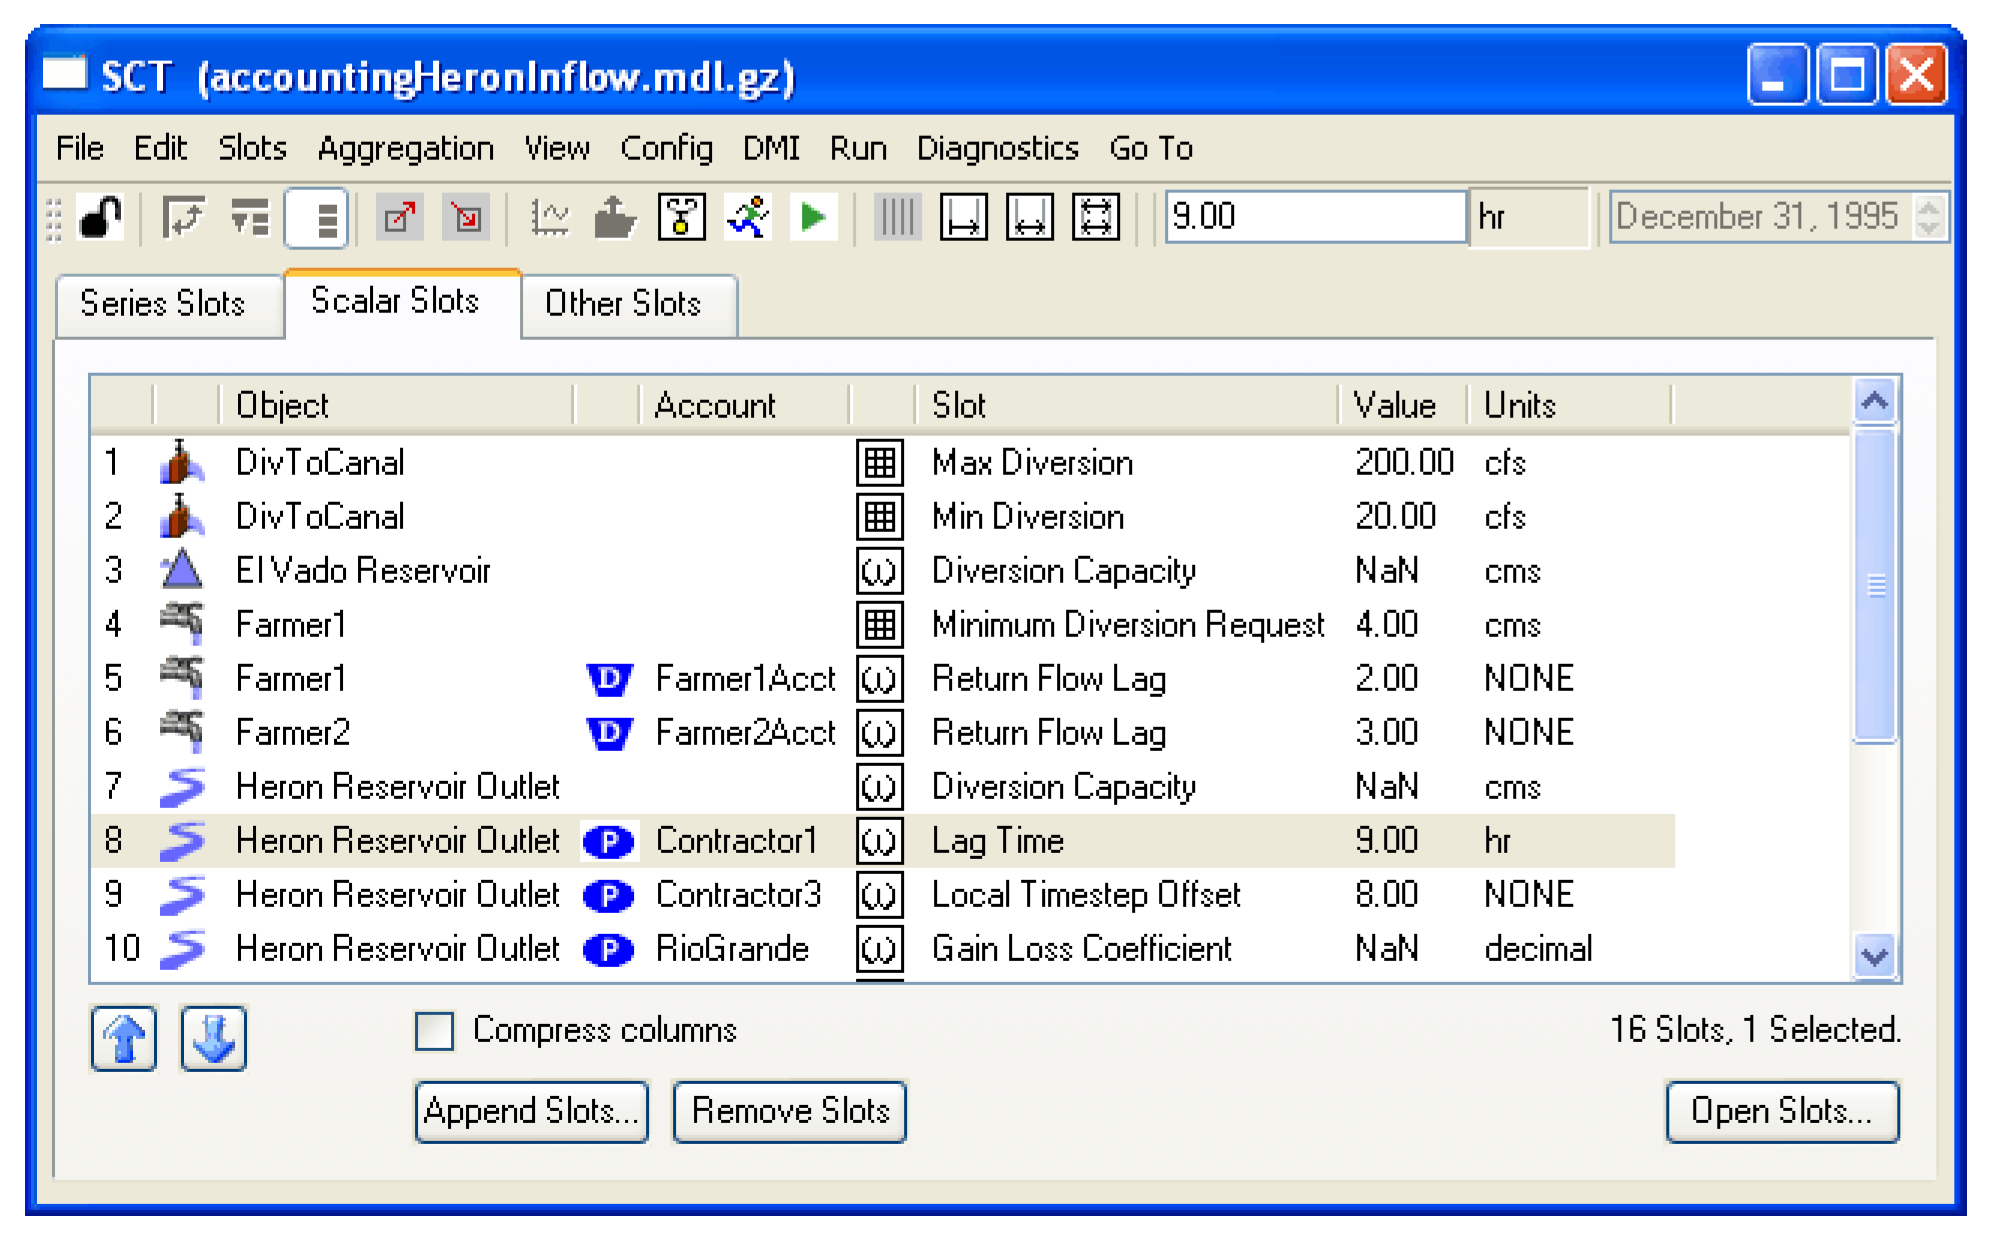
Instead of showing a column for the object and one for the slot, you can instead Compress the names into one column. This is controlled by a Compress Columns box at the bottom of each Slot List Panel.When checked, slots are identified with a single complete name.
Compare Figure 8.11 with Figure 8.12.
Figure 8.11 Compress Columns image
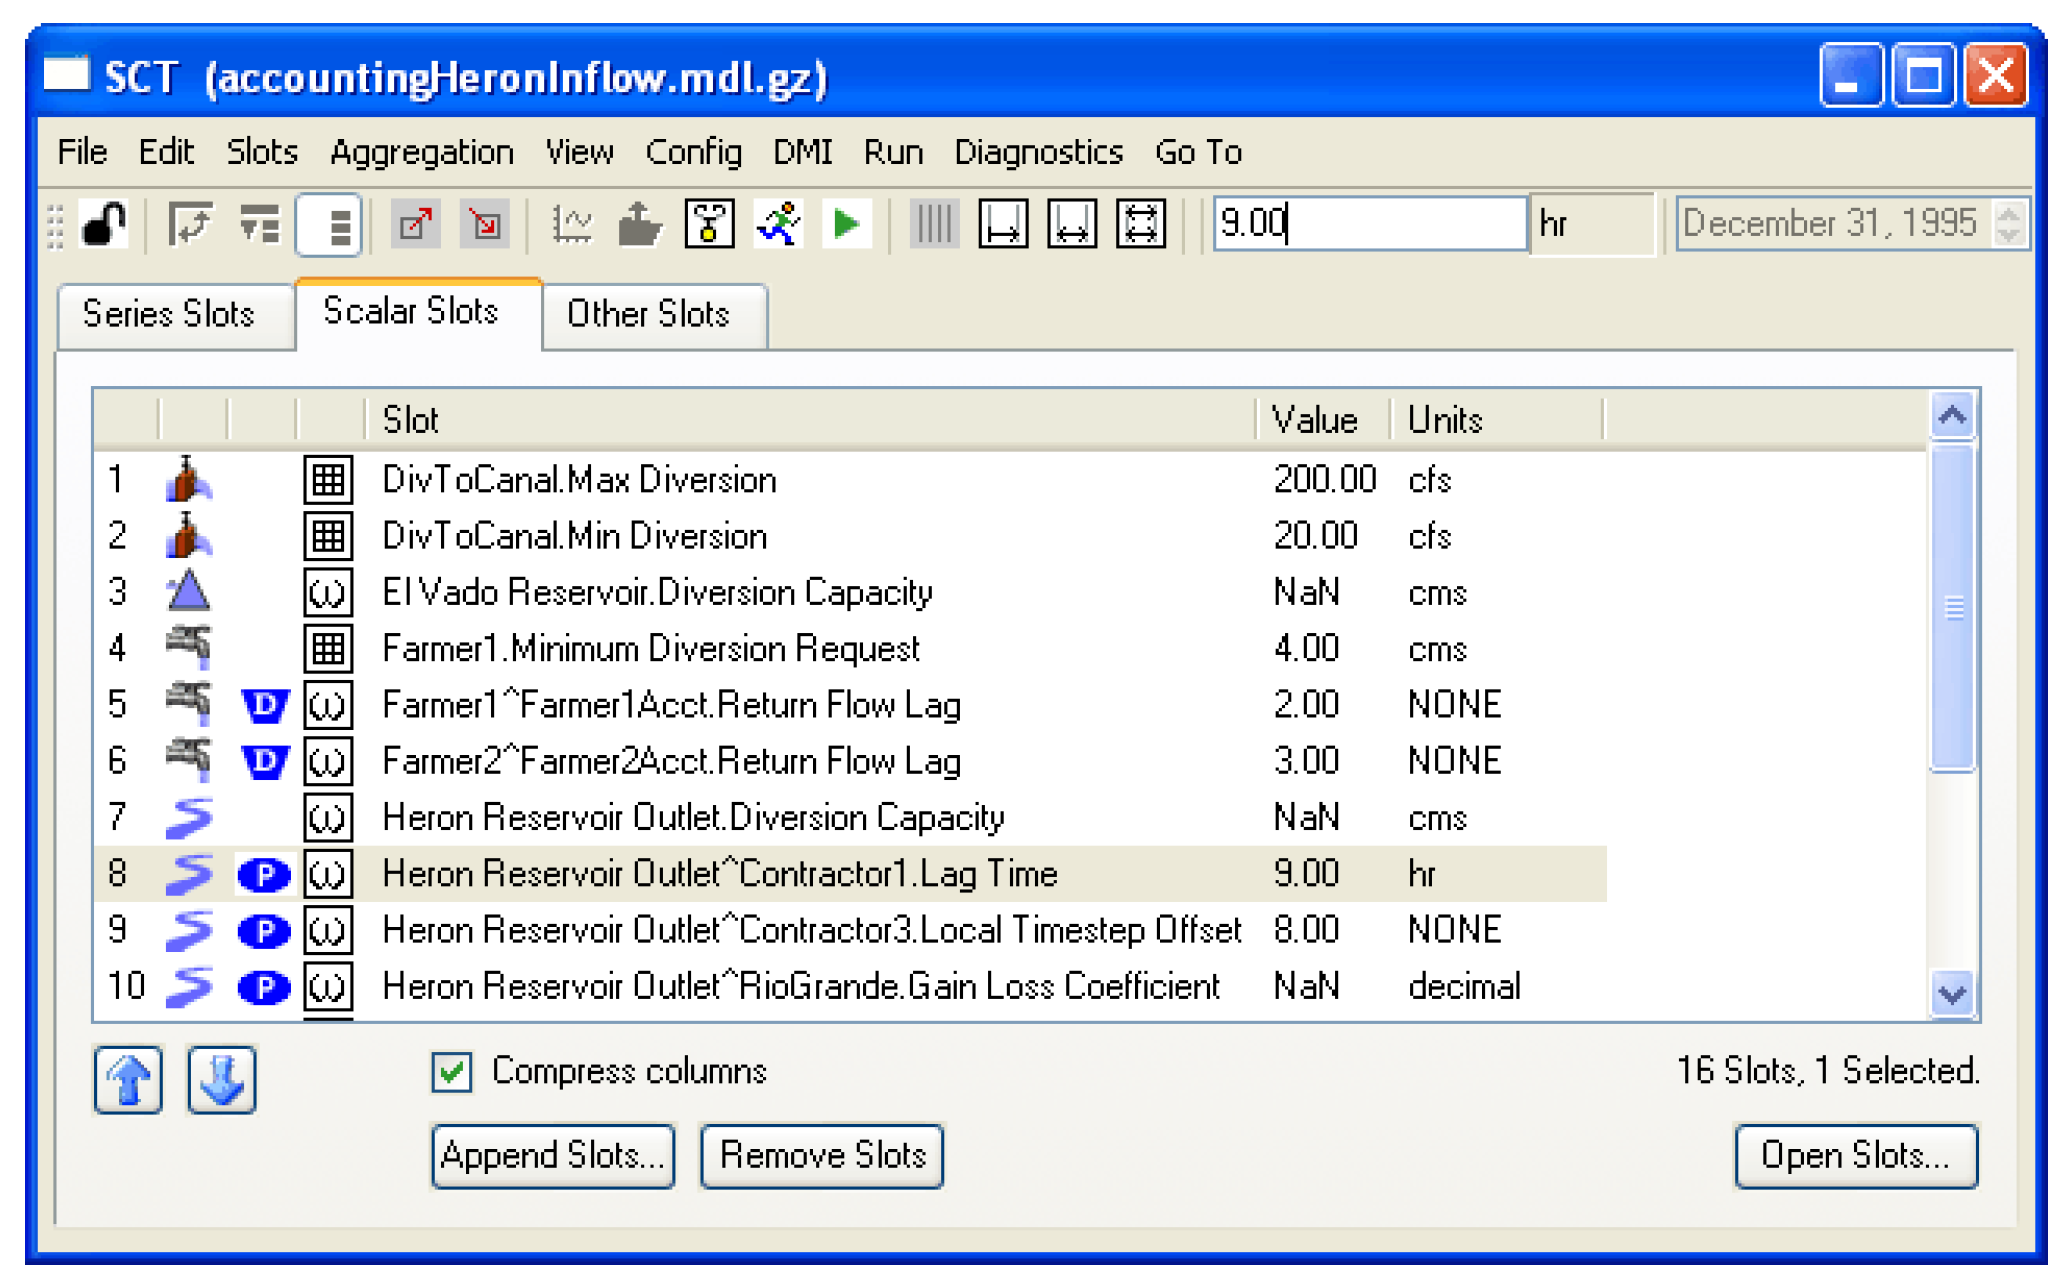
Scalar Slots tab
The Scalar Slots tab is used to show a list of Scalar and 1x1 Table Slots.
Note: 1x1 table slots were used for scalar values before Scalar Slots were implemented. Following is a screenshot of the Scalar Slots tab of an SCT. See “Scalar and Other Slots Tabs: Slot Lists” for additional information on the slot list panel.
Figure 8.12
The values of Scalar Slots and 1x1 Table Slots can be edited from the SCT Scalar Slot List tab in the following ways.
• Double-click on the value.
• Use the right-click context menu.
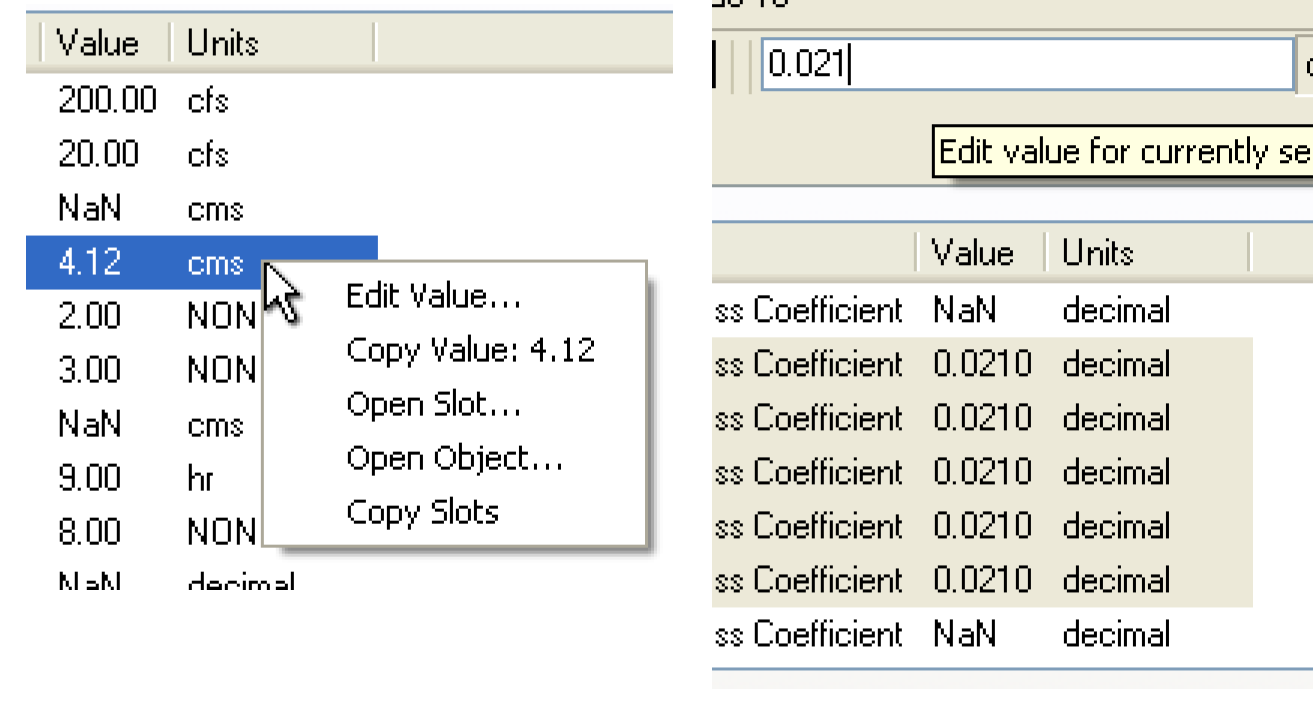
• Select multiple scalars and then enter a number in the SCT main edit field (at the top of the SCT). See image.
• Double-click the slot and edit the value from the Open slot dialogs.
Note: Modifying the number of rows or columns in a 1X1 table slot can lead to unexpected results when editing that slot from the SCT. Also, upon loading the SCT, a previously displayed 1X1 table slot that now has more rows or columns will not be shown.
Other Slots Tab
The Other Slots tab can be used to display a list of other types of slots including Table Slots, Periodic Slots, Statistical Table Slots, and List Slots. These slots are not editable directly from the SCT, but can be easily opened using the Open Slot button.
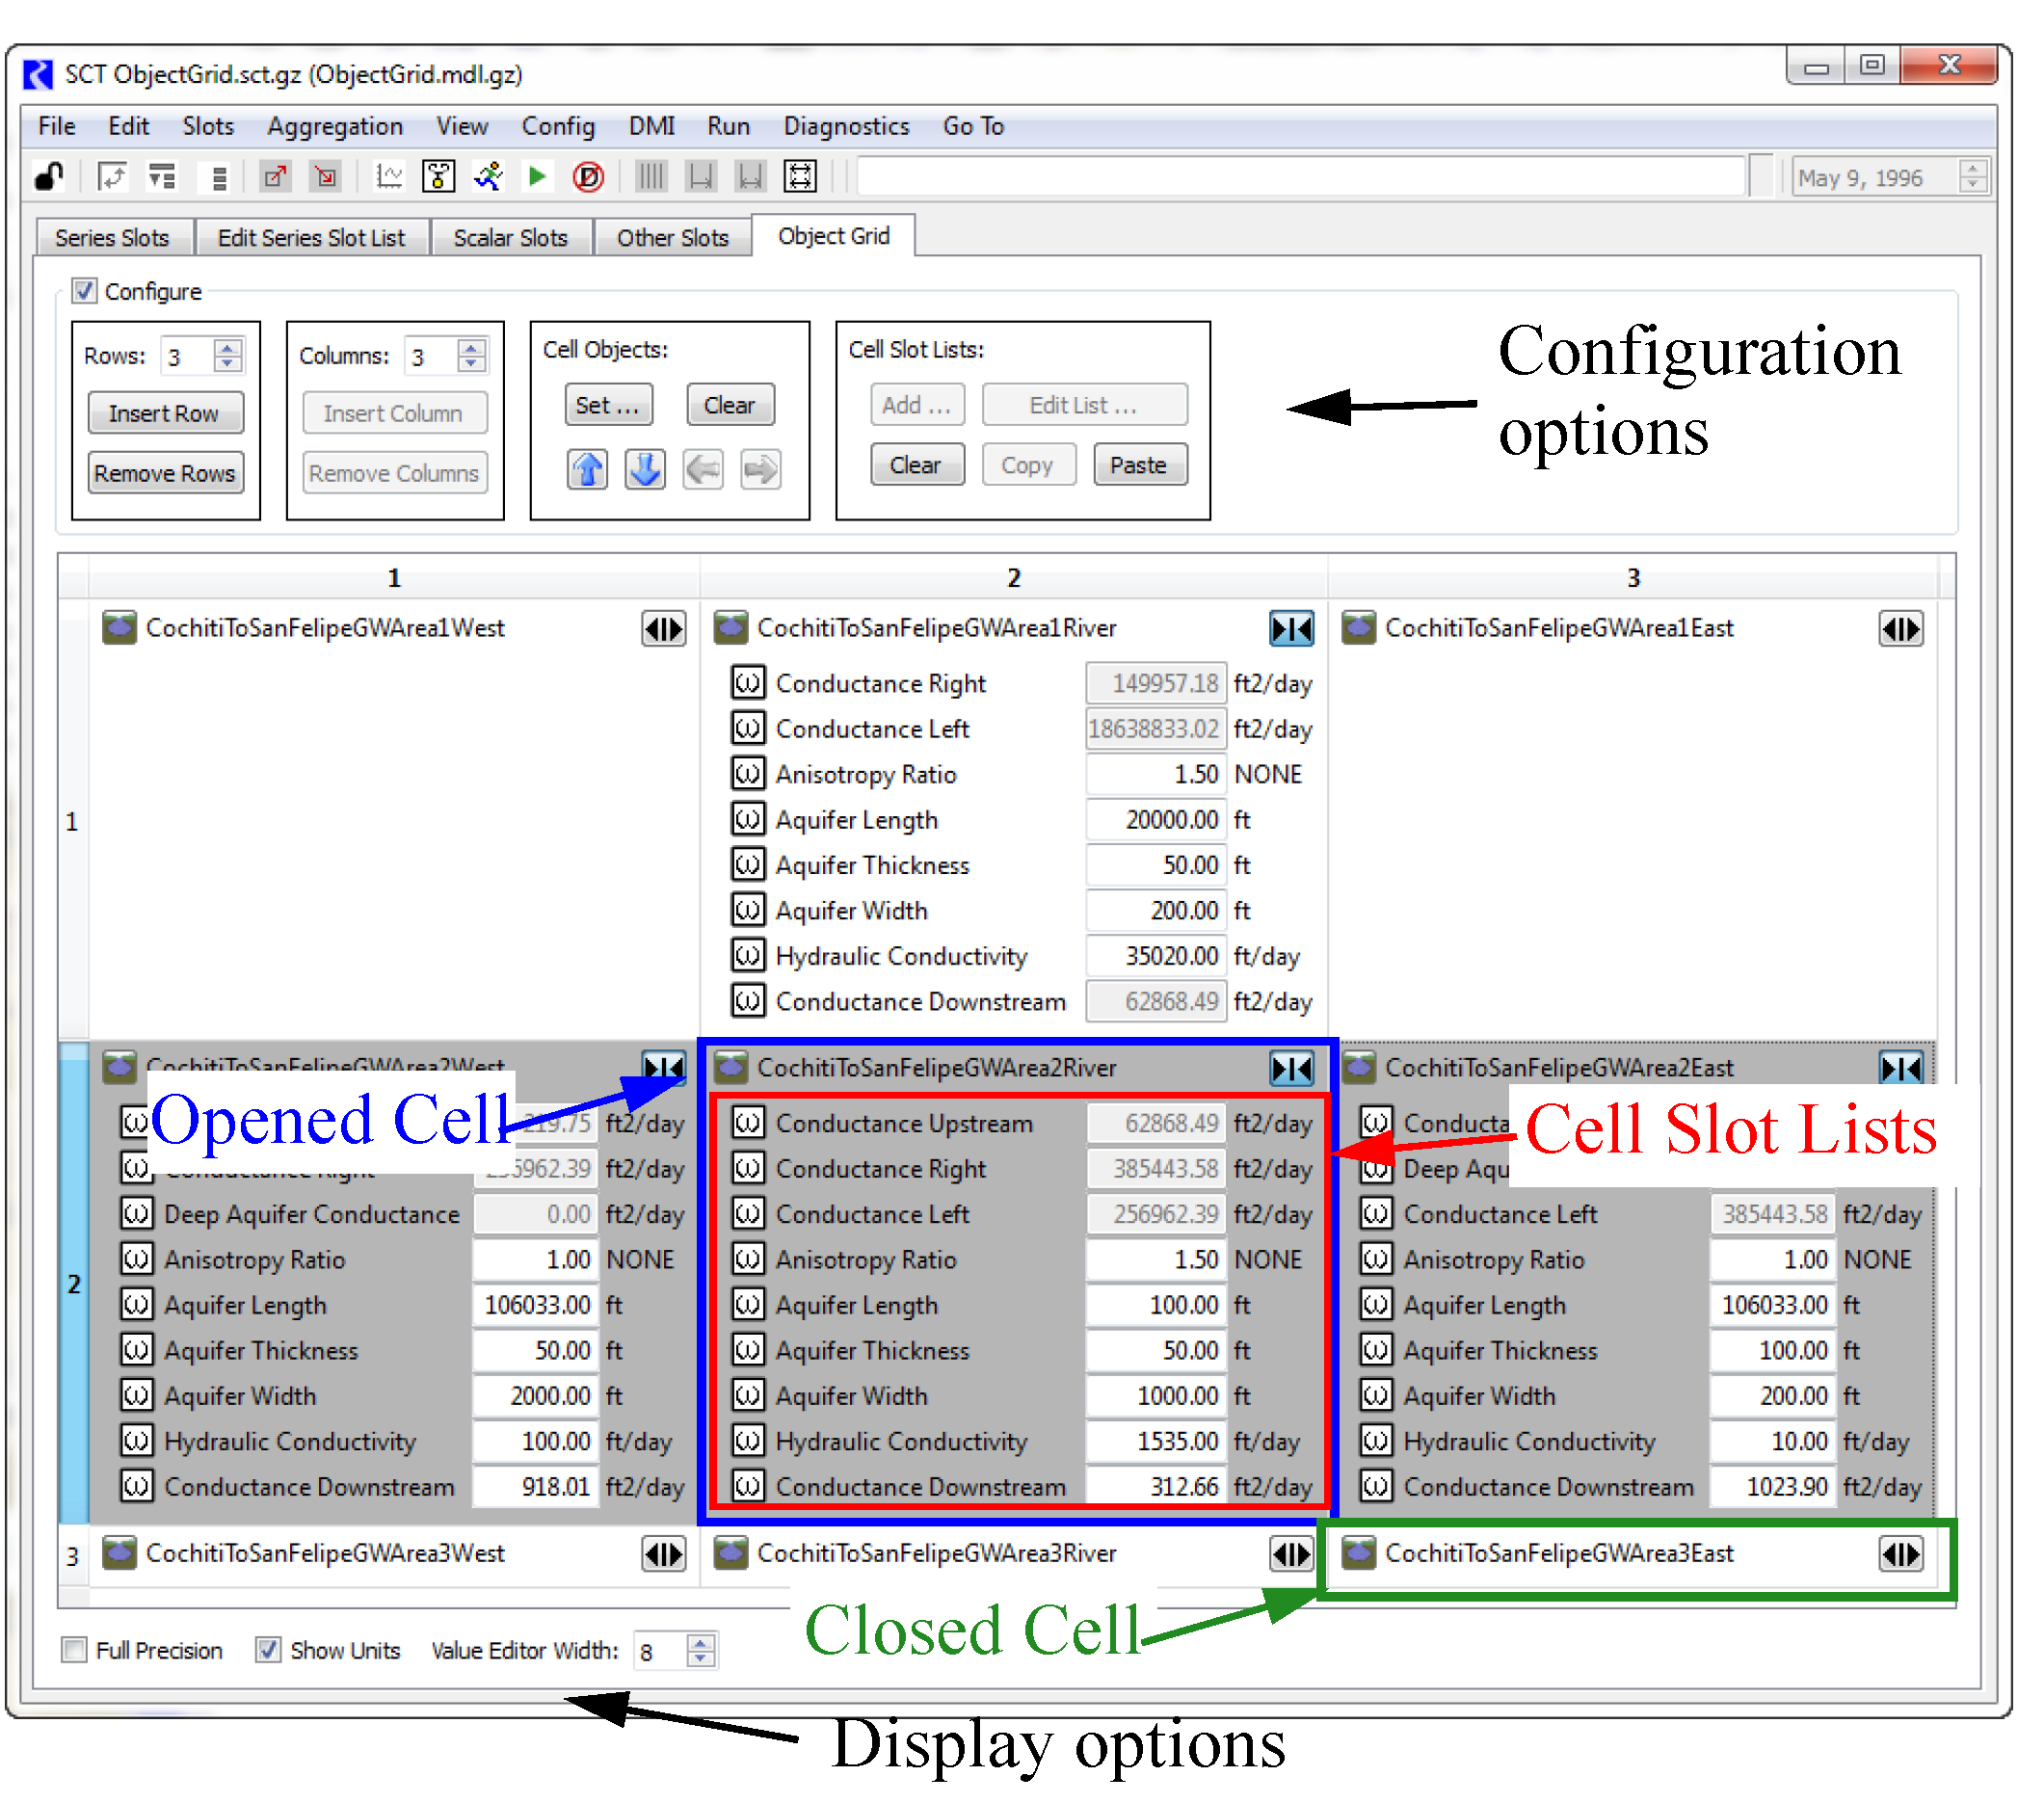
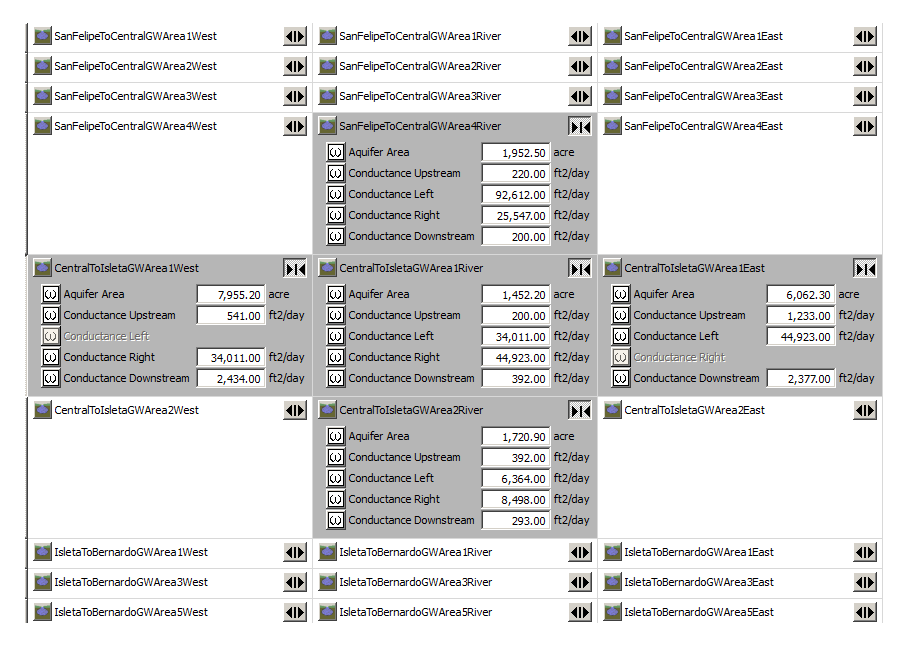
Object Grid Tab
The SCT Object Grid tab presents a user-configured grid of simulation objects. Each Cell represents one object. Scalar slots and single-cell table slots are displayed (and are directly editable) as a list of slots within the cell. These are referred to as Cell Slot Lists.
In the Object Grid, you can:
• Configure the number of rows and columns in the grid; insert rows and columns before a cell selection; and delete selected rows and columns.
• Assign existing simulation objects to individual grid cells.
• Move an arbitrary selection of defined cells up, down, left or right within the grid.
• Pick scalar and table slots from a cell’s simulation object to display in that cell.
• Show the open object dialog or open slot dialog for included objects or slots.
• Modify the composition and order of a cell’s slot list.
• Apply a cell’s slot list to an arbitrary selection of other defined cells. The target cells are configured with similarly-named slots on the cells’ simulation objects. Slots which don’t exist on the target cells’ objects are shown as inactive (grey).
• Show or hide the slot lists within an arbitrarily large cell selection.
• Directly modify the values of scalar slots and single-cell table slots.
• Display slot values with either configured precision or full precision; optionally show slot value units; and adjust the width of value editors.
• Export and import the whole object grid configuration to and from external files.
Very few of the SCT menu bar and toolbar controls operate on the object grid. Currently, the only SCT controls outside of the Object Grid tab that operate on the object grid are accessed by selecting View, then Fit Data Columns, to auto-adjust grid row and column sizes.
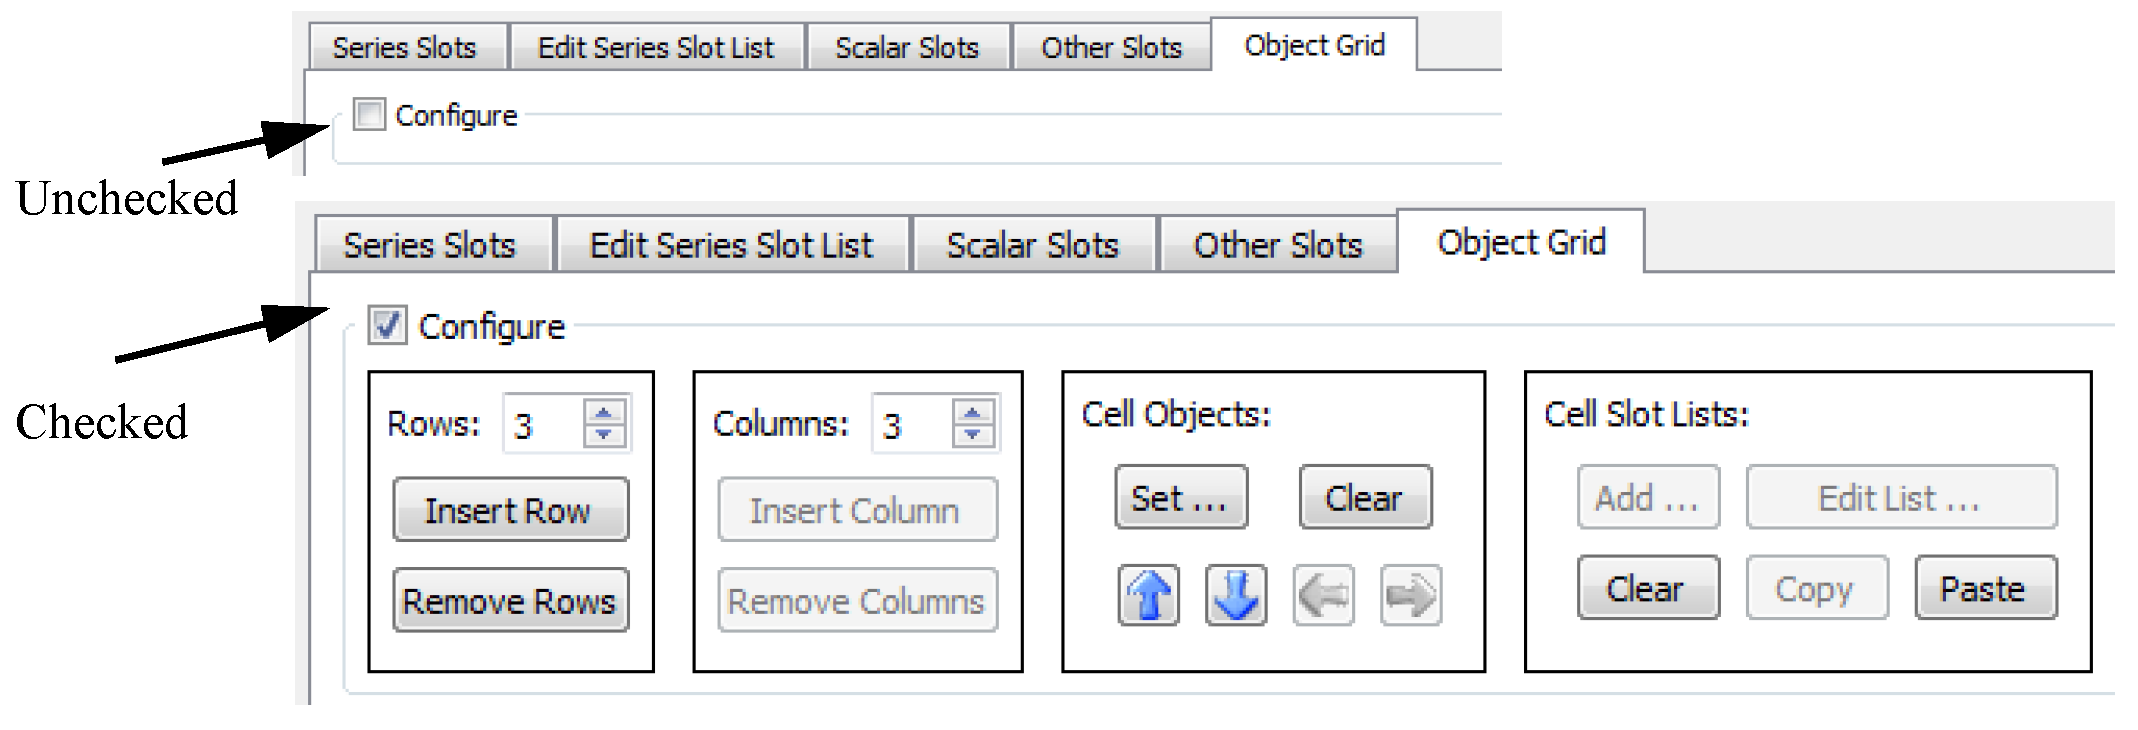
Object Grid Configuration
The configuration controls are enabled only if the SCT is unlocked, using the Lock Toggle button on the left side of the SCT toolbar). The primary configuration controls are optionally shown at the top of the object grid, based on the Configure group box checkbox.
Figure 8.13
Row and Column Configuration
Enter a value or use the selector controls to specify the number of rows and columns in the grid.
The Insert Row and Insert Column buttons are enabled when the cell selection is limited to a single row or a single column (including the case of just a single cell being selected). Use those operations to insert an empty row above, or an empty column to the left of the selected row or column.
The Remove Rows and Remove Columns buttons are enabled when whole rows or whole columns are selected (e.g. by selecting, or dragging along the row or column headers).
Note: When the number of rows or columns is reduced using the integer spinners, the cells are not deleted but are just visually excluded. Those cells can become visible again when the number of rows or columns is sufficiently increased. When the SCT configuration is saved, those out of range cells are dropped.
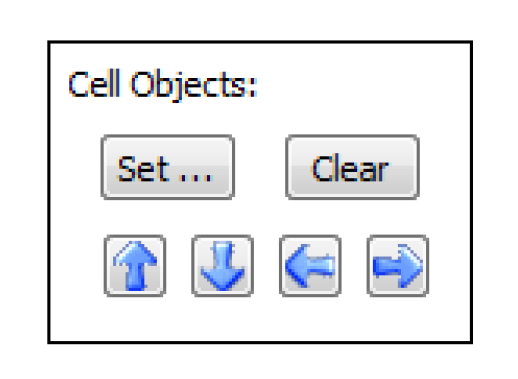
Cell Object Configuration
When one or more cells are selected, use the Cell Object Set button to open the Object selector. Each time the selector’s Apply button is selected, the chosen object is assigned to the first selected cell, and that cell is deselected. This allows the assignment of objects to multiple cells with a single invocation of the selector. The first selected cell is the topmost selected cell in the left-most column containing selected cells. (The assignment sequence proceeds downward in the left-most column until all selected cells in that column have been assigned objects).
It is valid to assign a particular simulation object to multiple distinct cells. Each of those cells could potentially show different slots from that object.
The Cell Object Clear button is enabled when one or more defined cells (having simulation objects) are selected. This operation removes the selected cells’ simulation object (and slots).
The four arrow buttons shift the set of selected cells one position in the indicated direction.

Cell Slot List Configuration
When the current cell selection contains at least one defined cell (having an associated simulation object), use the Cell Slot Lists controls to modify the slots shown for the cell(s). The Add, Edit List and Copy buttons are enabled only if exactly one defined cell is selected. The Clear and Paste buttons can be applied to multiple selected cells in a single operation.
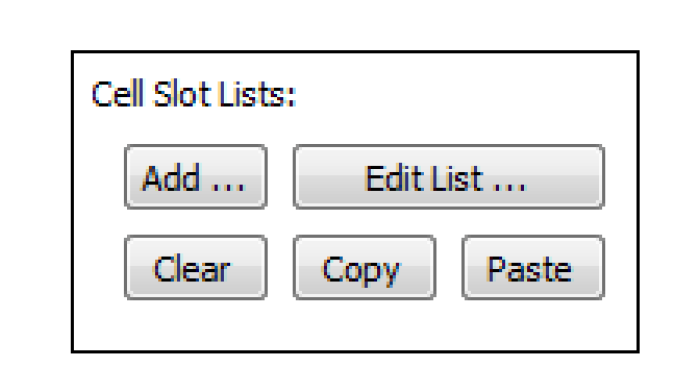
The Add (slots) button is actually a shortcut. Selecting it shows the Edit Object Cell Slot List dialog, as does the Edit List button, and automatically presses the More Slots button in that dialog to bring up the Slot Selector dialog.
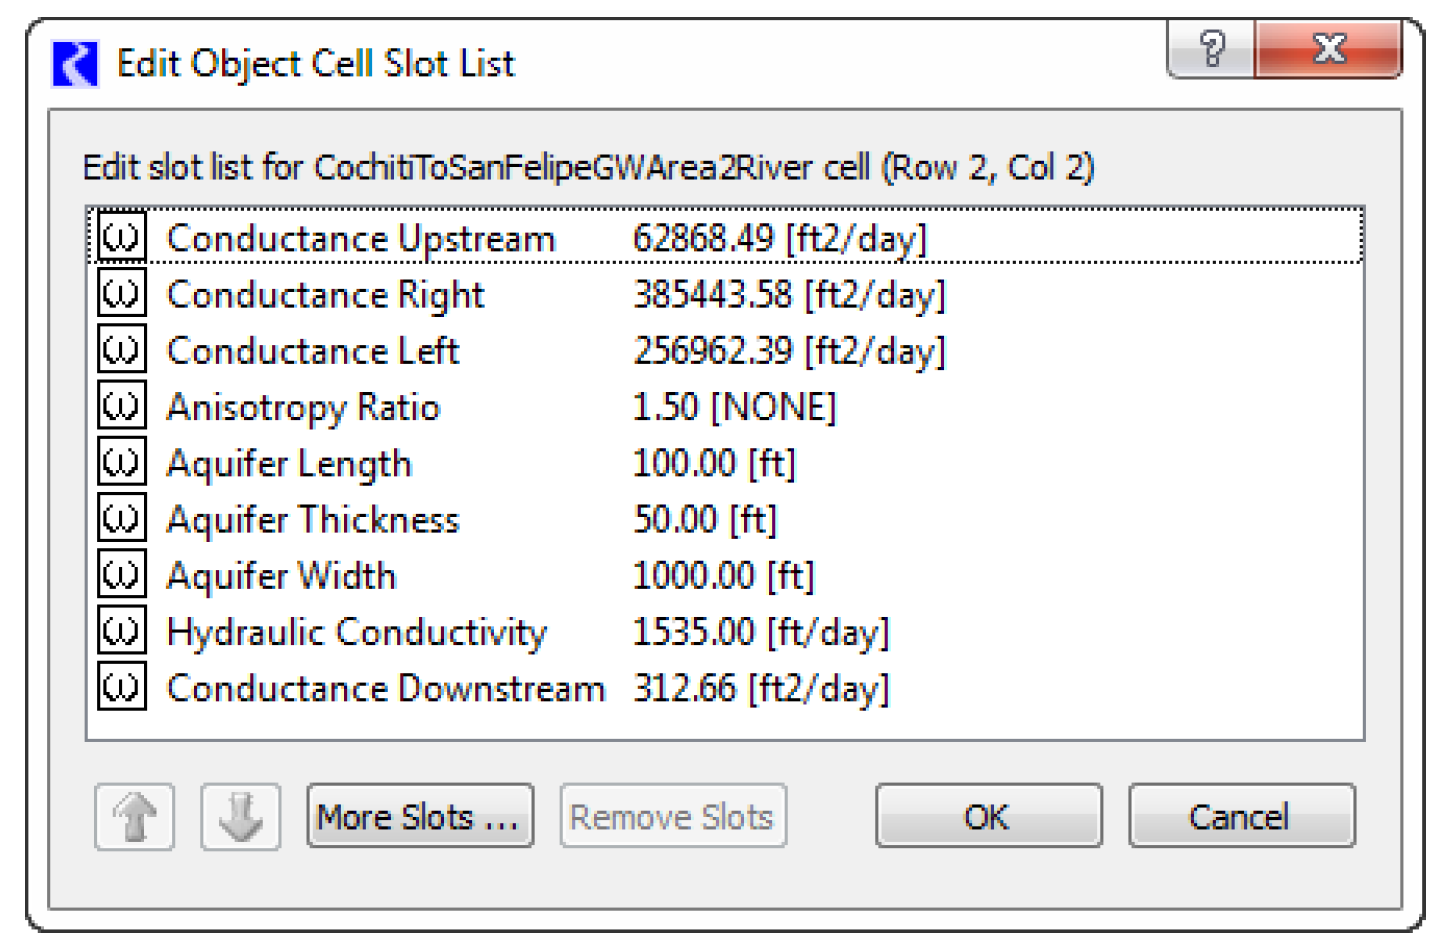
The Edit Object Cell Slot List dialog edits the list of slots for a single cell. As mentioned above, this dialog’s More Slots button brings up the Slot Selector to pick physical scalar and table slots (including periodic slots) on the cell’s simulation object.
The Remove Slots button and the Up and Down arrow buttons operate on the slots selected within the list.
Returning to the SCT object grid configuration controls, the Clear, Copy and Paste buttons operate on the set of selected defined cells.
• Clear removes the list of slots from that cell.
• The Copy button (enabled when a single defined cell is selected) copies the slot list to the Slot Clipboard.
• The Paste button opens a dialog showing the number of selected cells and the list of slots in the Slot Clipboard (see above). Selecting OK replaces the selected cells’ slot lists with the slot list from the Slot Clipboard.
Slots will appear in a cell in basically three different ways.
• Slots that don’t exist on the cell’s simulation object will be shown as disabled (dimmed).
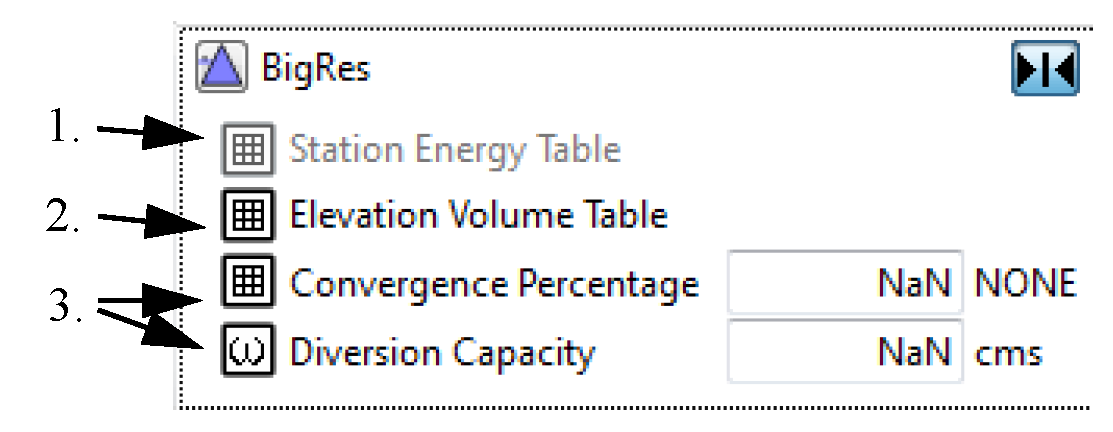
• Table slots having more than one cell will be shown with an active Slot icon button, but will not be shown with any numeric values.
• Scalar slots and single-cell table slots will be shown with an active Slot icon button and with an editable numeric value (and unit specification, if those are turned on in the dialog).
Cell Operations
Each cell has three different types of buttons:
• Object Icon buttons:  shows the Open Object dialog.
shows the Open Object dialog.• Slot Icon button: 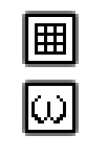 shows the Open Slot dialog. This button will not be enabled if such a slot doesn’t actually exist on the object.
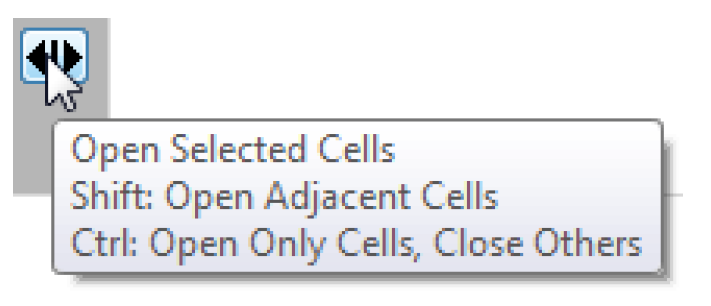
shows the Open Slot dialog. This button will not be enabled if such a slot doesn’t actually exist on the object.• Open / Close checkbox button. shows or hides the cell’s slots. This action is applied to all selected cells, not just the cell containing the button being selected.

To open and close multiple cells, you can drag the whole row or whole column to select it. Also all cells in the grid can be selected by selecting the square between the row and column headers in the upper-left corner of the grid.
Shift-Click and Ctrl-Click operation of the Open / Close button have special behaviors. Shift-Click opens up the selected cell and its four immediate neighbors. The Ctrl-Click operation also closes all other cells. A tooltip on the button reminds you of this feature.
Cell Context Menu
Right-clicking in a cell shows the context menu. All of the operations, except the last two, are redundant with buttons in the Configure panel above the grid.
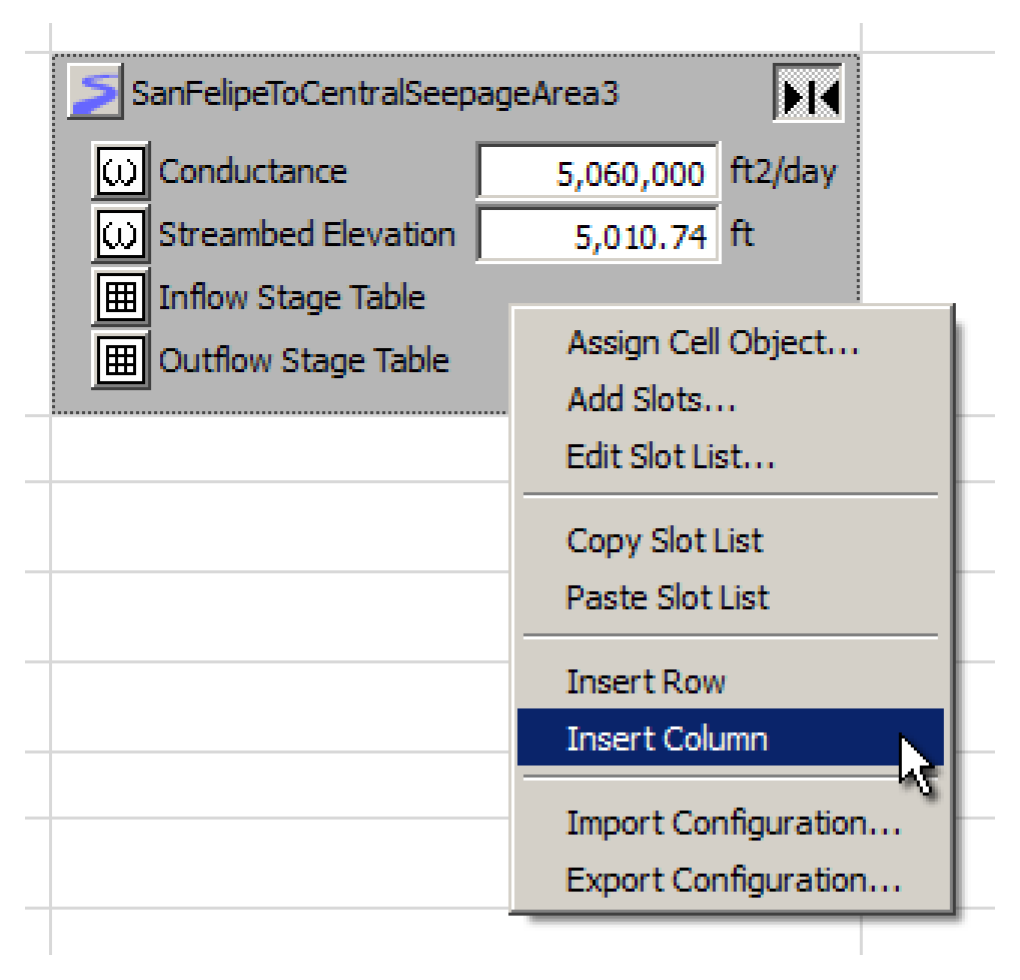
The Import Configuration and Export Configuration operations read or write the whole object grid’s configuration from, or to, an external file. (The file is an XML text file). This can be used for moving Object Grid configurations between different SCTs.
Selecting these two context menu items brings up a file selector for reading or writing, from which the you may cancel the operation. When importing, the current object grid configuration is entirely replaced with the imported configuration.
Display Settings
Use the controls along the bottom of the Object Grid to modify the data display.
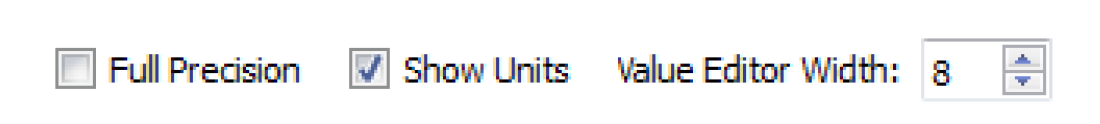
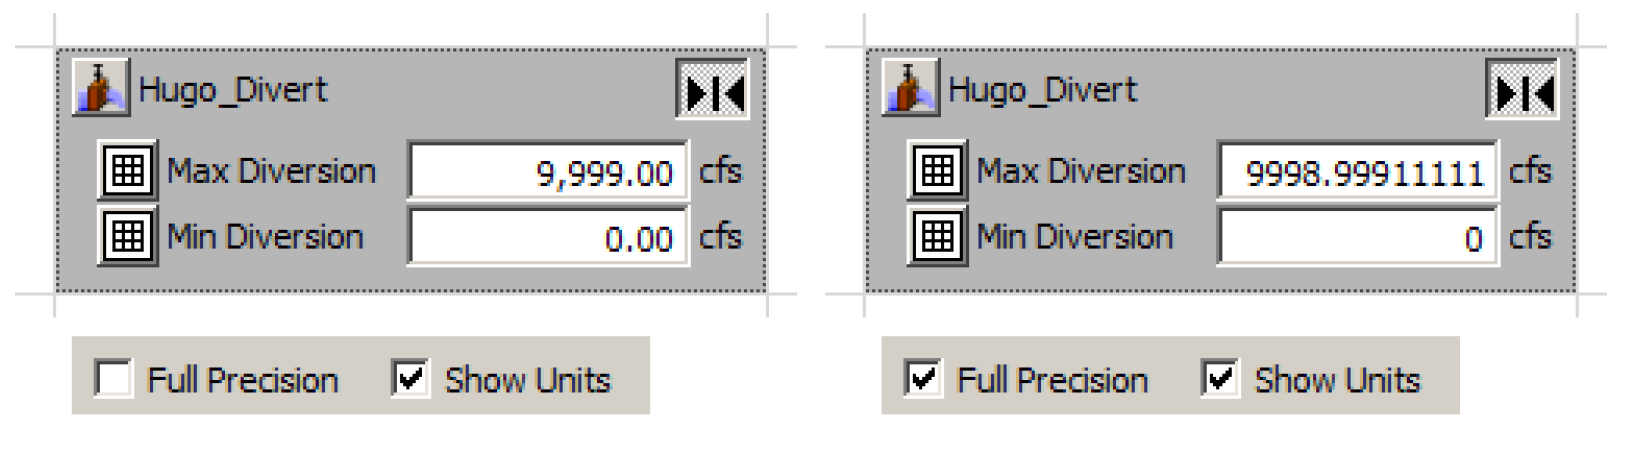
The Full Precision checkbox switches between configured display attributes (e.g. a particular number of fractional decimal digits) and full precision, showing the number of fractional digits necessary to precisely represent the internal floating-point numeric value. (Full Precision is also shown automatically when a cell value is edited).
Use the Show Units checkbox to show or hide the units. When units are hidden, they are available as a tooltip on the value editor.
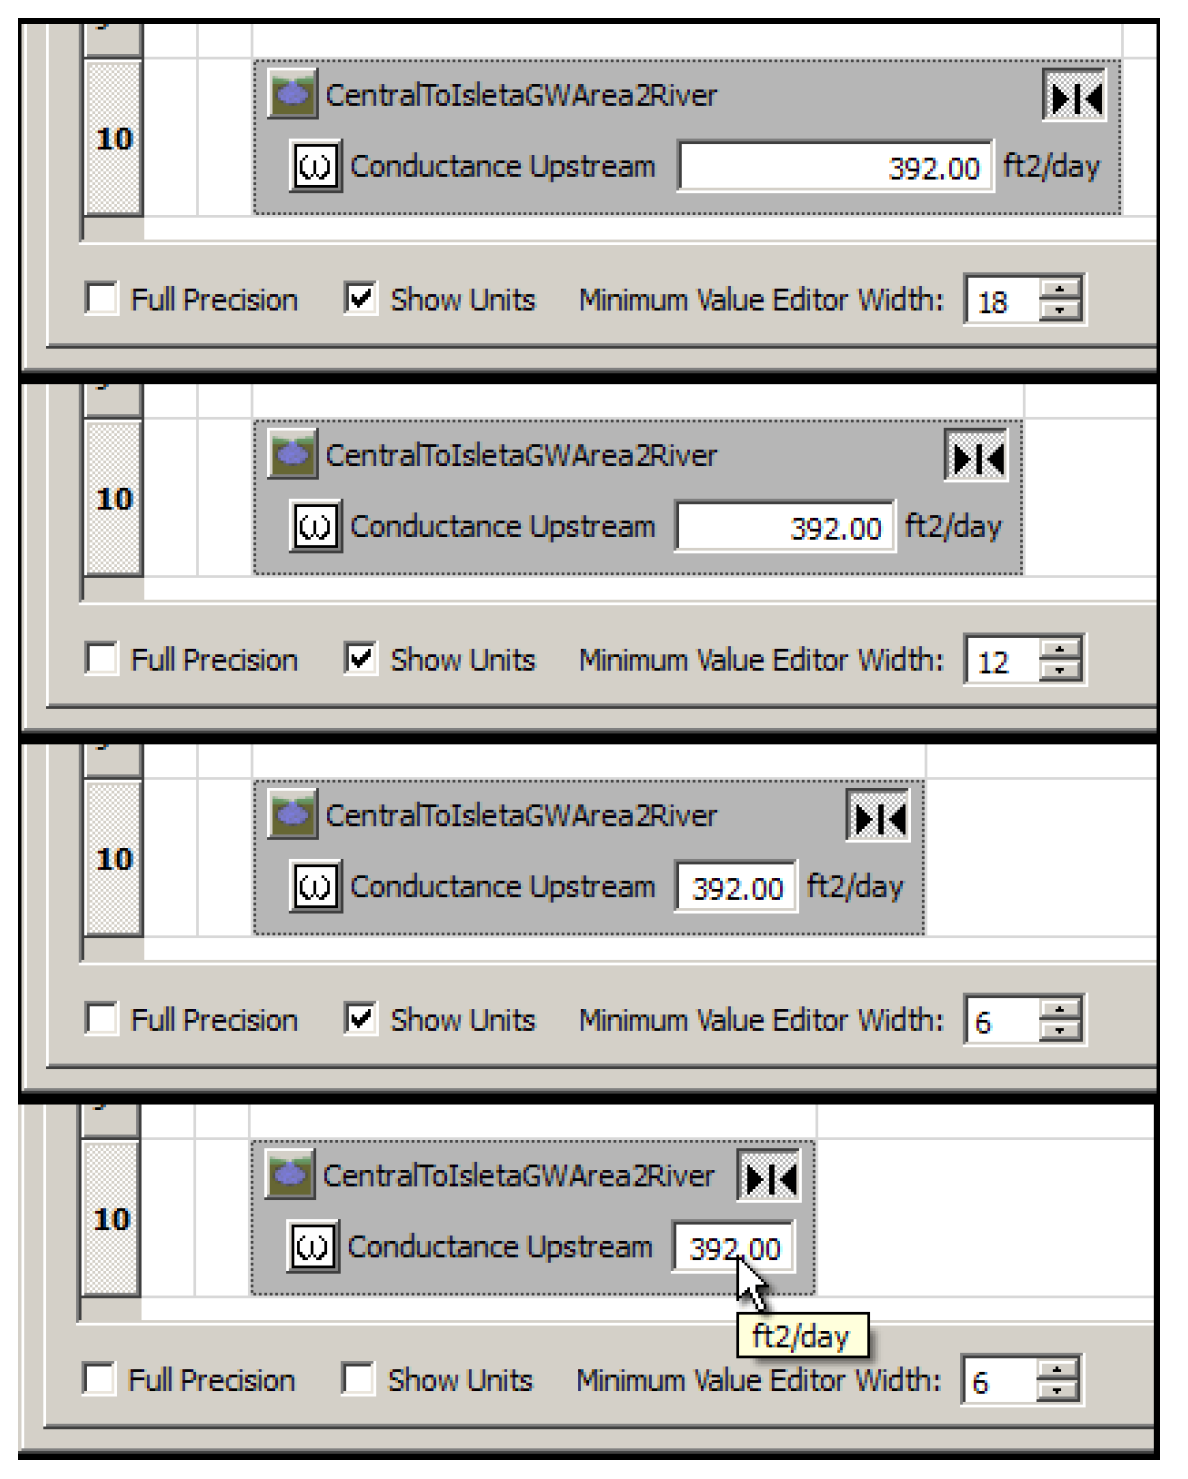
The Value Editor Width sets the width of slot value editors to ensure visibility of the specified number of characters. The supported range is 3 to 22. The default is 12.
How To Configure the SCT
Lock or Unlock the SCT Configuration
When the SCT is locked, the following components of the SCT configuration cannot be changed:
• Slots and slot dividers cannot be added, removed, or moved.
• Slot Labels and Horizontal Slot Divider Labels.
• Slots’ Summary Functions (for the aggregated views).
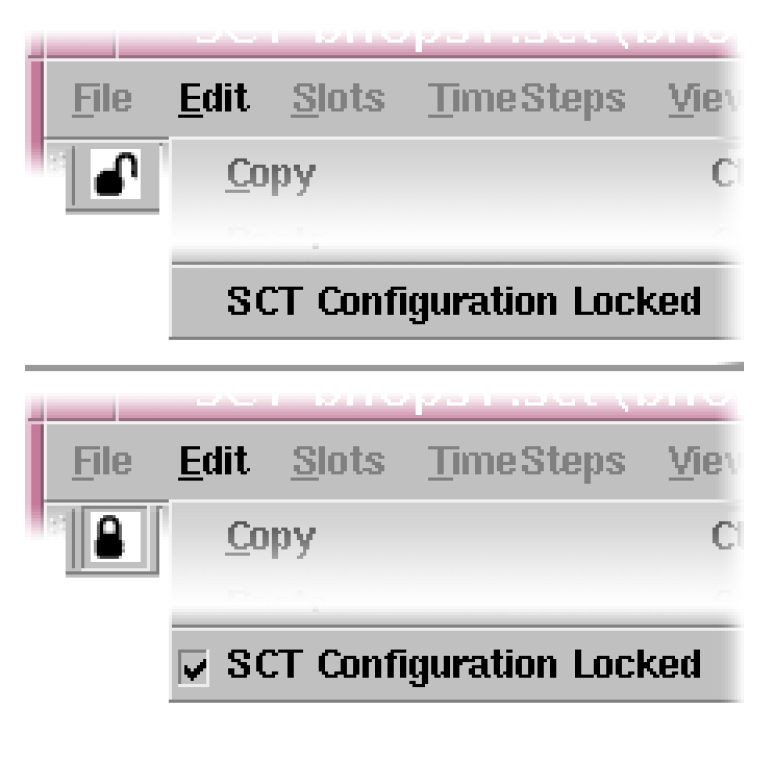
The SCT can be locked or unlocked by selecting the Toolbar Locked checkbox button or Edit, then SCT Configuration Locked. See “Edit Menu” for details.
Add Slots, Sheet Tabs, and Slot Dividers
To add slots or slot dividers, the SCT must be unlocked. See “Lock or Unlock the SCT Configuration” for details.
To add slots to an SCT, use one of the following actions:
• Slots, then Append Slots menu operation,
• Slots, then Insert Slots menu operation,
• Append Slots button on the two Slot List Tabs
• Append or Insert buttons on the Edit Series Slot List tab
• Right-click on the Edit Series Slot List tab and choose an option.
Only actual slots that exist in the currently loaded RiverWare model can be added to an SCT.
Through the RiverWare slot selector, you then select slots they want to add. Slots are added to all of the three panels using the slot Selector. See “Selector Features” for more information on the Selector. Slots of any type can be selected into an SCT. The selected slots (picked using the selector) are added to one of the three SCT Tabs, according to slot’s properties.
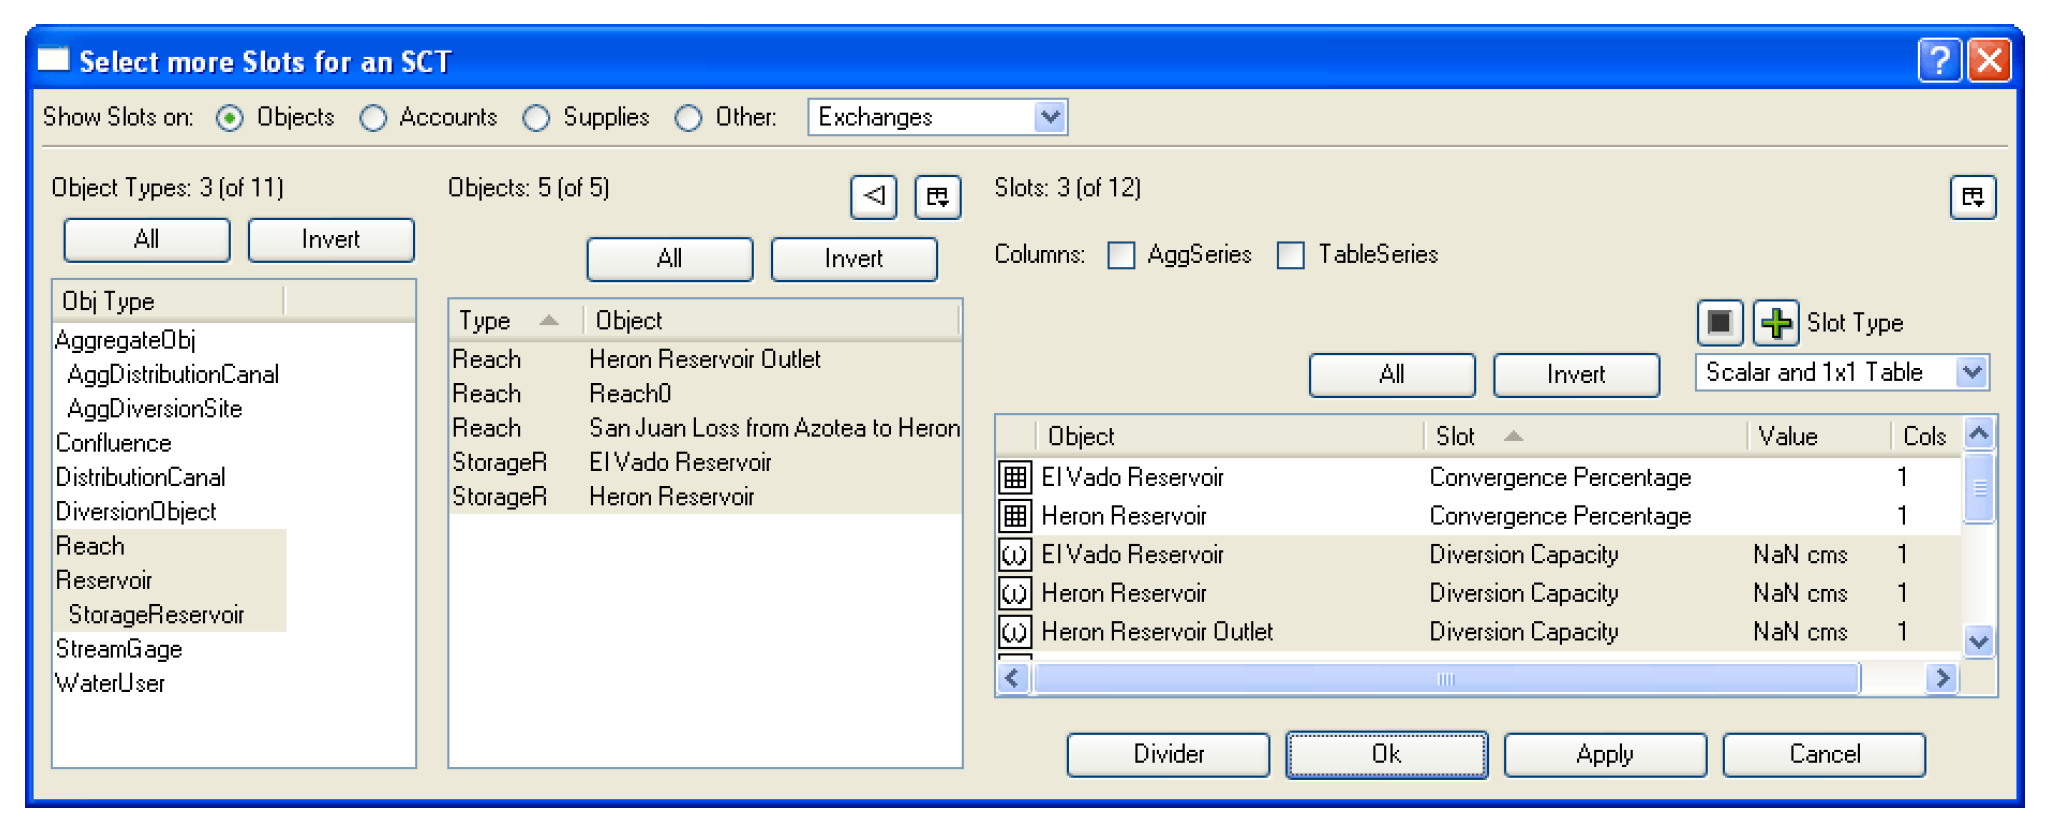
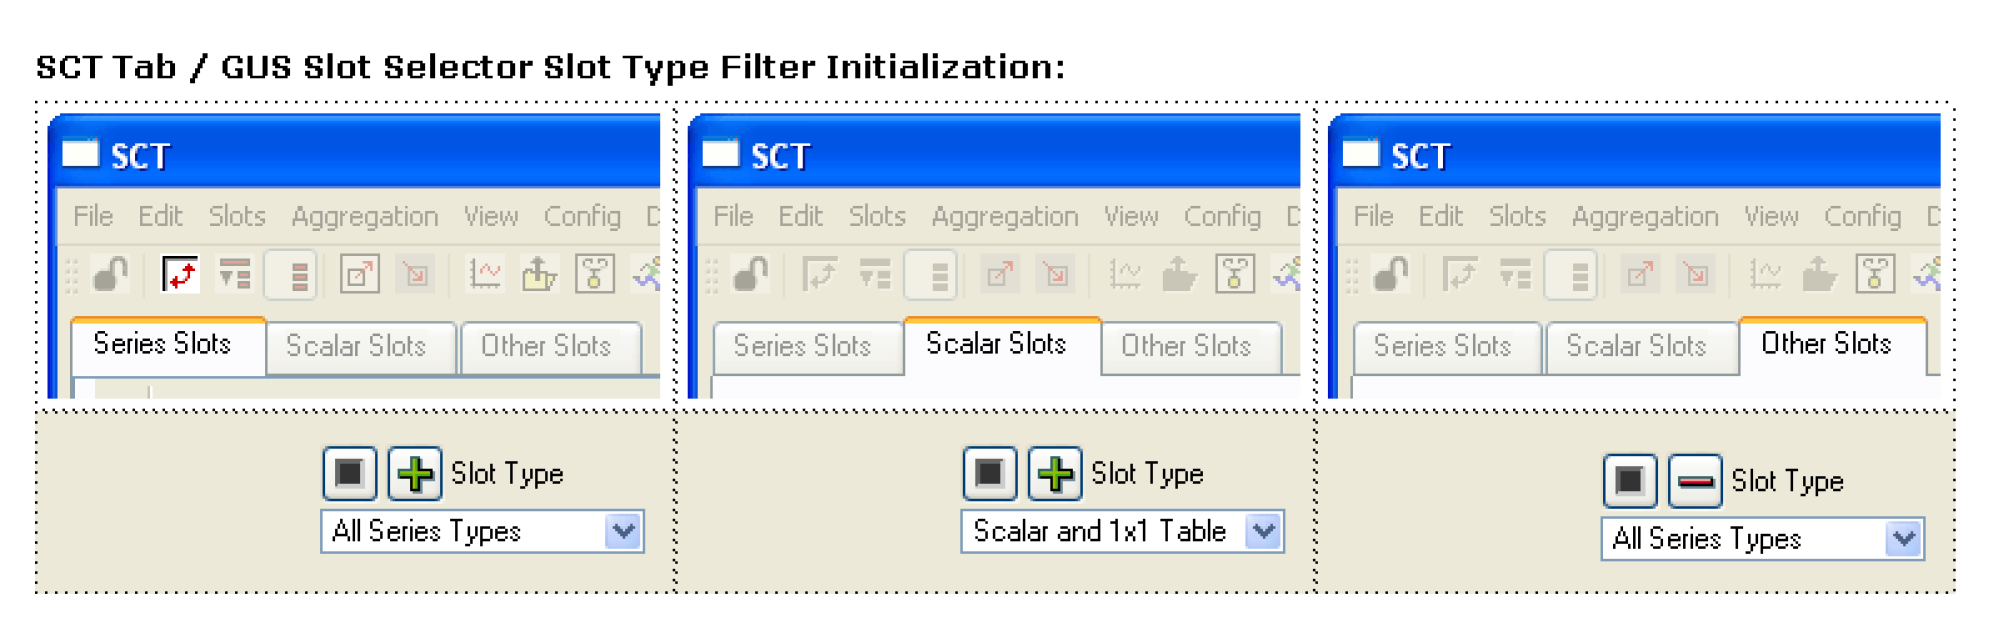
The SCT / Slot Selector Slot Type Filter is automatically configured for the current SCT tab. But, you can modify or dismiss the Slot Type Filter, and select any Slots. See the following image. The Slot Types filter can be used to filter by the desired type of the slot including
• The All Series Types filter value includes Table Series Slots. (Those are technically not Series Slots, but functionally, they pretty much are).
• A Scalar and 1x1 Table filter includes Scalar Slots and Table Slots which have exactly one row and one column. (Scalar Slots were added to RiverWare after some Simulation Objects had already implemented scalar values as 1x1 Table Slots).
Once a slot(s) is selected and either the Apply or Ok button is selected, the slot(s) will be added to the appropriate tab of the SCT, and that data tab will become active.
Slot Dividers can be added directly (not using the selector) using the menus.
• Slots, then Insert Slot Divider
• Slots, then Append Slot Divider
Add Sheet Dividers from the Edit Series Slot List tab; see “Edit Series Slot List Tab” for details.
Remove Slots and Slot Dividers
To remove slots or slot dividers, the SCT must be unlocked. See “Lock or Unlock the SCT Configuration” for details.
Select Slots, then Remove Slots / Dividers to remove the selected slots from the SCT. See “Slots Menu”.
Note: Removing a slot from the SCT neither removes it from the RiverWare model nor affects the slot’s data.
Slots can be removed from the SCT Slot List tab by selecting one or more slot items in the list and selecting the Remove button or using the right-click context menu.
Move Slots and Slot Dividers
To move slots or slot dividers, the SCT must be unlocked. See “Lock or Unlock the SCT Configuration” for details.
Series slots can easily be moved from the Edit Series Slot List tab; see “Edit Series Slot List Tab” for details.
Also, slots and slot dividers can be copied, cut, and pasted (inserted or appended) within an SCT or between SCTs (within the same model). The data copy and paste operations (under the SCT Edit menu) are not related to the slot and slot divider moving operations. Instead, the following operations on the SCT Slots menu are used. See “Slots Menu” for details.
• Slots, then Copy Slots / Dividers. At least one slot item must be selected.
• Slots, then Cut Slots / Dividers. At least one slot item must be selected.
• Slots, then Insert Copied Slots / Divs. Exactly one slot item must be selected.
• Slots, then Append Copied Slots / Divs. No particular selection is required.
Note: Copy Slots / Dividers and Cut Slots / Dividers also add the selected slots to the RiverWare Slot Clipboard. Slots in the Slot Clipboard can be copied to other locations in RiverWare such as any Output Device’s slot list.
The Insert Copied Slots / Divs operation inserts the previously copied or cut slot items immediately before the single selected slot item.
The Append Copied Slots / Divs operation appends the previously copied or cut slot items to the end of the SCT slot item list, after the last slot row or after the last slot column, depending on the axis orientation. See “Axis Orientation” for details.
The cell ornamentation (crosshatch) displayed on the copy data cell set also applies to the Copy Slots / Dividers operation.
There is no problem with having a slot represented redundantly within an SCT (e.g., as a result of inserting or appending a slot reference into the same SCT from which it was copied). You may want to do this is to see two or more distinct Summary Functions (e.g., Sum and Average) for aggregates of a particular slot. See “Summary Functions” for details.
Create a new SCT from a Series Sheet tab
When you have multiple Series Sheets, you may want to look at more than one sheet at a time. This functionality is supported by tearing off a Series Sheet to create a new SCT. You can then see both SCTs at once. This operation is performed as follows:
On the Series Slots tab, right-click on the sheet tab and choose Show Sheet in New SCT The sheet is now shown in its own SCT.
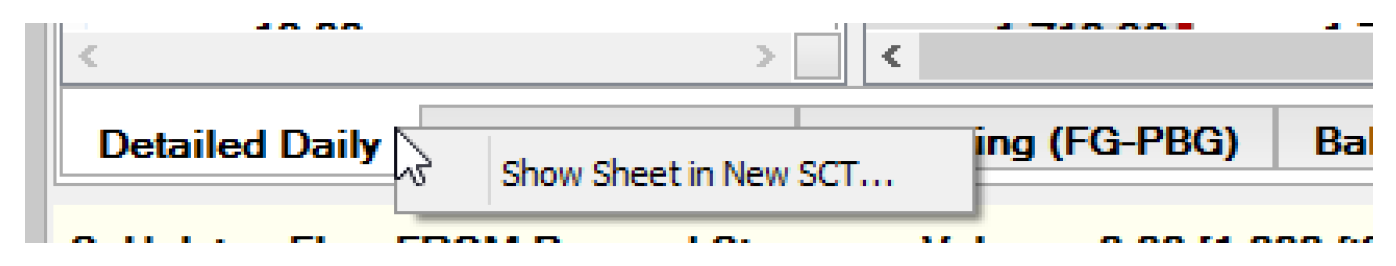
Note: This operation does not remove the sheet from the original SCT. It just creates a copy of the sheet in a new SCT. You can decide to close or save that new SCT when finished.
Change a Slot’s Summary Function
See “Timestep Aggregation” and “Summary Functions” for details about Summary Functions.
To change a slot’s Summary Function, the SCT must be unlocked. See “Lock or Unlock the SCT Configuration” for details.
There are three ways to change Summary Functions. The first changes the summary functions of all slots in the SCT, the second two ways are for individual slots. If you wish to set most of the slots to use one summary functions, use the Set SCT Aggregation Summary Functions first, then change other specific slots as needed.
1. From the SCT, select the Aggregation, then Set Summary Functions menu to open the Set SCT Aggregation Summary Functions dialog.
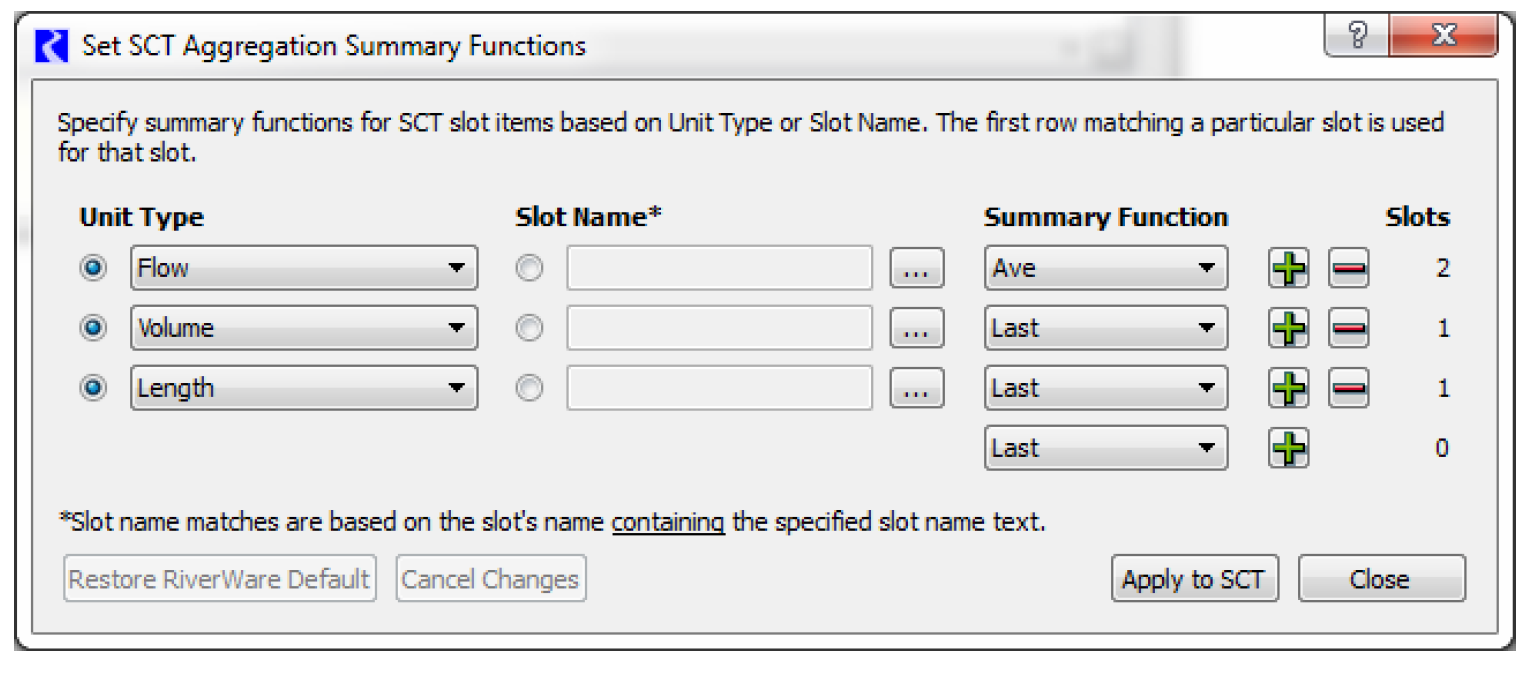
This dialog allows you to specify the Summary Function for all slots in the SCT based on the unit type or the slot name. You create rows that match one or more slots and then select the Summary Function for that row.
2. Select the Unit Type checkbox or the Slot Name checkbox to specify which component you wish to use:
• Unit Type. Select the desired type from the pull down menu.
• Slot Name. Enter all or part of a slot name in the text box or use the  button to select a slot name using the selector. As indicated in the note, the entered text must be contained in the Slot’s name for a match to occur.
button to select a slot name using the selector. As indicated in the note, the entered text must be contained in the Slot’s name for a match to occur. 3. Use the Summary Function to choose one of the items, First, Last; see “Summary Functions” for details. Add or remove rows from the dialog using the  and
and  buttons.
and buttons. The number of slots matched for each row is displayed in the last column.
The first matching row is used for the slot, so the order of the rows may matter. For example, in Figure 8.14, Pool Elevation is the first row using Med, and Length is the last row using Last. Thus, all Pool Elevations in the SCT will use the Med function for aggregation.
Figure 8.14
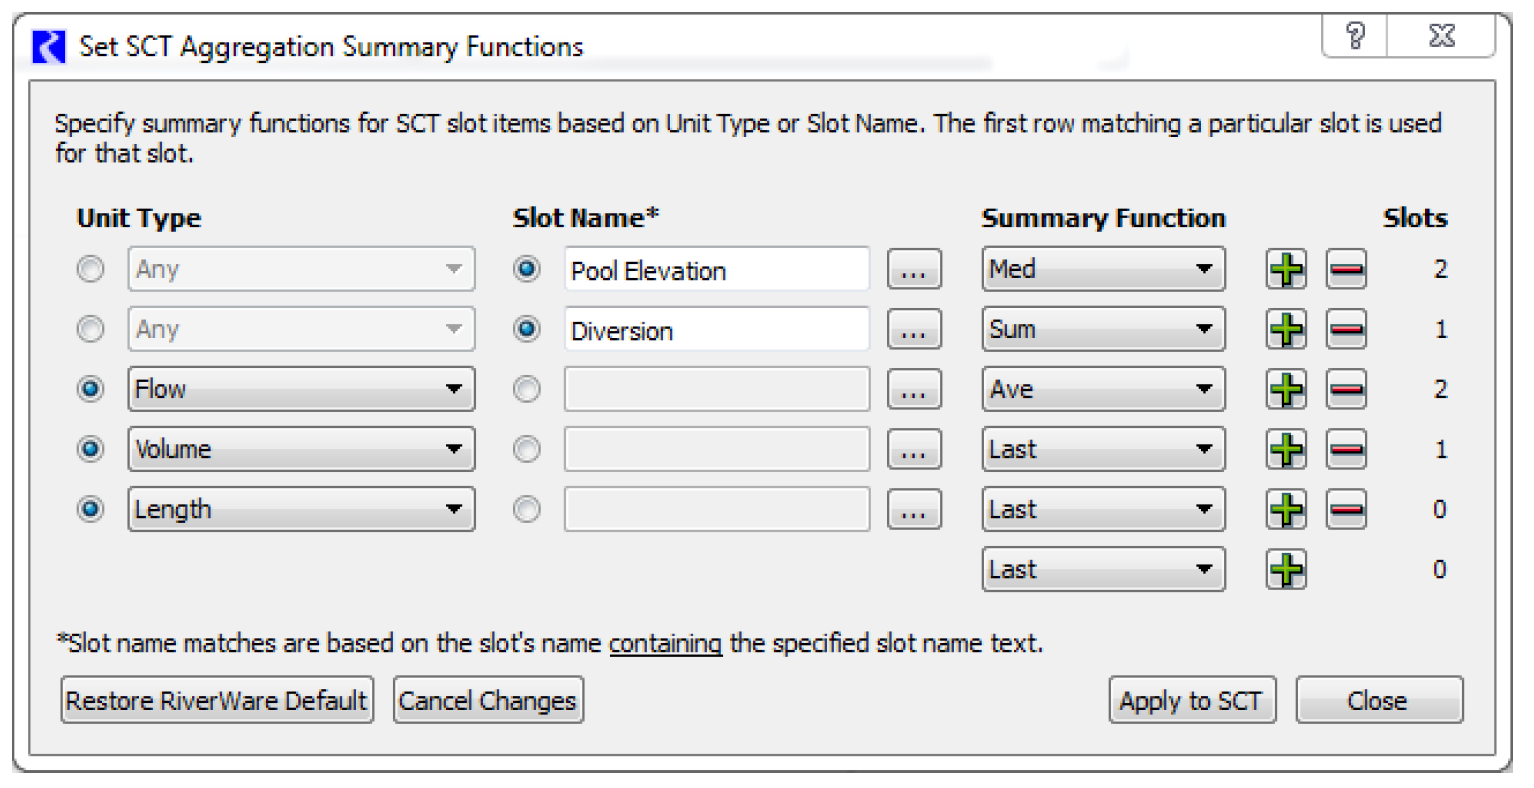
When you choose the Apply to SCT button, the matched slots are given the appropriate summary function.
4. Use the Restore RiverWare Default to return the dialog to its original state, that is, one row for Flow using the Ave function, one row for Volume using the Last function, and one row for Length using the Last function. There is a final catch-all row that uses the Last function as the default.
5. In the Aggregated Horizontal Timestep Axis View, if the Summary Function column in the Row Header Table is shown, you can double-click in the slot’s Summary Function field to show an option menu with the available Summary Function choices. See “Horizontal Timestep Axis Orientation” and “Horizontal Time Tab” for details.
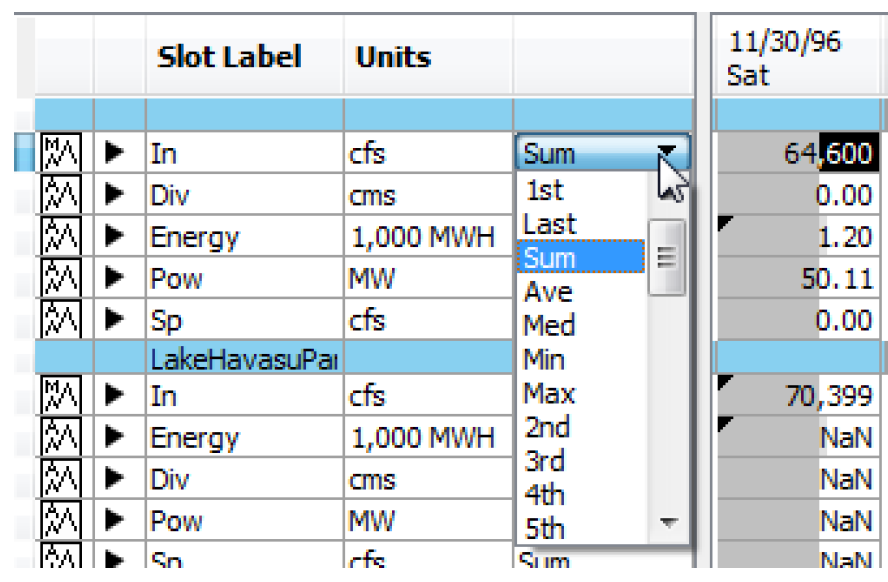
See “Configure Row and Column Headers” for details on showing the Summary Function column in the Aggregated Horizontal Timestep Axis View.
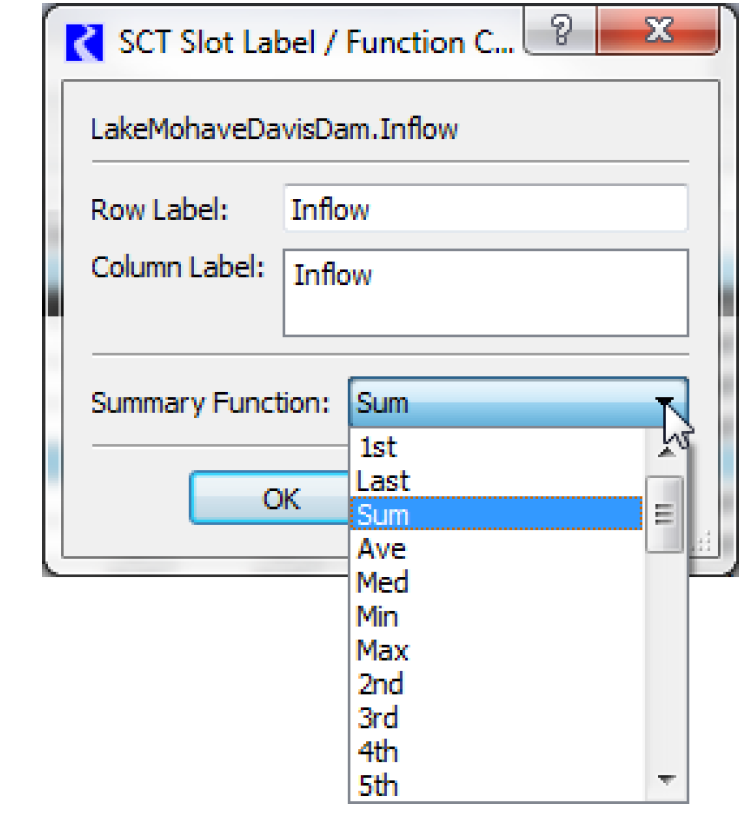
A slot’s Summary Function can also be changed by selecting a single slot and then selecting Slots, then Set Label/Function. See “Slots Menu”. In the dialog, you can select a different option from the Summary Function menu.
Show or Hide (Aggregation) Summaries
See “Show or Hide (Aggregation) Summaries” and “Timestep Aggregation” for details.
Summary cells always display the aggregated data. To display or hide summaries, you can switch to the appropriate view in either of these ways:
Select one of the detail modes from the SCT Aggregation menu, or use the following toolbar buttons:
• Show/Hide Details
• Hide All Details
• Show All Details
• No Aggregation
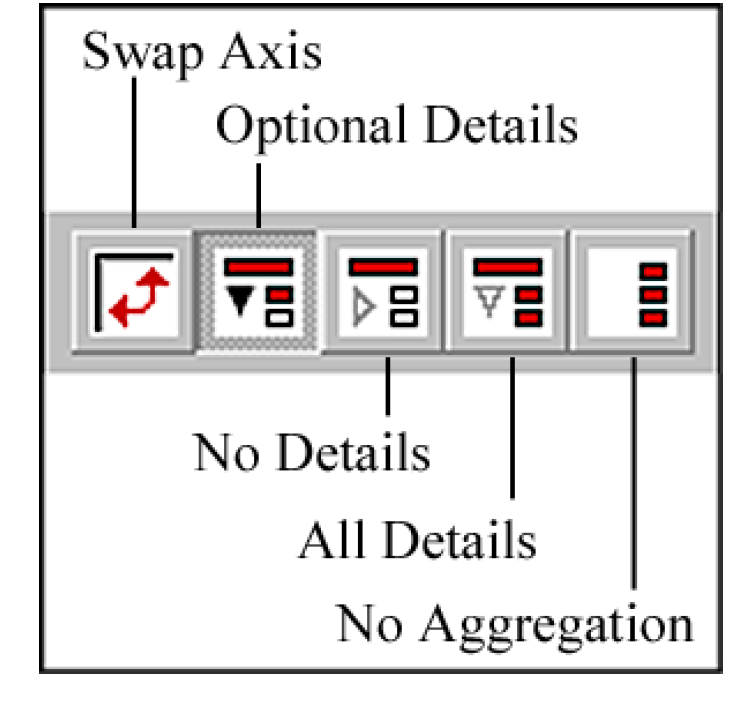
Show or Hide Details
See “Show or Hide (Aggregation) Summaries” and “Timestep Aggregation” for details.
You can display all details by selecting the No Aggregation detail mode either from the Aggregation menu, or by accessing the detail mode toolbar buttons (see “Show or Hide (Aggregation) Summaries” for details).
In the Aggregated Horizontal Timestep Axis Orientation View, each summary row corresponds to one slot. Therefore, showing or hiding the details for a single summary row displays or hides the details for one slot.
In the Aggregated Vertical Timestep Axis Orientation View, each summary row corresponds to one timestep aggregation. The detail rows under a summary row represent the individual timesteps within each timestep aggregation. Details for a single summary row that corresponds to one timestep aggregation across all slots (where each slot is in a separate column).
In the aggregated views in Show/Hide Details (Optional Details) detail mode, you can display or hide details (detail cells) independently for each summary row in the following three ways:
• by using a treeview control (rightward or downward pointing triangle) on the left side of a summary row.
• by entering Ctrl+D when one or more cells are selected. This sets the detail open/closed state to the opposite of the first slot or timestep aggregation represented in the cell selection.
Note: In this detail mode, you can display or hide all details by selecting a whole column and entering Ctrl+D.
• If the following checkbox on the General tab of the Configuration Dialog is on, then double-clicking in a cell alternates the detail open/closed state corresponding to the cell. (If this checkbox is deselected, then double-clicking in a data cell starts an in-cell modify-edit operation for the value in that data cell). See “General Tab” for details.
[x] Double Click Data Cell Toggles Detail Rows
You can display or hide all details (detail cells) by selecting the Show All Details or Hide All Details detail modes from the SCT Aggregation menu, or by accessing the corresponding toolbar buttons. Selecting these modes does not affect the individual summary row detail open/closed states in the Show/Hide Details detail mode.
Configure Row and Column Headers
Since the correspondence between slots and times with rows and columns depends on the axis orientation, the types of information that can be shown in row and column headers depends primarily on the selected axis orientation. See “Axis Orientation” for details.
The visibility of certain row header columns and types of information in data column headers is controlled separately for the two axis orientations through the use of two corresponding tabbed panes in the Configuration Dialog.
In the Horizontal Timestep Axis Orientation only, where rows correspond to slots, the following two in-cell edit operations are supported when the SCT is unlocked (see “Lock or Unlock the SCT Configuration” for details):
• Editing a slot row label (by double-clicking).
• Changing a slot’s summary function by double-clicking on the slot’s summary function—if the Summary Function column is displayed (see “Change a Slot’s Summary Function” for details). Since summary functions are relevant only for the aggregated views, this application is available only in the Aggregated (Horizontal) view.
Adjust Column Widths
You can manually resize columns by dragging the dividers between the column headers. The following operations are also available in the SCT View menu. See “View Menu” for details.
• View, then Set Data Column Widths is used to set all data columns to the width of the single selected column. The best way to use this is to follow these steps:
– Manually resize one of the data columns to the desired width by dragging the column header divider on the right side of the column.
– Select the column by selecting the middle of its column header.
– Select View, then Set Data Column Widths. This resizes all of the data columns to the width of the selected column.
This function, which is active when a single column is selected, applies to columns on all Sheet tabs, This operation sets the width of all columns to that of the selected column.
• View, then Fit Data Columns to Headers resizes all of the data columns to fit the text in the corresponding column headers.
• View, then Grow Columns to Data resizes all of the data columns to fit the numeric values in the corresponding column.
• View, then Fit Columns to Data resizes all of the data columns to fit the widest numeric value displayed in the corresponding columns.
• View, then Fit Data Columns Both resizes all of the data columns to fit the widest heading or numeric value displayed in the corresponding columns.
• View, then Fit Row Header Column resizes the columns in the Row Header Table to fit the widest content in the corresponding columns. This operation also adjusts the splitter between the Row Header Table and the SCT Data Table to fit the Row Header Table exactly.
Many, though not all, of the column width adjustments are preserved when you save and reload an SCT.
Change SCT Flag and Other Colors
You can modify colors by selecting the Flags tab or the Color tab of the SCT Configuration Dialog. See “Flags Tab” and “Color Tab” for details.
1. From the SCT Menu, select Config, then Flags or Colors.
2. Specify the colors to modify, as follows:
– Select the Flags tab to modify flag colors.
– Select the Color tab to modify other colors.
3. Selecting one of the color buttons brings up a Color Chooser where you can change only one color at a time.
See “Use the Default Configuration” for details on saving the new settings as default, or restoring the default color settings.
Apply Custom Colors to Slot/Timestep Cells
To apply custom colors to selected cells, named custom colors must be first defined and configured; see “Custom Cell Colors”. for details. Then perform the following steps to apply the colors:
1. Select the desired cells on the Series Slots tab.
2. Use the right-click context menu and choose Apply Custom Colors, then select the desired named color item.
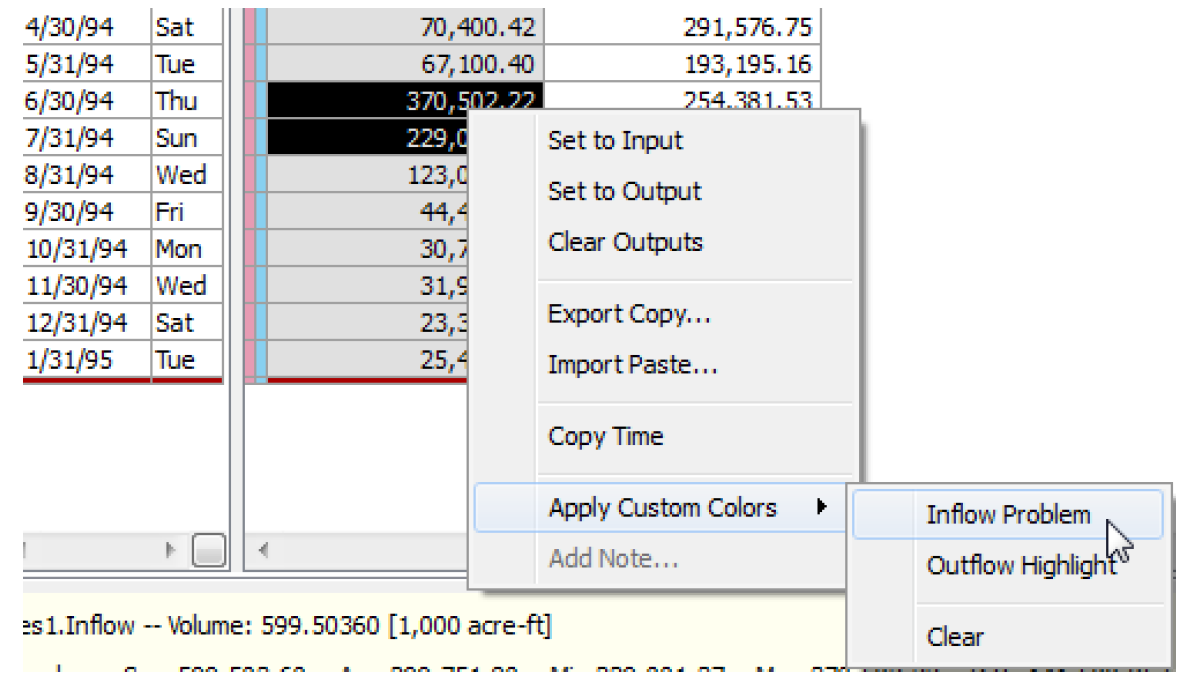
Figure 8.15 shows a color definition and the colors applied to cells in the SCT.
Figure 8.15
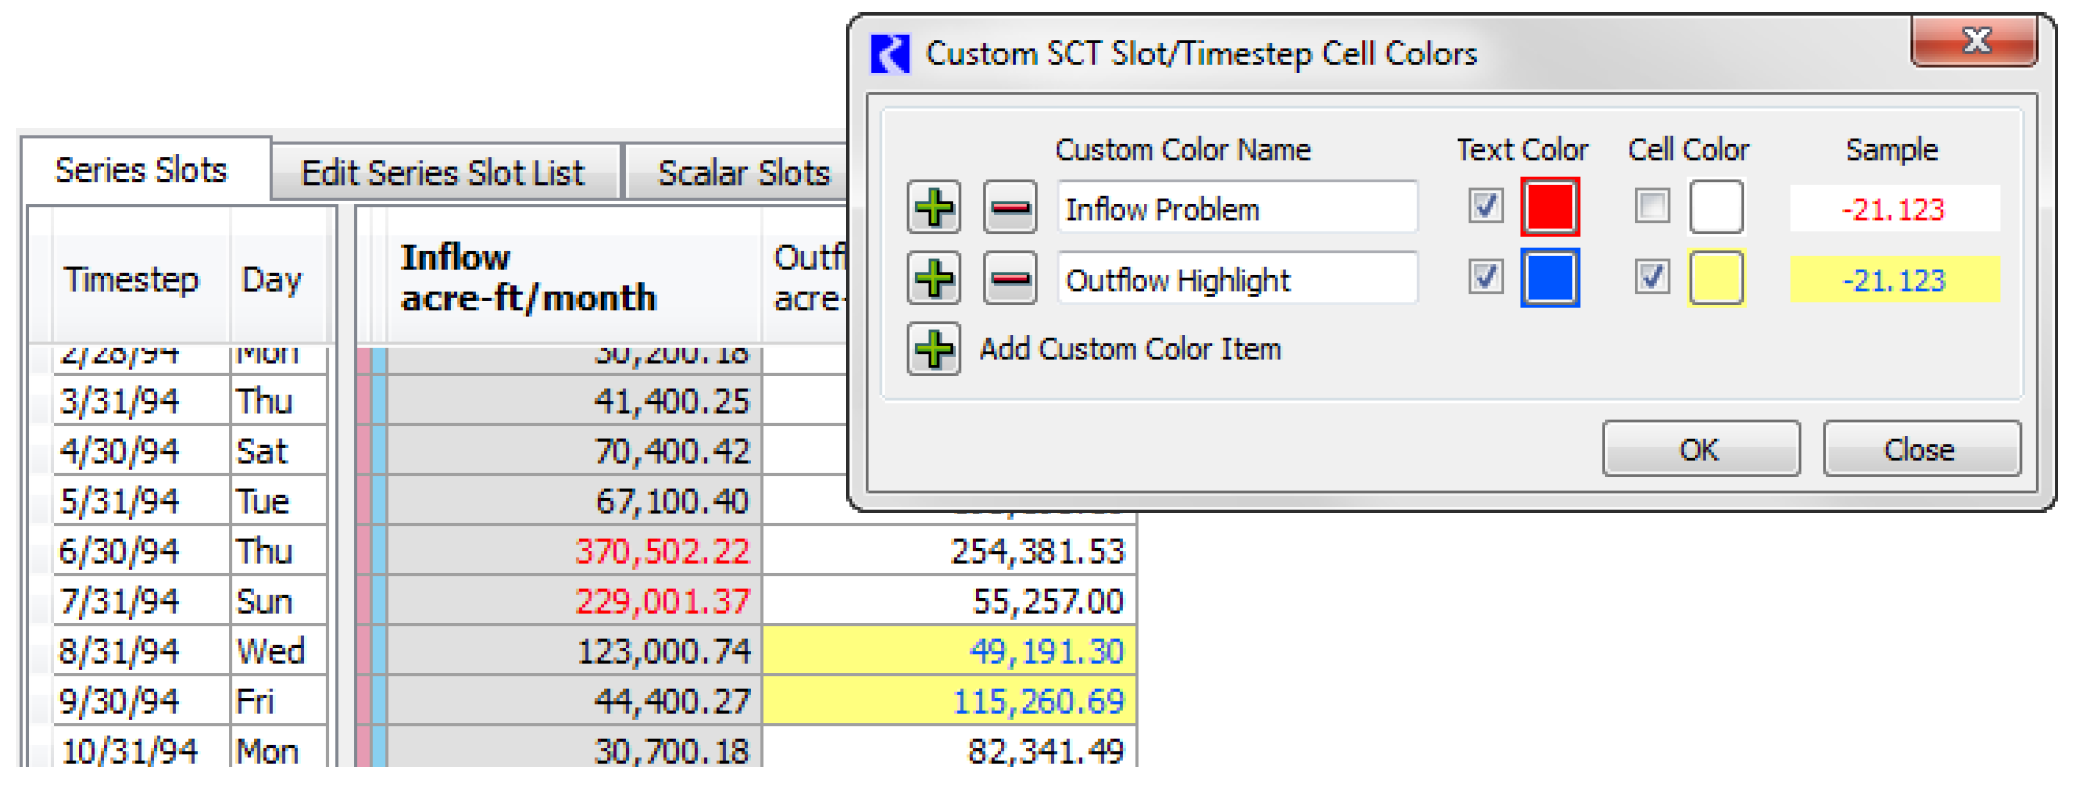
Note: When SCT cells are selected, the foreground and background colors of the numeric portion of those cells are reversed (swapped). So initially, the colors appear reversed, but clicking away from the cells will show your configured colors.
Use the Apply Custom Colors, then Clear operation to remove those cell colors, restoring the selected cells' colors to those associated with the series flag. Custom cell colors can be cleared from the entire SCT by selecting all cells, e.g. by selecting the upper left area of the row header table and performing the Clear operation.
Note: The cell / custom color associations are stored in the SCT, not in the RiverWare model. So the SCT must be saved to retain these color associations.
Apply Color Alerts Based on Slot Values
To apply custom colors alerts (a form of conditional formatting) for a particular slot, define the colors and thresholds for each interval. On the Edit Series Slot List tab, switch to the Configure Color Alerts mode.
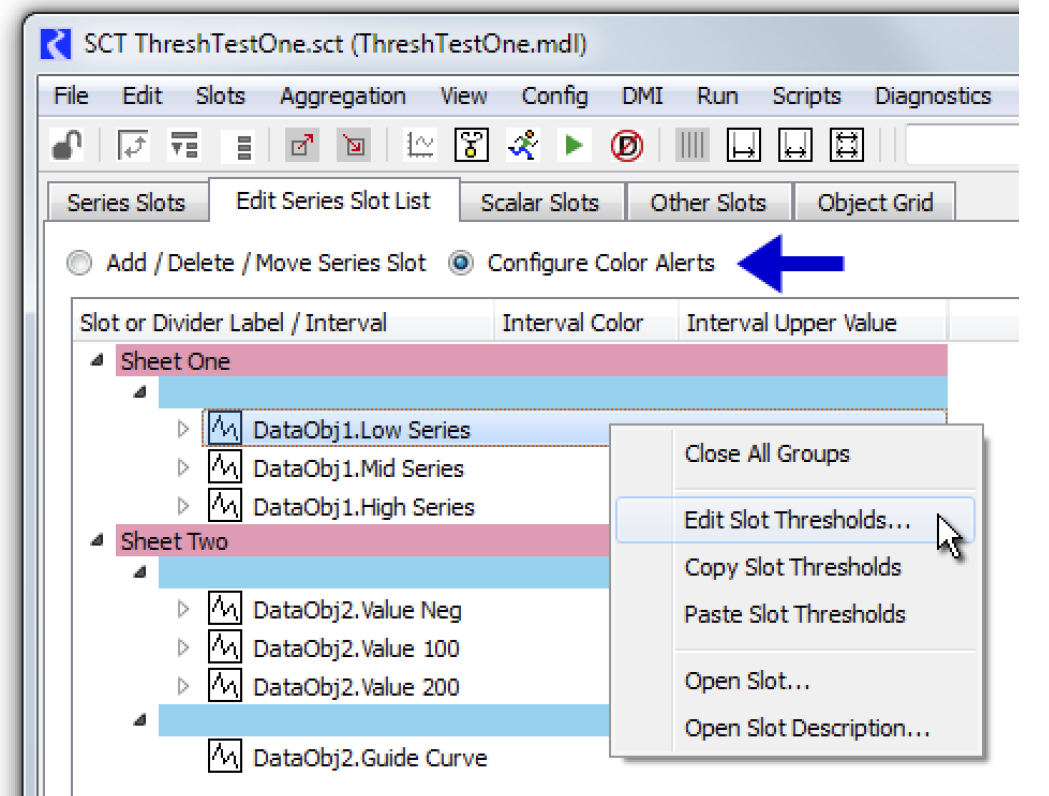
Right-click the slot and choose the Edit Slot Thresholds context menu to open the SCT Color Alert Threshold Configuration dialog box. Then define the thresholds/intervals and colors. See “Configure Color Alerts” for details.
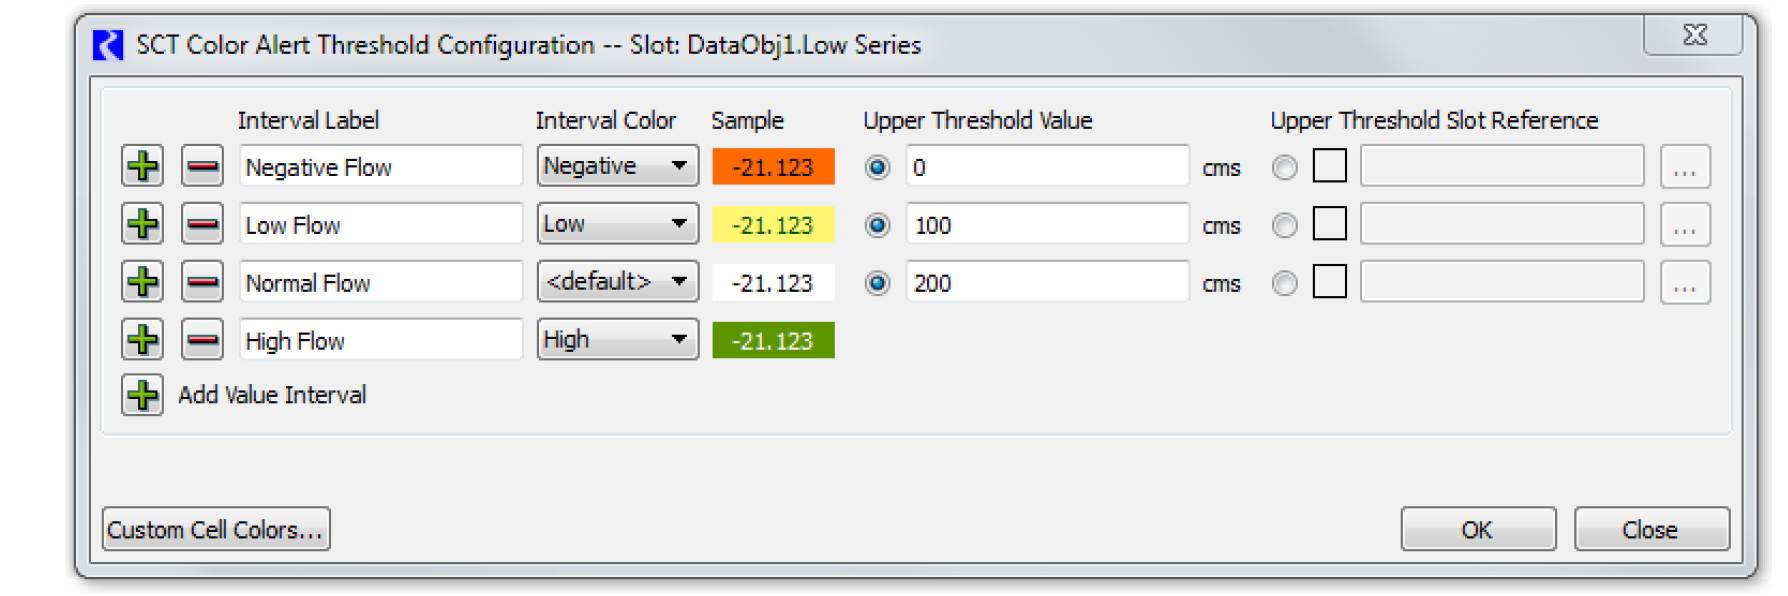
Change Ornamentations
You can configure the graphical ornamentations through settings in the SCT Configuration Dialog. These settings are represented on various tabbed panes in that dialog. See “SCT Configuration Settings” for details.
• General tab
– Display NaN. If this is disabled, undefined numeric values are shown as blanks (empty cells).
• Show Grid
– Crosshatch Read Only Cells (for example, expression slots and accounting system slots). Non-editable values are shaded with a crosshatch of a configurable color; see “Color Tab” for details.
• Horz Time tab
– Draw Weekend Divider Columns. This function lets you specify the drawing of thick lines between pairs of timesteps that straddle a Friday-to-Saturday or Sunday-to-Monday boundary in the Horizontal Timestep Axis Orientation Views. If enabled, Weekend Divider columns are drawn with the configurable Weekend Divider color; see “Color Tab” for details.
– Draw Month Divider Columns. This function lets you specify the drawing of thick lines between pairs of timesteps that straddle the first and last timesteps of calendar months in the Horizontal Timestep Axis Orientation Views. If enabled, Month Divider columns are drawn with the configurable Month Divider color; see “Color Tab” for details.
• Vert Time tab
– Draw Weekend Divider Rows. This function lets you specify the drawing of thick lines between pairs of rows that straddle a Friday-to-Saturday or Sunday-to-Monday boundary in the Vertical Timestep Axis Orientation Views. In the Aggregated Vertical Time View, if the weekend boundary falls between detail rows that are hidden, then the divider is drawn as a dotted line immediately below the corresponding summary row. If enabled, Weekend Divider rows are drawn with the configurable Weekend Divider color; see “Color Tab” for details.
– Draw Month Divider Rows. This function lets you specify the drawing of thick lines between pairs of timesteps that straddle the first and last timesteps of calendar months in the Vertical Timestep Axis Orientation Views. In the Aggregated Vertical Time View, if the month boundary falls between detail rows that are hidden, then the divider is drawn as a dotted line immediately below the corresponding summary row. If enabled, Month Divider rows are drawn with the configurable Month Divider color; see “Color Tab” for details.
• Summary tab
– Show Timestep Flag Colors exclusive toggle buttons. This function lets you select the conditions under which flag values are indicated with background shaded regions in summary cells. Always is a good choice in most circumstances. This was introduced for the following reasons:
• To experiment with ways of distinguishing Summary Rows from Detail Rows,
• To support quicker screen refreshing with large aggregations.
• Flags tab
– Custom colors that indicate slot timestep flag values with background color shading. You should choose flag colors that contrast with the Foreground Text color.
• Color tab
– Other custom ornamentation colors.
Change the Aggregation Interval
You can change the Aggregation Interval by using the SCT Timestep Aggregation Dialog. This dialog is shown by selecting Aggregation, then Timestep Aggregation Config. See “Timestep Aggregation”.
Ornamentation of Hidden Pre- and Post-Run Timesteps
The time range of the SCT depends on the following factors:
• The time range of the loaded model’s Run Control.
• The number of pre- and post-run timesteps configured for the SCT.
It is quite possible that the time range of any particular slot starts before the first timestep shown in the SCT or ends after the last timestep shown in the SCT. When this occurs, a small corner triangle displays in the first or last Summary cell and the first or last Detail cell in that slot. If you select such a Detail cell, the number of obscured timesteps displays in the Selection Info Area at the bottom of the SCT.
The only way to display a slot’s obscured timesteps is to extend the time range of the SCT to cover the slot’s full time range. This is done by selecting the General tab of the SCT Configuration Dialog. Increase either the Pre-Run Timesteps count or Post-Run Timesteps count by the required amount. See “General Tab” for details.
Use the Default Configuration
When a new SCT is created, RiverWare looks to see if there is a default.sct file defined. If so, the configuration settings from the default are used in the new SCT. Also, at any time, you can choose to either save the current settings as default or revert to default settings. The default configuration is supported with the menu operations from the SCT Config menu. See “Config Menu” for details.
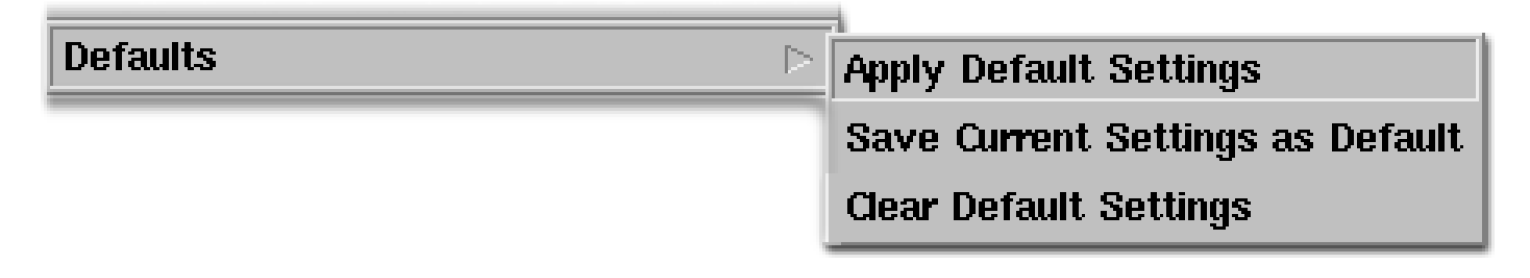
• Apply Default Settings applies the saved default settings to the current SCT. The SCT slots are not affected.
• Save Current Settings as Default saves the SCT configuration (without the Slot Item list) as the default configuration.
• Clear Default Settings restores the default settings to the factory defaults. This does not affect the current SCT.
The default configuration is used to do the following:
• Create a new SCT.
• Migrate an old SCT (Previous Version #.#) to the new SCT.
• Apply the default settings explicitly to the current SCT, by selecting Config, then Defaults, then Apply Default Settings.
How To Manipulate Data to Model Operations
The sections above describe how to configure the SCT to look the way you wish. This section describes how to use the SCT to set values in the model. Remember, the SCT is just a window into the model, all values are stored in the model. So, this section describes how to use the SCT to operate the model.
Set a Single Value
Generally, you can directly edit data. Or you can select the cell, and then select the Entry field (at the top of the SCT) and edit the number there.
Note: Entering n or NaN in either upper or lower case causes the value and flag to be cleared (i.e., set to the Output flag).
Note: To abort an edit, press the Escape (Esc) key.
Note: The SCT Lock does not prevent modifications to slot data.
When you enter a valid (non-NaN) value, in addition to the numeric value being set on the slot timestep, generally the Input Flag is set. An exception, cells with the Target flag initially set will retain that flag.
Note: In terms of navigation, when you press Enter after editing a value, the selected cell will typically move to the next cell in the timeseries. This is true even when in Horizontal Timestep Axis Orientation. When you press Tab, it will move to the next slot, at the same timestep. Use the arrow keys to move through the SCT as though it is a spreadsheet.
You cannot edit certain types of slots, including expression slots and certain accounting system slots. These slots have Read-Only ornamentation. Read-only cells are cross-hatched with a user configurable Read-Only color. See “General Tab” for details.
If you want expression slots to evaluate after you edit a value, the SCT must be configured to use the Auto-Evaluate Expression Slots on Edits checkbox in the General tab of the Config menu (see “General Tab” for details). With the checkbox selected, expression slots shown on the SCT will fully evaluate (all timesteps) any time a value on that SCT is edited.
Set Multiple Values
When you select multiple data cells, the value you enter is set on all cells on the selection. So, editing the active cell within a multiple-cell selection behaves similarly to setting a single value, but the value is set on all cells in the selection This can include slots having different unit types (e.g., Flow and Area). It is up to you to insure that the multiple-value setting operation makes sense. See “Set a Single Value” for details.
Since selecting a Summary Cell is equivalent to selecting all of the corresponding Detail Cells, an edit of a Summary Cell is implicitly a multiple-value edit operation. See “Show or Hide (Aggregation) Summaries” for details.
Set Slot Value over Time Range
If you want to set a particular slot to a particular value (or interpolate to a value) from a start timestep to some finish timestep (often a long way out), use the Set Slot Value over Time Range dialog.
On the SCT, select the first cell in the range and right-click. Choose the Set Values over Time Range menu item.
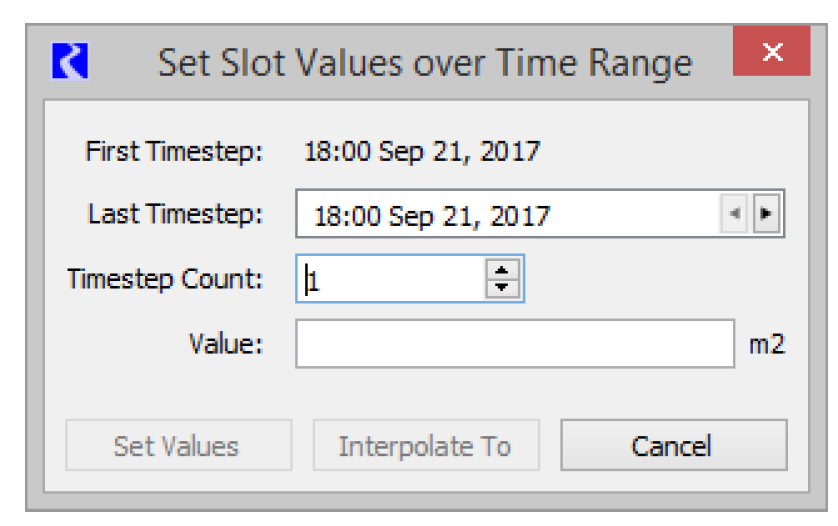
Specify either the Last Timestep or the Timestep Count to define the time range. As you change the range, the cells are selected on the SCT. Then specify the Value to set in the units of the slot, as shown.
The three buttons are as follows:
• Set Values. Sets the specified time range to the specified value.
• Interpolate To. Sets the final timestep to the specified value, and interpolates all of the values in between. (This is enabled only if the value of the first timestep is non-NaN). An alternative interpolation is described in the next section.
• Cancel. Dismiss the dialog, with just the original cell selected.
Interpolation
To linearly interpolate between input values, select Edit, then Interpolate Selection (also, Ctrl+l). See “Edit Menu” for details.
This operation interpolates between the beginning and ending values in the selection. Because this will overwrite inputs, a confirmation is provided, as shown in Figure 8.16. Select OK to overwrite any inputs in between the two end values. Or if you want to preserve your sparse inputs, select Interpolate Between Inputs. One possible application of this is filling the gaps in series data. This functionality exists for both the slot and SCT dialogs.
Figure 8.16
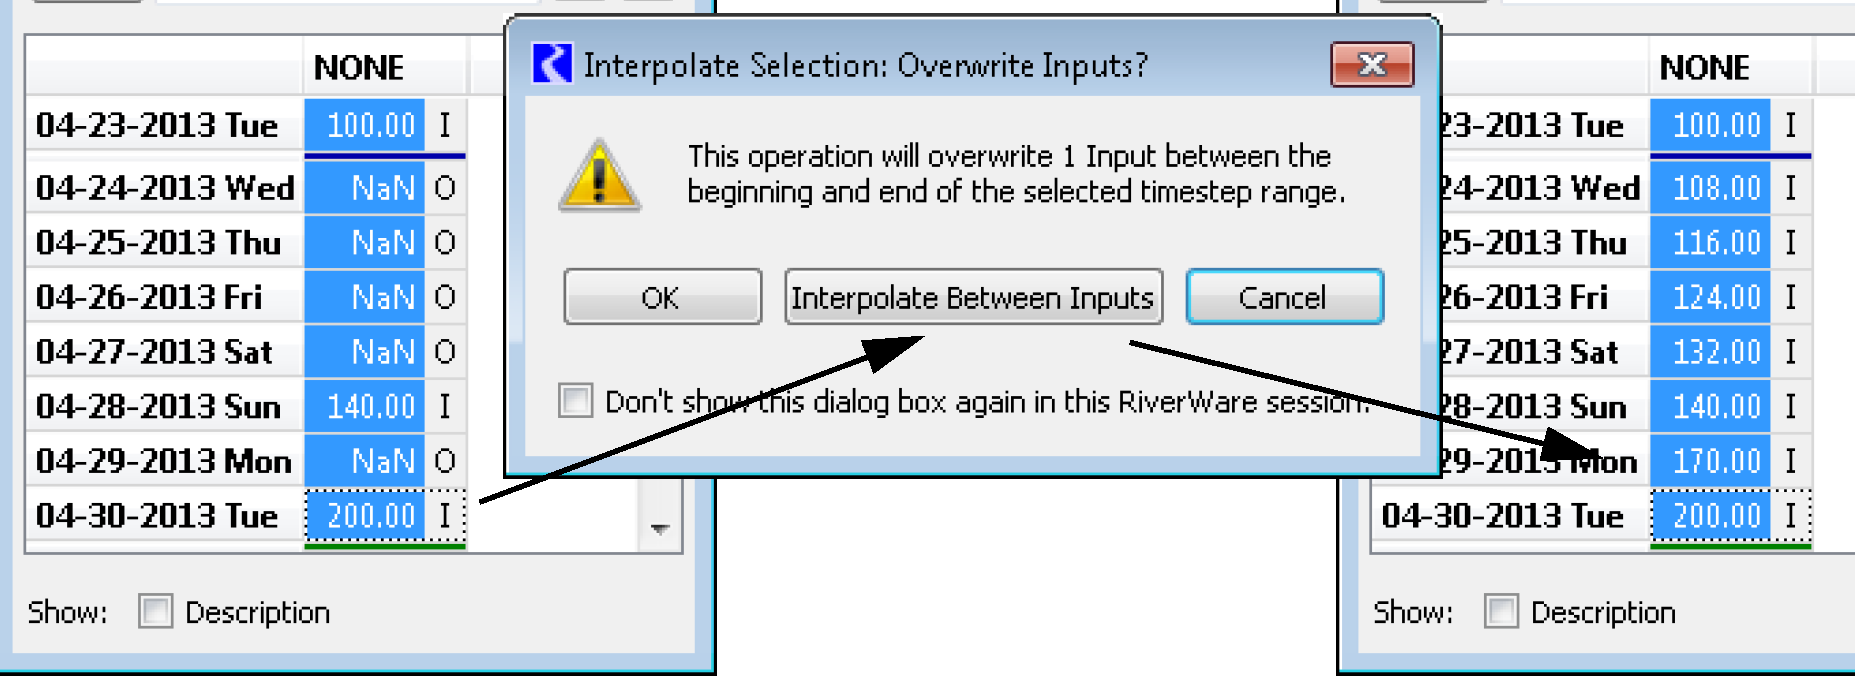
Interpolate is available (enabled) if the following are true:
• The slot/timestep cell selection is rectangular and contiguous in both slot and timestep dimensions.
• The rectangular selection contains at least three contiguous timesteps.
• All slot values at the first and last timesteps are defined (not NaN).
Note: All interpolation is done within the internal units and then converted to the display units. For 1 Month timesteps, this takes into account the lengths of different months. Since the standard internal units for per-time values are never per month (e.g., flow values are cms), the potentially undesirable effect on the interpolation function due to the different amounts of time represented by different months is avoided. by using internal units.
Adjust Values
The Edit, then Adjust Values operation allows you to either add (or subtract) a fixed value to the selection or scale the values by a percentage. This can be applied to any arbitrary slot / timestep cell selection in the SCT. Both absolute and relative (percentage) adjustments of values in series slots can be made. Absolute adjustments are available only when all cells in the selection have the same scale and unit. Neither NaN values nor Read-Only (cross-hatched) values are affected. Since slots can appear in an SCT more than once, the adjust value operation is careful to adjust each selected Slot/Timestep value only once. Select the Report Results checkbox to see a summary of the slots changed.
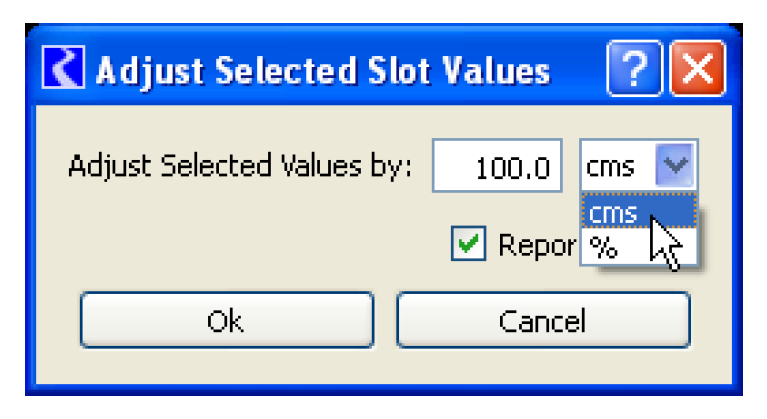
Clear Values
You can clear all editable values by selecting them and pressing the Delete key. Or select Edit, then Clear Values.
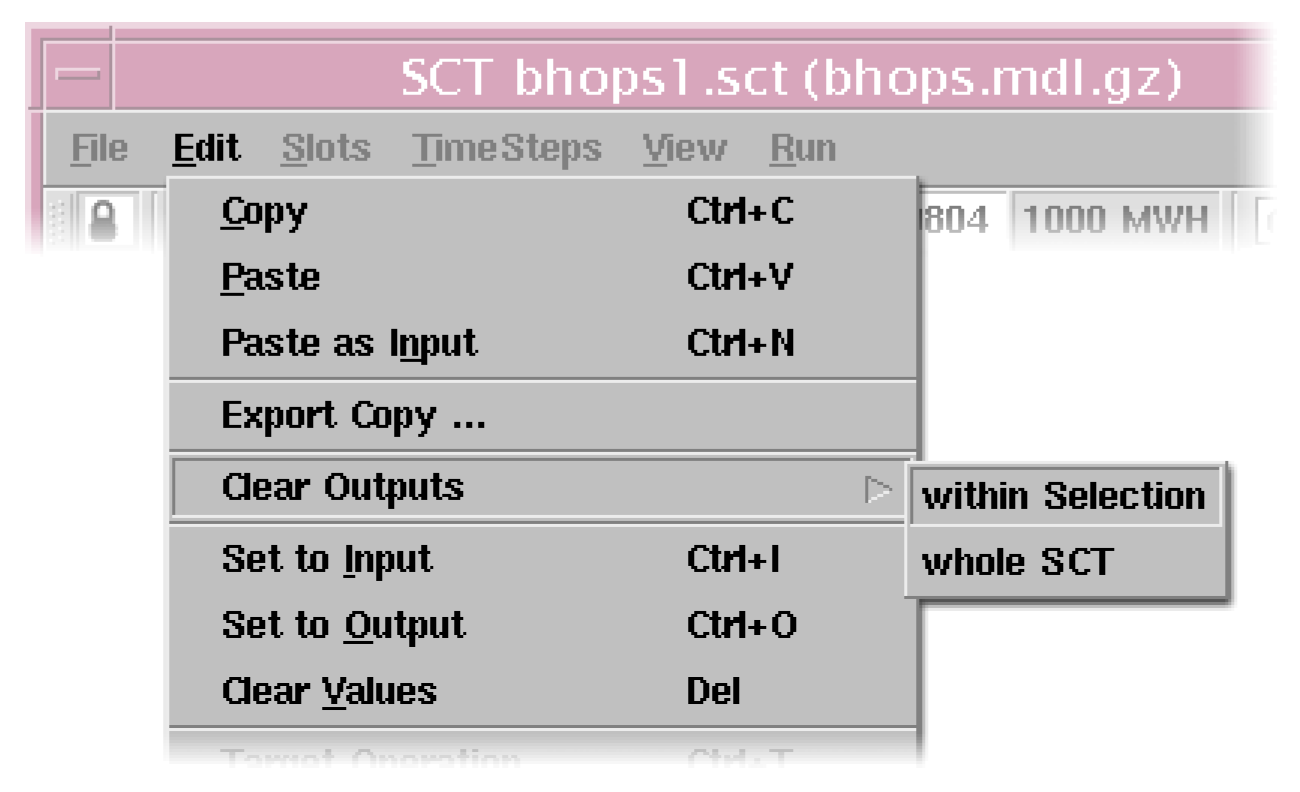
When a value is cleared:
• Its value is set to NaN.
• Its flag is set to the output flag.
Also, to clear values, select Edit, then Clear Outputs, then within Selection, then whole SCT.
Clear Outputs clears values that would generally be computed during a model run. This includes clearing values that have the following flags:
• Output (O)
• Best Efficiency (B)
• Max Capacity (M)
• Drift (D)
• Unit Values (U)
Note: The SCT Lock does not prevent the clearing of slot data.
Set a Flag
Flags are properties associated with individual slot timesteps that are generally depicted in the SCT using background color shading.
You can set the Input (I) and Output (O) flags on editable slot timesteps; input flag can be set only on timesteps with a defined (non-NaN) value. Other flags can be set only on certain slots. The Target Operation sometimes involves coordinating pairs of internal flags on different timesteps. See “Set a Target Operation” for details.
Flag operations are available in the Edit menu and as toolbar buttons that can be optionally shown or hidden depending on settings in the Configuration Dialog Flags tab. See “Edit Menu” and “Flags Tab” for details.
These operations are also available as keyboard accelerators, as follows:
• (I) Input: Ctrl+I
• (O) Output: Ctrl+O
• (T) Target: Ctrl+T
• (B) Best Efficiency: Ctrl+B
• (M) Max Capacity: Ctrl+M
• (D) Drift: Ctrl+Shift+~
• (U) Unit Values: N/A
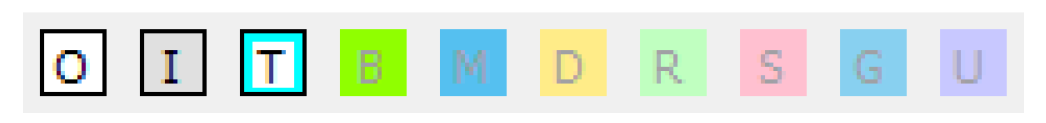
If the current cell selection includes any slot that doesn’t support a particular flag, the Flag Set operation for that flag is disabled. The disabled menu operations are indicated as grayed-out. The active Flag Set toolbar buttons are indicated with a black border.
Note: The SCT Lock does not prevent the setting of flag values on slot timesteps.
Set a Target Operation
You can apply a Target Operation to a single timestep or to a contiguous range of timesteps on the following slots:
• Reservoir.Storage
• Reservoir.Pool Elevation
If the Target Operation is applied to a single timestep, by setting the Target Flag on a single selected timestep, then that timestep is regarded as the final timestep of the Target Operation. The first timestep is implied by the flag values in the preceding timesteps. This implicit Target Begin timestep is determined during the model run. See “Set a Flag” for details.
If the Target Operation is applied to a range of timesteps within a slot then the earliest timestep is assigned the Target Begin Flag and the latest timestep is assigned the Target Flag. In this sort of Target Operation, the final target timestep is indicated with a solid background fill color of the user-configured Target color (see “Flags Tab” for details), and the previous timesteps have only a thick border of that color.
Target Operations are indicated by a frame around all of the timestep cells within the target range.
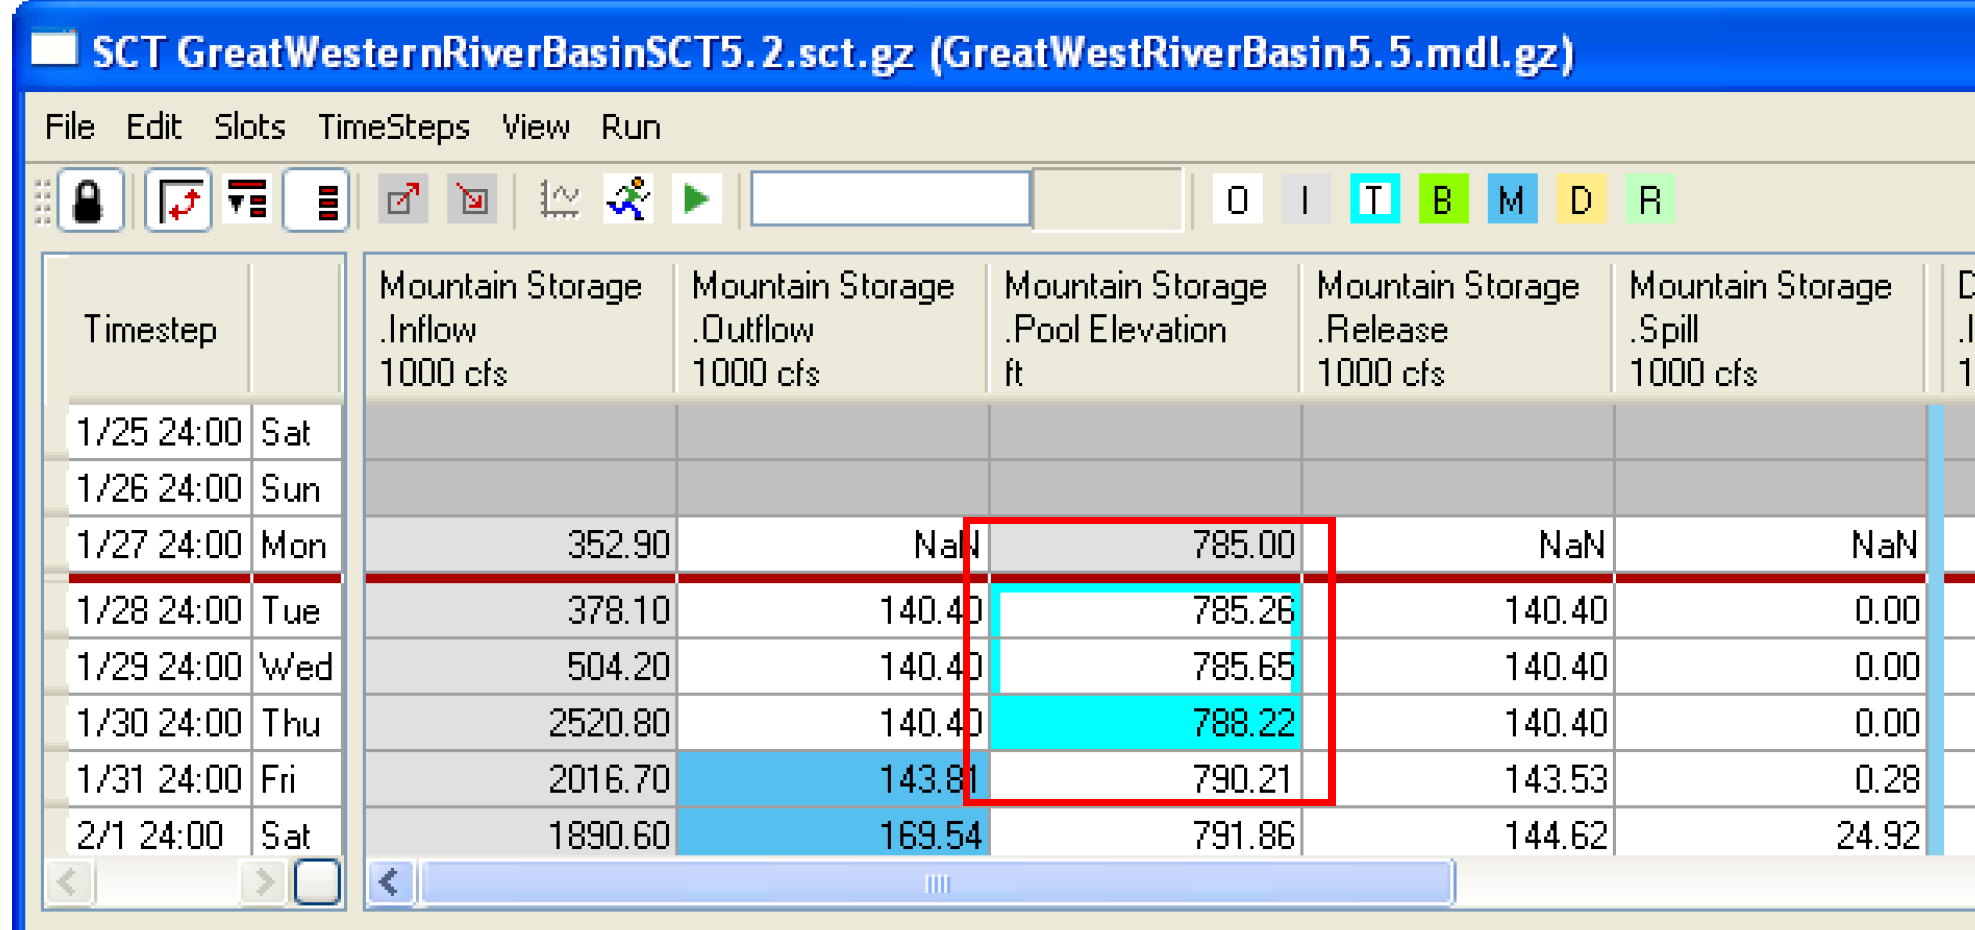
Copy a Single Value to One or Many Timesteps
Through the following four steps, you can copy a single timestep value to one or more timestep values on a slot having the same unit type. This works both within a single SCT or between SCTs. You can repeat, any number of times, the third and fourth steps detailed below.
1. Select a cell (a detail cell, or a data cell in a non-aggregated view). See “Show or Hide (Aggregation) Summaries” for details.
2. Perform the copy operation in one of three ways:
– Press Ctrl+C or
– Select the Edit, then Copy menu operation or
– Select the Copy toolbar button.
The source cell will be marked with the Copy Set Crosshatch of a user configured color; see “Color Tab” for details.
3. Select (select or, optionally, drag) the destination cell(s).
4. Perform the paste operation in one of these ways:
– Press Ctrl+V or Ctrl+N or
– Select the Edit, then Paste or Edit, then Paste as Input menu operation or
– Select the Paste toolbar button.
– All but the Paste as Input and Ctrl+N operations perform the default paste operation, which pastes only input values and flags—and clears all the other destination timesteps. See “Copy and Paste” for details.
– The paste operations are enabled only if all of the destination cells are of the same unit type as is the source cell and if they are all editable (i.e., not read-only).
– If the source cell is a summary cell (in an aggregated view), then generally this is equivalent to selecting multiple values (multiple timesteps), which would initiate the copy of multiple values. See “Copy Multiple Values” and “Show or Hide (Aggregation) Summaries” for details.
Note: If the paste operation is enabled, then values that are pasted (depending on the type of paste operation) are assigned to the destination timesteps using standard units. This means that if the display units of the source and destination slots are different (e.g., cubic feet per second vs. cubic meters per second), then the pasted values will appear to be different than the source value. However, the quantities that those values represent will be the same. See “Copy and Paste” for details.
Copy Multiple Values
You can copy a set of timesteps within a single slot to another time within the same slot or to a different slot having the same unit type. This works both within a single SCT or between SCTs.
1. Select the source cells. These can include all sorts of data cells, including summary cells. Timesteps indicated in the selection do not have to be contiguous.
2. Perform the copy operation in one of three ways:
– Press Ctrl+C or
– Select the Edit, then Copy menu operation or
– Select the Copy toolbar button.
– The source cells are marked with the Copy Set Crosshatch with a user configured color; see “Color Tab” for details.
3. Select a single cell as the first timestep at which to paste. This cell can be any sort of data cell, including a summary cell. If you select a summary cell, the implied earliest timestep is the first timestep within the timestep aggregation represented by that summary cell.
Note: Alternate operation: Instead of selecting a single cell to identify the earliest destination timestep, if you select a single whole slot, the implied destination timestep is the earliest timestep from the source timestep selection. This is accomplished differently in the two axis orientations:
– In Horizontal Timestep Axis Orientation (where rows correspond to slots), you select a slot as follows:
• selecting a row tab at the extreme left side of a summary row or
• if the SCT is locked, by selecting any row header field within a summary row or in any row in the non-aggregated view.
– In Vertical Timestep Axis Orientation (where columns correspond to slots), you select a slot by selecting a column header.
4. Perform the paste operation in one of these ways:
– Press Ctrl+V or Ctrl+N or
– Select the Edit, then Paste or Edit, then Paste as Input menu operation or
– Select the Paste toolbar button.
– All but the Paste as Input and Ctrl+N operations perform the default paste operation that pastes only input semantics values and flags and clears all the other destination timesteps. See “Copy and Paste” for details.
– If there are timestep gaps in the source timestep selection, those gaps are honored by the paste operation. That is, the corresponding gaps in the destination will not be affected.
– The paste operations are enabled only if the selection includes cells from just one slot. Pasting of defined values is performed using standard units. See “Copy a Single Value to One or Many Timesteps” for details.
Copy a Timeslice Across All Slots
Within a single SCT, you can copy a set of contiguous timesteps across all slots to other timesteps. You can repeat, any number of times, the third and fourth steps (pasting) detailed below.
1. Select the source timesteps:
• In Horizontal Timestep Axis Orientation (where columns are timesteps or timestep aggregations), this is done by selecting and dragging in the column headers.
• In Vertical Timestep Axis Orientation (where rows correspond to timesteps or timestep aggregations), this is done by selecting or dragging in the row tabs at the far-left side of each row.
2. Perform the copy operation in one of three ways:
– Press Ctrl+C or
– Select the Edit, then Copy menu operation or
– Select the Copy toolbar button.
The source timestep data cells will be marked with the Copy Set Crosshatch with a user configured color; see “Color Tab” for details.
3. Specify the destination by selecting a timestep row or column as in the first step, above.
4. Perform the paste operation in one of these ways:
– Press Ctrl+V or Ctrl+N or
– Select the Edit, then Paste or Edit, then Paste as Input menu operation or
– Select the Paste toolbar button.
– All but the Paste as Input and Ctrl+N operations perform the default paste operation that pastes only input semantics values and flags—and clears all the other destination timesteps. See “Copy and Paste” for details.
Copy a Whole Slot
You can copy the series data of a whole slot to another slot in the same SCT or to a different SCT. You can repeat, any number of times, the third and fourth steps (pasting) detailed below.
1. Select a source slot.
• In Horizontal Timestep Axis Orientation (where rows correspond to slots), select a row tab at the extreme left side of a summary row or any data row in the non-aggregated view. If the SCT is locked, select any row Header field within a summary row or in any row in the non-aggregated view.
• In Vertical Timestep Axis Orientation (where columns correspond to slots), select a column header.
2. Perform the copy operation in one of three ways:
– Press Ctrl+C or
– Select the Edit, then Copy menu operation or
– Press the Copy toolbar button.
The source timestep data cells will be marked with the copy set crosshatch with a user configured color; see “Color Tab” for details.
3. Specify the destination by selecting a timestep row or column as in the first step, above.
Note: Alternate operation: Instead of selecting a single cell to identify the earliest destination timestep, if you select a single whole slot, the implied destination timestep is the earliest timestep defined in the source slot (regardless of the time range shown in the SCT). This is accomplished differently in the two axis orientations, as described in the first step, above.
4. Perform the paste operation in one of these ways:
– Press Ctrl+V or Ctrl+N or
– Select the Edit, then Paste or Edit, then Paste as Input menu operation or
– Press the Paste toolbar button.
All but the Paste as Input and Ctrl+N operations perform the default paste operation that pastes only input semantics values and flags—and clears all the other destination timesteps. See “Copy and Paste” for details.
Copy/Paste Data to/from the Clipboard (e.g., to Excel).
It is possible to copy to the system clipboard the numeric values displayed in an SCT and, to then paste those values into another application like Microsoft Excel.
Data is copied with the displayed units and without reference to units (but, optionally, with greater precision).
Copy Data
Use the following steps to copy data to the system clipboard.
1. Select data cells in the SCT.
2. Select Edit, then Export Copy
The Export to Clipboard dialog box appears.
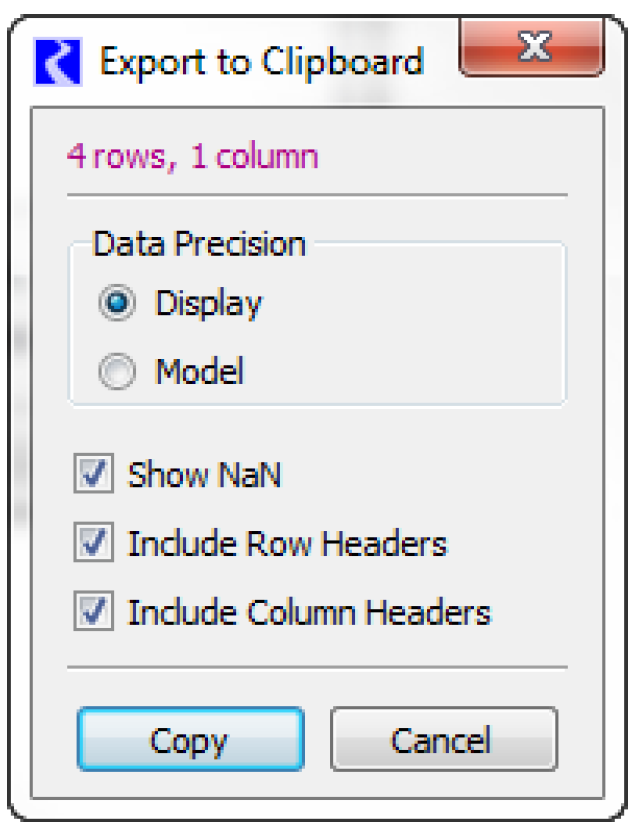
3. Select Display or Model data precision, and whether undefined values should be pasted as NaN (or remain as a blank). Also specify if you wish to include row headers or column headers. Depending on the axis orientation, the headers include the following:
– The complete label and the units (if enabled for display in the SCT) OR
– The timestep (sufficient to identify the timestep) and the timestep weekday (if enabled for display in the SCT)
4. Select the Copy button.
5. The data is now in the system clipboard and can be pasted in the other application (e.g., Excel).
Paste Data
Use the following steps to paste data from the system clipboard.
1. Copy the data from the other application (Excel, for example)
2. Make a cell selection in the SCT.(Aggregated views are allowed.)
3. Select Edit, then Import Paste. Alternatively, right-click the SCT and select Import Paste.
The Import from Clipboard dialog box displays.
4. Make any desired adjustments to the options.
5. Select Paste.
Note: In Horizontal Timestep Axis Orientation (where rows correspond to slots), you can specify if you want to paste a column of data (or row) as time series data or just paste it directly into the SCT grid across slots. Use the Paste clipboard column into Series Slot to paste the data into a single series slot. Clear the checkbox to paste across slots, as though the aggregated cells are a spreadsheet. Use the Limit paste operation to Slot Cell Selection to limit the paste to only those cells selected in the SCT.
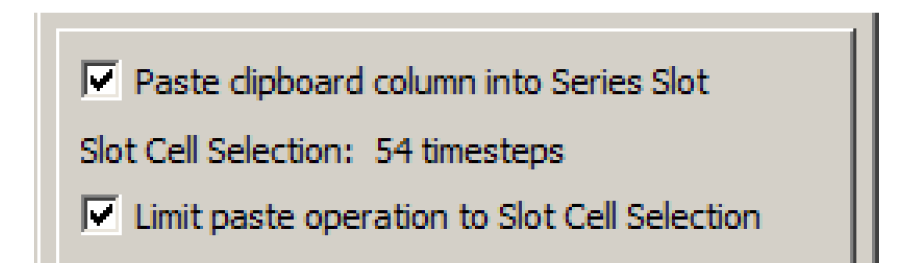
Note: Clipboard data format is ASCII-encoded decimal numeric values (or NaN for undefined values—if selected) within a row are separated with tab characters. Rows are separated with New Line characters.
How To Print, Plot, and Export Data
Printing
You can print a depiction of all or part of an SCT. From the SCT, only the Row Header Table and SCT Data Table (with column headers) are included. The printed-page header and footer contains some information about the SCT and RiverWare model.
There are three File, then Print menu operations:
• File, then Print, then Selection
• File, then Print, then Page
• File, then Print, then Full SCT
The Print, then Selection operation prints the minimum enclosing rectangle around the selection. In the aggregated views, summary rows are included only if all of their subordinate detail rows are included. The selection ornamentation (reverse colors) prints only through the Print, then Page and Print, then Full SCT operations.
Plotting
When you select the plot operation, the full range of the selected slots is plotted in a Plot Page. Plotting is enabled only if no more than two unit types are represented within the selection.
You can display a plot of the selected slots either by one of the following:
• Selecting Slots, then Plot Slots.
• Selecting the Plot toolbar button.
Exporting Data
The SCT does not support directly exporting data to files. However, see “Copy/Paste Data to/from the Clipboard (e.g., to Excel).” for instructions on copying selected information.
Data can also be exported to text files from the individual slots. Select Slots, then Open Slots to open the slot. Then use the File, then Export menu to export the data. See “Slots Menu”.
Revised: 11/11/2019