
Release Notes Version 6.7
Special Attention Notes
Following are special attention notes, indicating that functionality has changed that requires you to update models or that results may differ. If you have any questions, contact riverware-support@colorado.edu.
Earliest Dispatch Timestep - Stream Gage changes
Certain objects like the Reach, Confluence, and Control Point determine the first allowable timestep at which they can dispatch by searching upstream to find the earliest input value. Previously, if the search encountered a Stream Gage, it would stop the search. Now the search continues upstream through the gage. As a result, some downstream objects may be able to dispatch earlier if there is a gage upstream and there are inputs on or upstream of the gage. In some models this can lead to errors if the user has input values on the gage or other objects to solve at these pre-simulation timesteps. Often clearing the inputs is all that is required. The values will propagate from upstream.
License Manager Upgrade
The license manager was upgraded to a newer version. For floating licenses, you must restart the license server with the newer version. See “License Manager Upgrade” for instructions.
Inline Power, Flow Tables and Flow Power
The Flow Tables and Flow vs. Power Table method was modified to use the Min Turbine Release at Max Generation as its constraining value. This is obtained from the Flow vs Power Table by finding the max power and then using the corresponding flow. More information is available “Inline Power Plant - Flow Tables and Flow vs Power Tables method”.
Series Slot Bounds Terminology and Warnings
The semantics for the slot Min Value and Max Value were changed to Lower Bound and Upper Bound as described “Min/Max Changed to Bounds”. In addition, warning messages that values are outside of these bounds are no longer posted by default. If you wish to see these warning messages, check the Warn when Values are out of Bounds toggle in the Run Parameters as described “Warn when Values are out of Bounds” in User Interface.
Time Aggregation Series Slot Computations
Time Aggregation Series Slots were enhanced to better calculate averages for monthly flows that are aggregated to an annual timestep. Results for these calculations will change. In addition, slots with FLOW or VELOCITY unit types (per time and/or rate types) can not use the Sum function as this aggregation does not make sense. See “Modifications to Aggregation Computations”.
Accounting
Negative Transfers Out allowed
Previously, the storage account Transfers Out slot value had to be positive or the account would not solve. This check was removed for Transfers Out so that now all transfers between two accounts on the same object can be positive or negative.
Batch Mode
New RCL Commands
The following RCL commands were added:
• EnableInfoDiag - Set the Enable Informational Diagnostics checkbox in the diagnostics manager dialog. For more information, see “EnableInfoDiag” in Automation Tools.
• ExportOptAnalysisAsCSV - Export the optimization analysis information as a comma-separated values file. For more information, see “ExportOptAnalysisAsCSV” in Automation Tools.
• HDB_EnsembleID - Assign an ensemble id to an HDB dataset. For more information, see “HDB_EnsembleID” in Automation Tools.
• HDB_ModelRunID - Assign a model id into an HDB dataset. For more information, see “HDB_ModelRunID” in Automation Tools.
Data Management Interface
Excel Dataset Run Name List
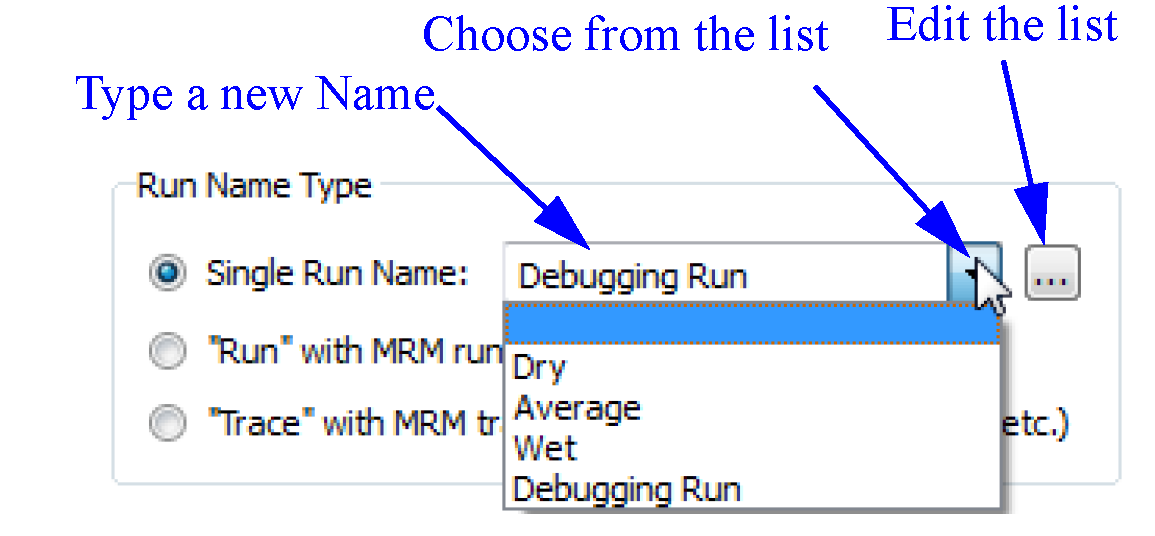
The Excel Dataset configuration has been enhanced to support a user-configurable list of available Single Run Names. You can either choose from this list or you can directly edit the Single Run Name text. For more information, see “Run Name Type” in Data Management Interface (DMI).
Trace Directory DMI
A new type of DMI, Trace Directory DMI, was added to support multiple runs involving Traces. This DMI requires a specific structure of subdirectories named with the trace number: trace1, trace2, trace3, etc. Each trace directory should contains data files, one for each slot. You provide a control file which specifies the slots to be imported/exported and optional keywords specifying scale, units, etc. for the slots. But, the file= keyword is not required in this control file because the directory is known from the specified DMI directory and the trace number being processed. In addition, no executable is required for the Trace Directory DMI.
For more information, see “Trace Directory DMI” in Data Management Interface (DMI).
Export RBS and Opt Run Analysis information
Support was added for the writing of rulebased simulation and optimization run information by Control File-Executable DMIs. Two new control file keyword/value pairs were added:
• slot_set_info = true/false
• slot_opt_sol_info = true/false
Diagnostics
Output Window - Copy Formats
For the various forms of “Copy Message” operations in the Diagnostics Output dialog, the relevant messages lines are now copied to the system clipboard in two formats:
• regular text lines (as before)
• a multi-column HTML table.
When pasting into Microsoft Word or Excel, both “unformatted” and “formatted” options appear in the menu; the formatted option presents the Line Numbers (if shown), Context, and Message in different columns. When pasting into a simple application which supports only text, like a text editor, only the unformatted plain text is pasted.
Licensing
License Manager Upgrade
The license manager was upgraded to a newer version. For floating licenses, you must use the newer version. Please shut down the current license server and re-start with the newer version of the license server program files (rlm.exe, rlmutil.exe, cadswes.exe, and cadswes.set) and your current license file. These files are located in the sub folder “reprise” in the 6.7 installation directory. For more detailed instructions: click HERE.
Note, this new license manager is backward compatible; for example, you can still run RiverWare 6.6 with the new license manager.
There are no changes needed for node-locked licenses and no new license files are needed for either node-locked or floating licenses.
Model Files
Locking Model while Open
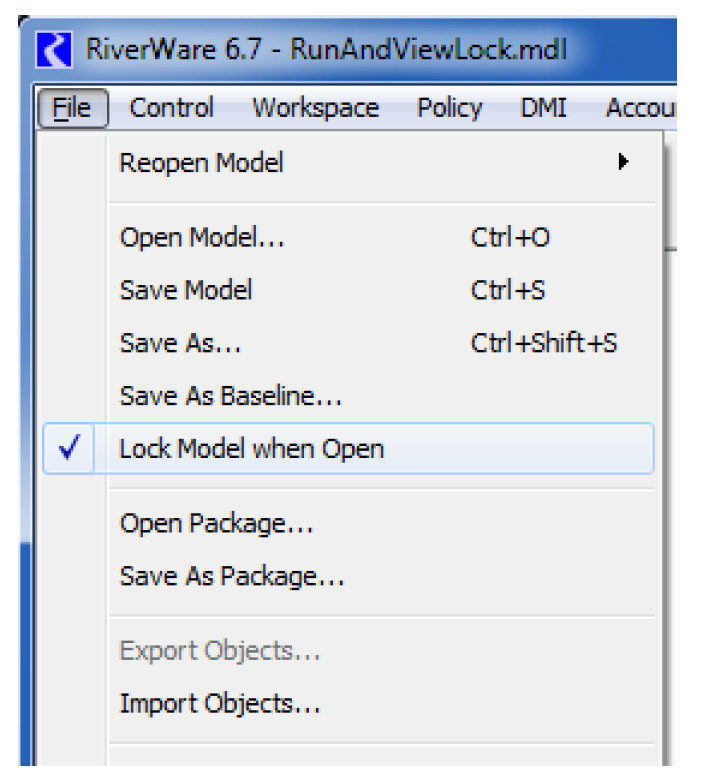
If more than one user is working on a model, then you may want to lock the model when open to prevent others from simultaneously changing the file. To do this, use the File Lock Model when Open menu item and then save the model. A lock file is created in the same directory as the model. If another instance of RiverWare opens the model, the user is notified that the model file is locked and cannot be overwritten.
For more information, see “Locking Models” in User Interface.
Multiple Run Management
HDB Ensembles
HDB Ensembles within MRM were improved as follows:
• Select Ensembles at MRM Start - A new option was added so that the ensemble id for an HDB ensemble dataset can be selected at the start of a multiple run instead of being pre-specified in the dataset's configuration.
• GetEnsembleTraceValue and GetEnsembleValue RPL Predefined Functions - These functions were added to query current ensemble and trace meta-data to get the meta-data value for a given meta-data keyword.This was implemented to work for ensemble meta-data information imported during multiple runs and also single runs.
• Creation of New Ensembles in HDB from RiverWare - This allows editing an existing ensemble or creating a new one when ensemble ids are chosen for HDB ensemble datasets, either during dataset configuration or when an MRM run is started.
• Agency ID as User-Selected Parameter - allows the user to optionally choose an agency id from HDB in an ensemble dataset configuration, and write that agency id to its ensemble when executed in an output ensemble DMI.
More information on HDB ensembles is provided “Ensembles” in Solution Approaches.
MRM Descriptors
Within MRM, new keyword/value descriptors can now be included. The descriptors are defined in the MRM configuration on the Description tab. There is now also an option to output the descriptors to both the CSV and netCDF output files from MRM. In CSV, descriptor keywords become column headers and descriptor values become the data value for the column. In netCDF, the descriptor keywords become the name of a global attribute in the file and the descriptor value becomes the value for the attribute.
For more information, see “Description” in Solution Approaches.
netCDF File Size Improvement
The NetCDF output file from multiple runs was changed from a netCDF4 file with two unlimited dimensions (time and traces) to a netCDF3 file with one unlimited dimension (time). In one example, this resulted in a dramatic reduction in the output file size (from 20 MB to 11 KB). For more information on netCDF output, see “NetCDF Files” in Solution Approaches.
Objects
Inline Power Plant - Flow Tables and Flow vs Power Tables method
The Flow Tables and Flow vs. Power Table method was modified to use the Min Turbine Release at Max Generation as its constraining value. This is obtained from the Flow vs Power Table by finding the max power and then using the corresponding flow.
The algorithm is documented “Flow Tables” in Objects and Methods.
Stream Gage - Stage Methods
A new category, Stream Gage Stage, and method, Stage Table Lookup, were added to the Stream Gage to compute the Stage associated with the flow at the stream gage by looking up the flow on a table that relates flow to stage. In addition, a dispatch method was added to trigger this solution.
For more information, see “Stream Gage Stage” in Objects and Methods.
Earliest Dispatch Timestep
Certain objects like the Reach, Confluence, and Control Point determine the first allowable timestep at which they can dispatch by searching upstream to find the earliest input value. Previously, if the search encountered a Stream Gage, it would stop the search. Now the search continues upstream through the gage. As a result, some downstream objects may be able to dispatch earlier if there is a gage upstream and there are inputs on or upstream of the gage. In some models this can lead to errors if the user has input values on the gage or other objects to solve at these pre-simulation timesteps. Often clearing the inputs is all that is required. The values will propagate from upstream.
For more information, see “First Dispatch Timestep” in Solution Approaches.
Power Reservoirs
Power Method: Plant Efficiency Curve modifications
In the Plant Efficiency Curve power method, the Plant Power Table data was previously required to be concave. This check was removed for the beginning of Simulation and Rulebased Simulation but is still performed at the beginning of an Optimization run.
Tailwater Method: new Coefficients Table method
A new Tailwater method was added: Coefficients Table. This method models the tailwater using a series of coefficients that are applied to the Outflow, Tailwater Base Value, and Tailwater Elevation at the current and/or previous timestep. For more information, see “Coefficients Table” in Objects and Methods.
Water User - Soil Moisture Methods
A new slot Soil Moisture Gain Loss was added to track the soil moisture water lost when the irrigated acreage is reduced from the previous timestep. In the Irrigation Request with Soil Moisture, the method calculates the volume lost by the reduced area. This volume is then included in the water balance when the water user solves for the current Soil Moisture.
More information can be found “Irrigation Requests with Soil Moisture” in Objects and Methods.
Optimization
Optimization Solution Analysis Export
It is now possible to export optimization analysis information (as displayed in the Priority- Oriented Optimization Solution Analysis Tool) to a file in a Comma-Separated Values (CSV) format. You can do this interactively or through batch mode as described “New RCL Commands”. The export includes options on which types of information to export and an option to omit rows with values that are zero. For more information, see “Priority-oriented Optimization Solution Analysis Tool” in Optimization.
In addition, you can now save the entire optimization analysis information (i.e. the problem) for later use by selecting the File Save Problem menu.
Power Reservoir Methods
Optimization Power method: Power Surface Approximation modifications
The Power Surface Approximation method was extended to account for tailwater effects, particularly if the Tailwater Base Value is linked to another reservoir’s Pool Elevation.
In addition, a scalar slot, PSA Constraint Coefficient Tolerance, was added. This slot is used to avoid numerical instability. For more information, see “Power Surface Approximation” in Optimization
Optimization Tailwater method: new Opt Coefficients Table method
A new method was added to the Optimization Tailwater category: Opt Coefficients Table. This method sets up the physical tailwater constraints using the same equation and coefficients used in the Coefficients Table tailwater method. For more information, see “Opt Coefficients Table” in Optimization.
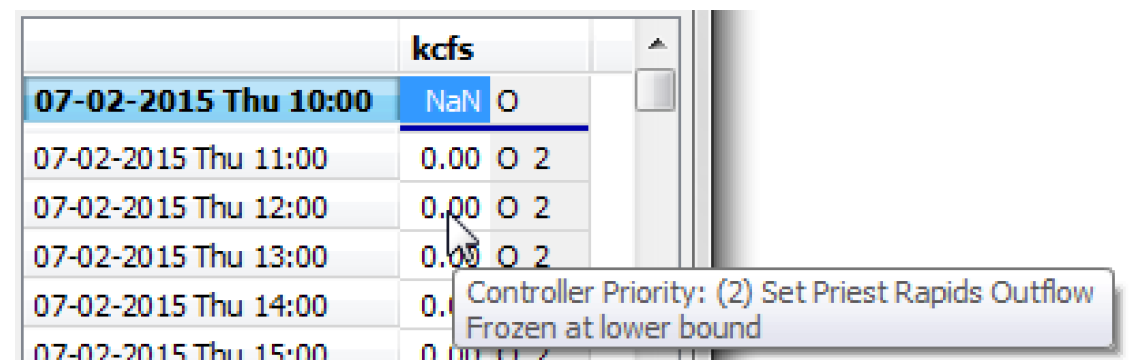
Slot Tool Tips show Optimization Solution Information
If a slot variable is frozen, the information is shown on the slot and SCT dialogs in the tool tip. For more information, see “Tooltips on Variables” in Optimization.
Output, Plotting, and Model Reports
Charts - Timestep Size
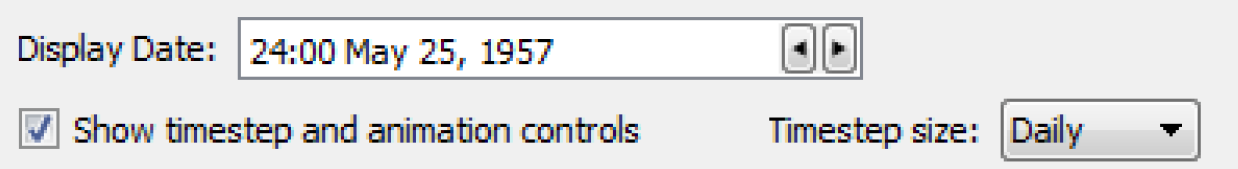
Pie Charts now have a configuration setting so that you can specify the timestep size to use for the animation and timestep controls. You can choose any timestep greater than or equal to the timestep of the selected data. For example, for a chart showing hourly data, you may only want to step through the pie chart at a daily timestep.
For more information, see “Data Tab” in Output Utilities and Data Visualization.
Comma-Separated Values Output Device
A new output device, Comma-Separated Values (CSV) file was added. This device provides options on which fields should be included in the output file and which slots to include. This new file has a format that can easily be imported into Excel or Tableau for further analysis:
Object.Slot, Timestep, Slot Value, Object Name, Unit, Year, Month
Pella.Outflow,02-29-1920 24:00:00,120.23,Pella,1 cfs,1920,February
Pella.Outflow,03-31-1920 24:00:00,133.21,Pella,1 cfs,1920,March
...
For more information on the format or configuration, see “Creating a Comma-separated Values File” in Output Utilities and Data Visualization.
Model Reports
Model Reports “Model Report” in Output Utilities and Data Visualization allow you to generate a customized HTML document describing various aspects of a model including the configuration, RPL policy, slots, and plots. Following are items that have been added to Model Reports
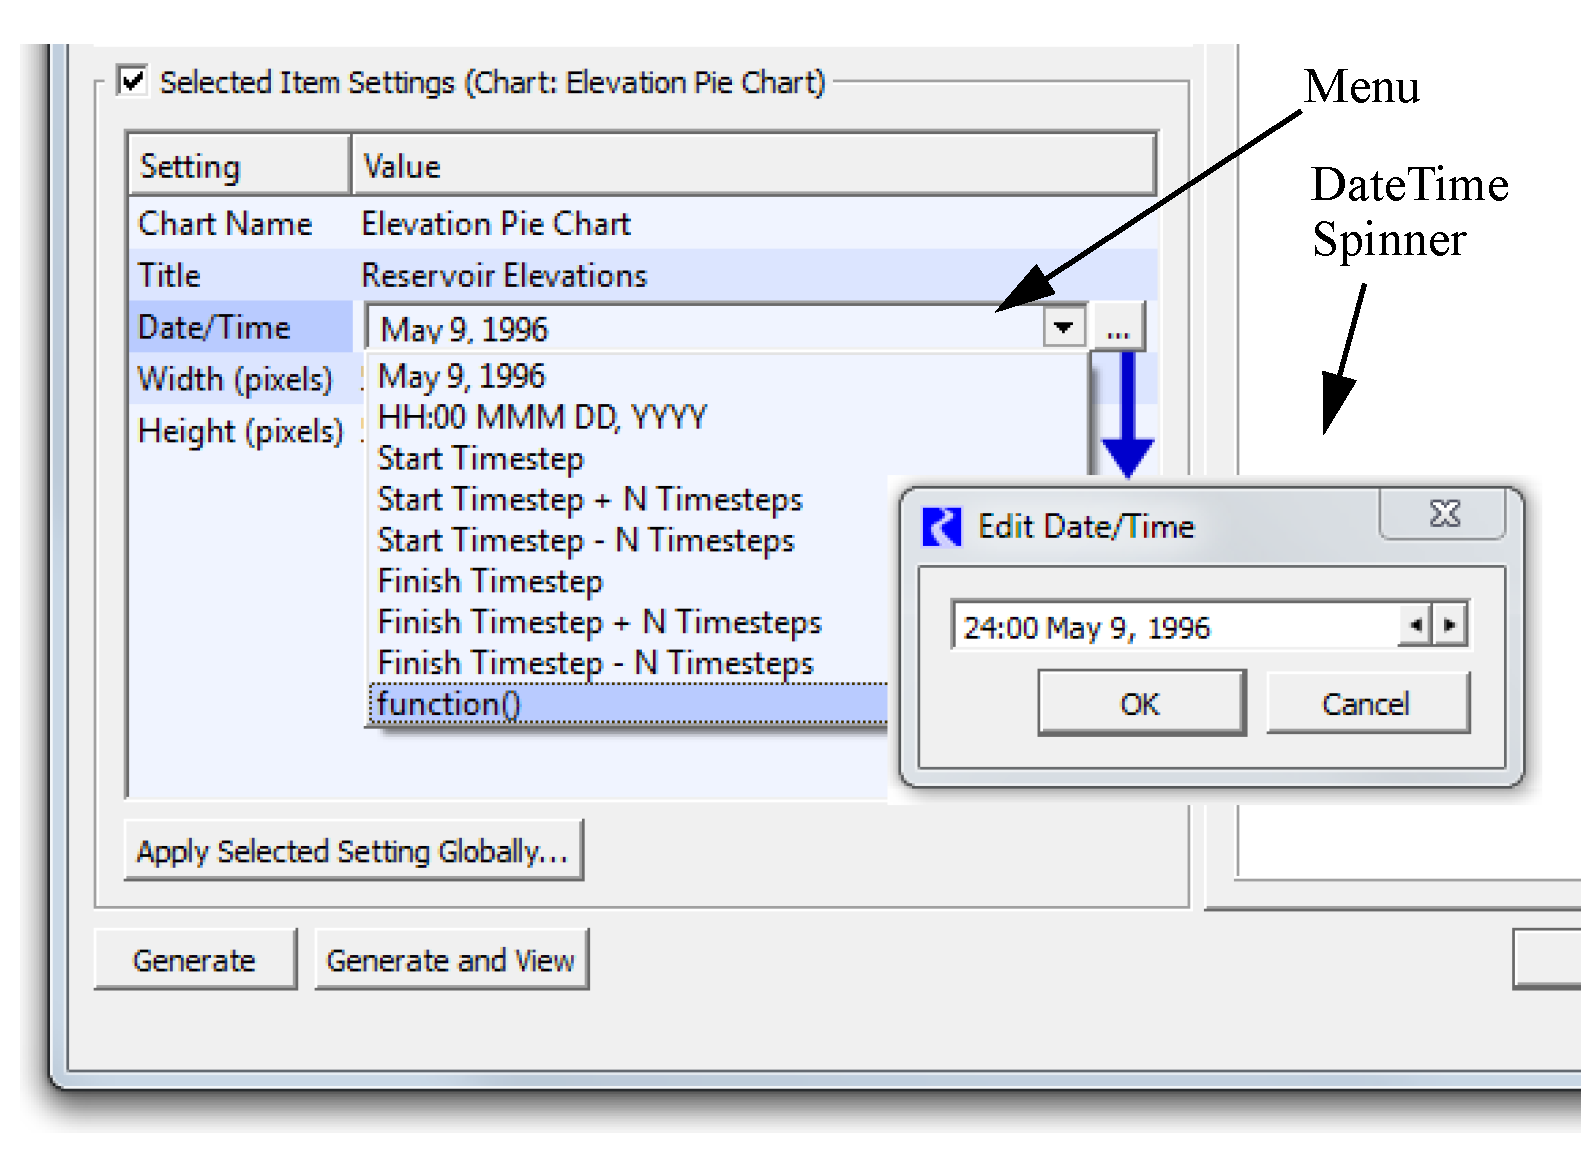
Date/Time Overrides on Output Items
For output devices shown in a Model Report, you can now symbolically specify an override date (or start and end dates). This is possible for the following items within a Model Report:
• Chart
• Output Canvas
• Tabular Series Slot Report
• Plot Page
• Slot item (time series slot plots)
You can specify the dates as absolute dates or symbolic dates using either a common format, a RPL Date/Time or a RPL global function that returns a date/time.
Why use this functionality? Perhaps you have an operations model that is advanced forward in time every day. With these settings, the report can automatically update the output information to show the new operating range without having to manually change the dates.
For more information, see “Date/Time Specification” in Output Utilities and Data Visualization.
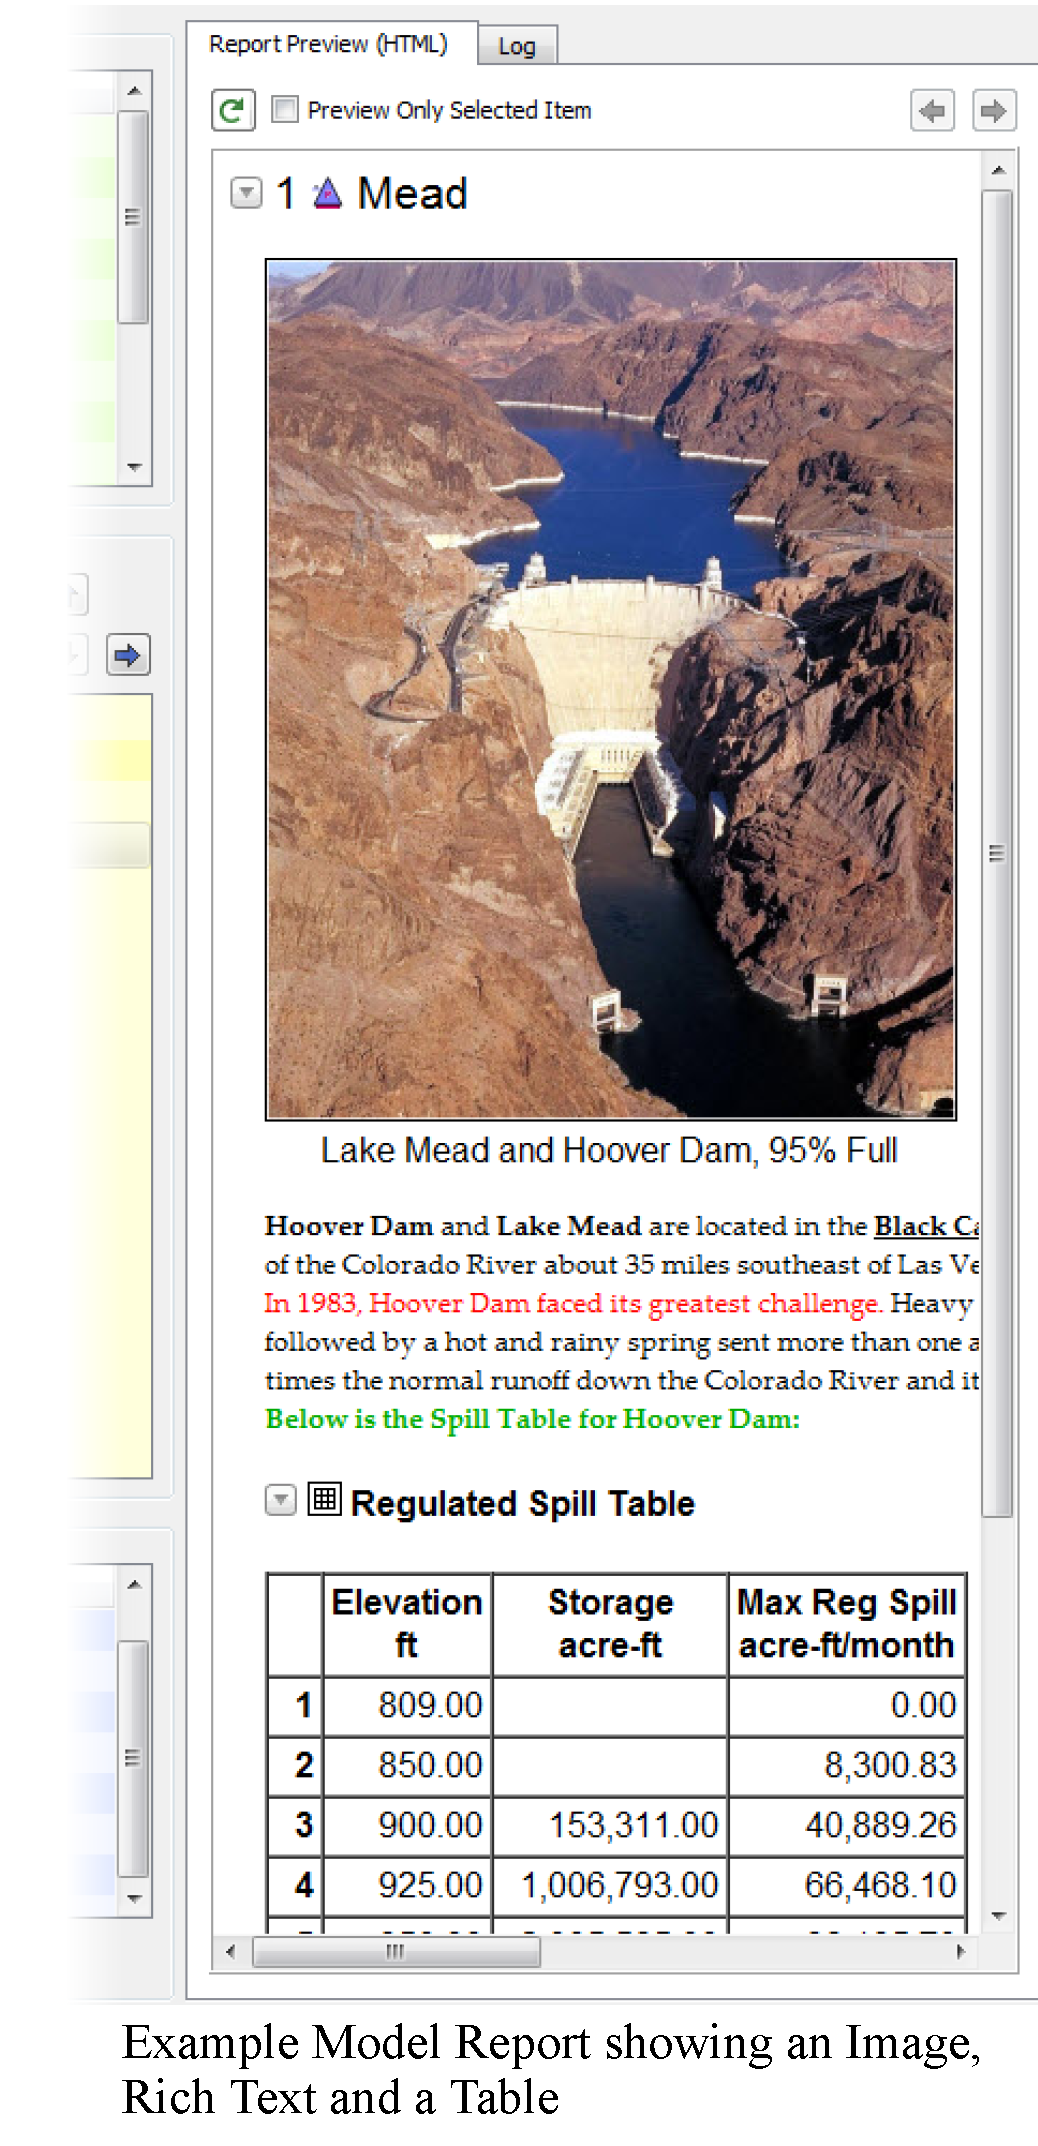
Images in Model Reports
You can now add Image items to a Model Report. The Image item import an Image file (jpg or png), into a Model Report (the image is stored in the model file) and supports an optional caption text string that will be shown below the image in the generated HTML report. Following is an example screenshot.
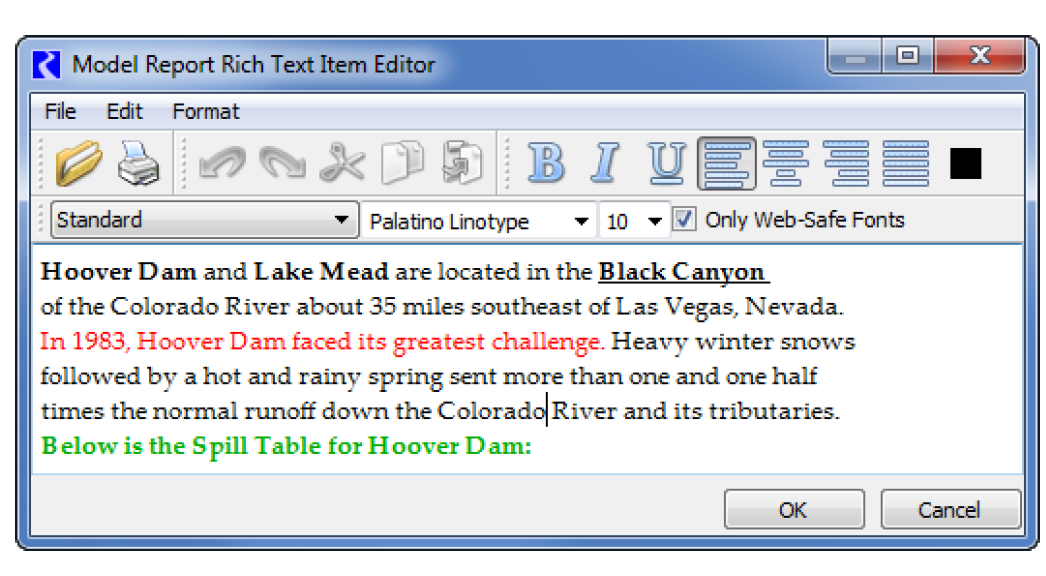
Rich Text in Model Reports
The Model Report Text item now support a Rich Text mode for basic HTML-based formatting. The provided Rich Text editor (shown below) allows you to apply formatting such as bold, italics, font, size, and even bullets and alignment. Further, copied text from external applications, like Microsoft Word, will retain much of their formatting when pasted. This allows you to copy rich text from an external document and paste it into the model report.
Output Canvas
The Output Canvas, described “Output Canvas” in Output Utilities and Data Visualization, allows for visualization of outputs in a spatially distributed way. Previously, you could show teacups, images, and basic text. The following features were added.
Flow Lines
Flow Line Groups and Flow Lines was added to the Output Canvas. Simply, a flow line is a poly-line on the output canvas that is typically associated with a slot value, often the flow in a river. You can configure the flow lines to change width based on the flow compared to other values in the group and change color and line type as the flow crosses thresholds defined on each particular flow line. For more information, see “Flow Line Configuration” in Output Utilities and Data Visualization.
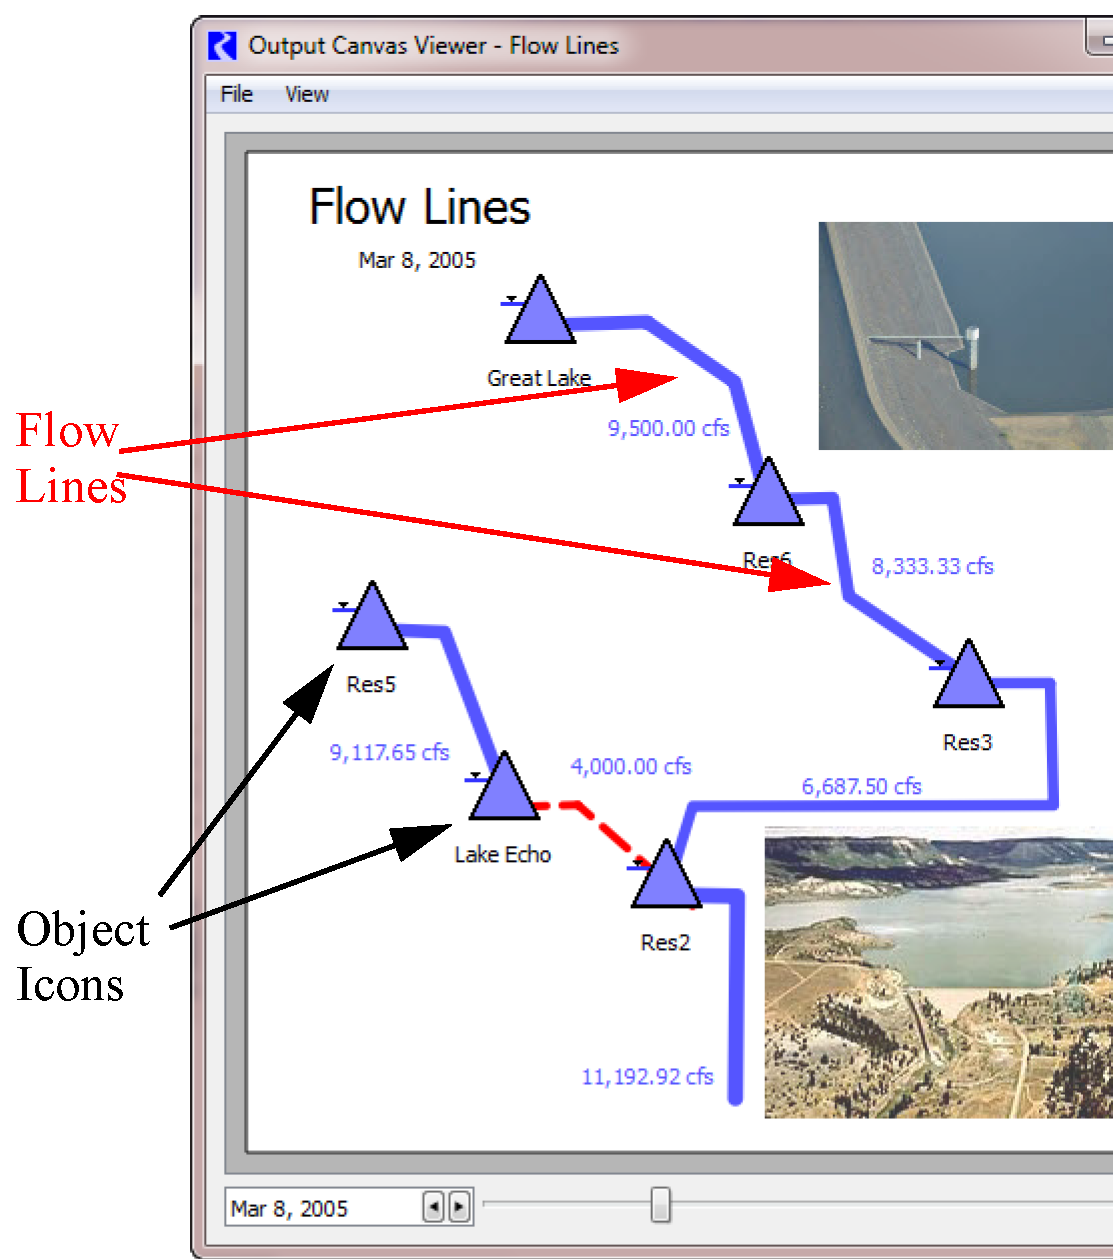
Object Icons
This new type of output canvas graphic object displays the Object Icon associated with a particular simulation object. Object icon groups support optional dynamic text items which can include values of slots on the object or the related data object.
RiverWare Policy Language
Initialization Rules - Setting Scalar Slots
Initialization Rules can now assign values to Scalar Slots along with Series Slots and Table Slots. The structure to set a scalar slot is: Object.ScalarSlot[ ] = <numeric expr>
Predefined Functions
The following RPL predefined functions were added:
Name | Description | More Info* |
|---|---|---|
getEnsembleTraceValue | Returns the value for an ensemble keyword for the current run. | |
getEnsembleValue | Returns the value for a trace keyword for the current trace executing in a run. | |
GetLowerBound | Returns the lower bound for the given slot | |
GetLowerBoundByCol | Returns the lower bound for the given slot and column | |
GetUpperBound | Returns the upper bound for the given slot | |
GetUpperBoundByCol | Returns the upper bound for the given slot and column | |
IsControllerRBS | Returns true if and only if the current controller is Rulebased Simulation or Inline Rulebased Simulation and Accounting | |
OptValueByCol | Returns the optimal value as calculated during the last Optimization run for a given column and date of an aggregate series slot | |
* Links lead to the section in RPLPredefinedFunctions.pdf | ||
The following predefined function names were modified. The previous names will continue to load and be supported, but new instances will use the new names:
• NetSubbasinDiversionRequirement
• SolveSubbasinDiversions
• ToCelsius
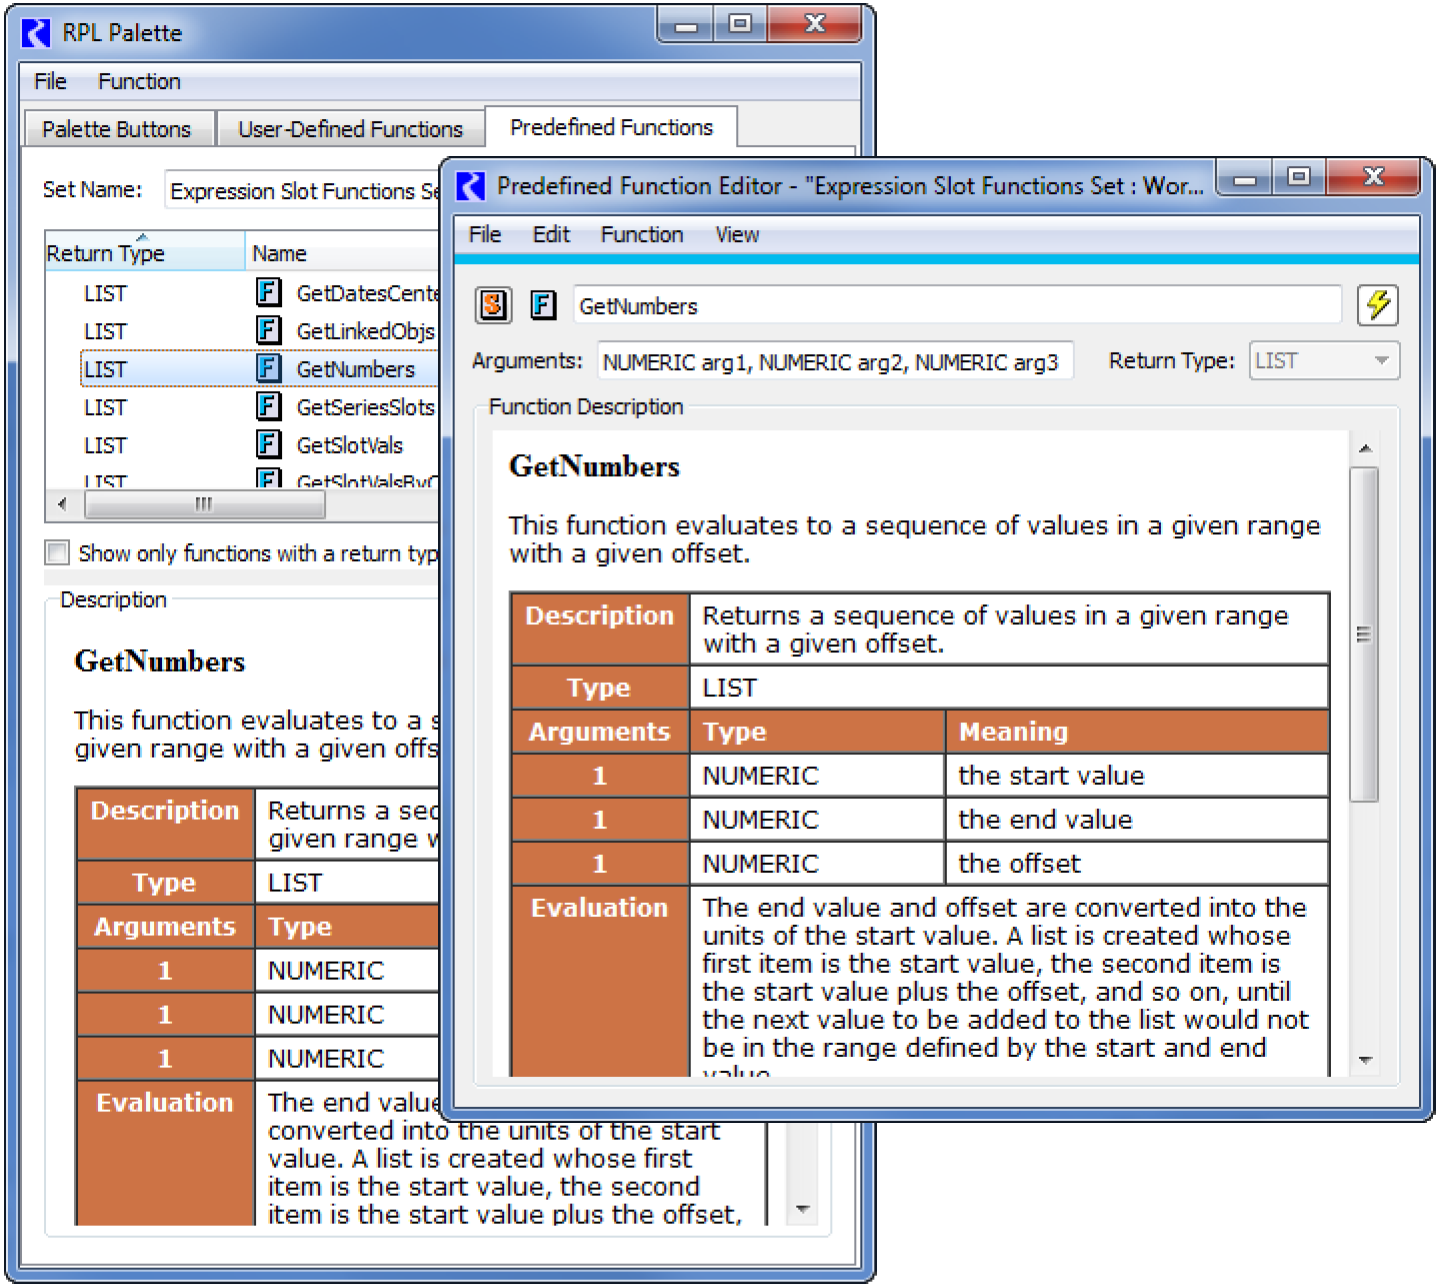
Predefined Function Documentation
The RPL predefined function help content is now shown within the RiverWare interface in the following dialogs:
• Predefined Function Editor dialog. (Below Right)
• RPL Palette, on the Predefined Functions tab. (Below Left)
• RPL Set Editor when Show Predefined Groups and Show Descriptions are checked.
RPL Parameters
The following parameter setting were removed as they no longer incur performance overhead.
• The Collect RPL Set Performance Information checkbox in the RPL Parameters dialog. RiverWare will now always collect performance information.
• The Enable Rules Model Run Analysis checkbox on the Rulebased Simulation Run Control settings. The Rules Model Run Analysis is always enabled.
Script Management
New Actions
The following actions were added:
Name | Description | More Info* |
|---|---|---|
Configure MRM Index Sequential | For the specified MRM configuration, modify the MRM Index Sequential settings. | |
Configure MRM Input DMI | For the specified MRM configuration, modify the Input DMI settings, particularly the repeat count. | |
Configure MRM Output | For the specified MRM configuration, modify the MRM Output settings. | |
Enable MRM Distributed Runs | For the specified MRM configuration, specify whether to distribute concurrent runs to multiple processors on the same machine. | |
Set Excel Dataset Run Name | For the specified Database DMI Excel Dataset, set the run name type and/or specify a new single run name. | |
Set MRM Descriptor | For the specified MRM configuration, set the specified keyword, value pair MRM Descriptor. | |
Set MRM Ruleset | In a given MRM configuration, set a new file path to a ruleset. | |
Set MRM Run Range | Set the time range of the run (i.e. the Run Start and End dates) for the specified MRM configuration. | |
* Links lead to the section in ScriptManagement.pdf | ||
For more information on Scripts, see “Script Management” in Automation Tools.
SCT
Custom Summary Rows
Some Custom Summary Rows (described “Custom Aggregation Rows” in User Interface) aggregation values can be misleading. Now there is an option to right-click on a custom summary cell and Hide Aggregation Value.
Navigation was improved from a Custom Summary Row using a Slot Reference configuration. A context menu operation has been added to the context menu for those SCT cells: Open Custom Summary Slot...
Slots
Import Paste Negative Values from Excel
Negative numbers in Excel can be displayed with parenthesis instead of a negative sign. Previously, during an Import Paste, such values weren't recognized as numbers. With this change, the Import Paste now recognizes these correctly as negative numbers.
Min/Max Changed to Bounds
The semantics for the slot min and max values was changed as follows:
• On Series, the Min Value / Max Value was changed to be Lower Bound / Upper Bound, respectively.
• On table slots, Optimization Min/Max Values (available on certain table slots) was changed to be Optimization Limits for Table Verification, Lower and Upper Limit.
The Configure Slot and Configure Existing (Multiple) Slots dialogs were changed to reflect the new terminology. These bounds and limits are used primarily in Optimization models. In the future, this will be further required.
Finally, warning messages that values are outside of these bounds (Min/max) are no longer posted by default. If you wish to see these warning messages, check the Warn when Values are out of Bounds toggle in the Run Parameters as described “Warn when Values are out of Bounds” in User Interface.
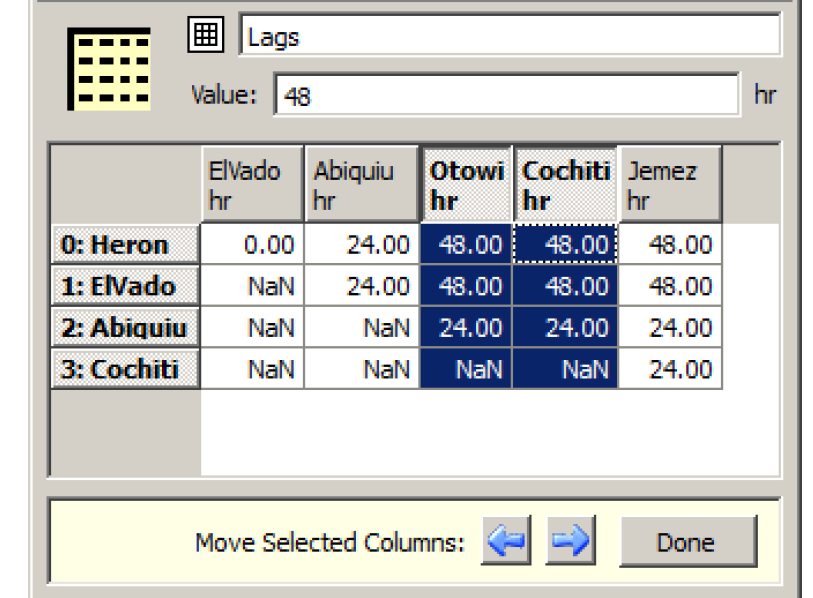
Table Slot - Move Columns and Rows
A new Column Move Columns operation is available for multiple-column table slots and periodic slots on data objects. A new Row Move Row operation is available for multiple-row table slots on data objects
Time Aggregation Series Slots
Time Aggregation Series Slots are documented “Time Aggregation Series Slots” in User Interface. Following are changes made to this type of slot:
Daily Aggregation
Time Aggregation Series Slots can now be used to aggregate hourly, 6hr, and 12hr timestep slots up to a daily aggregation timestep. Thus, daily, monthly, and annual (calendar and water year) aggregation are now supported.
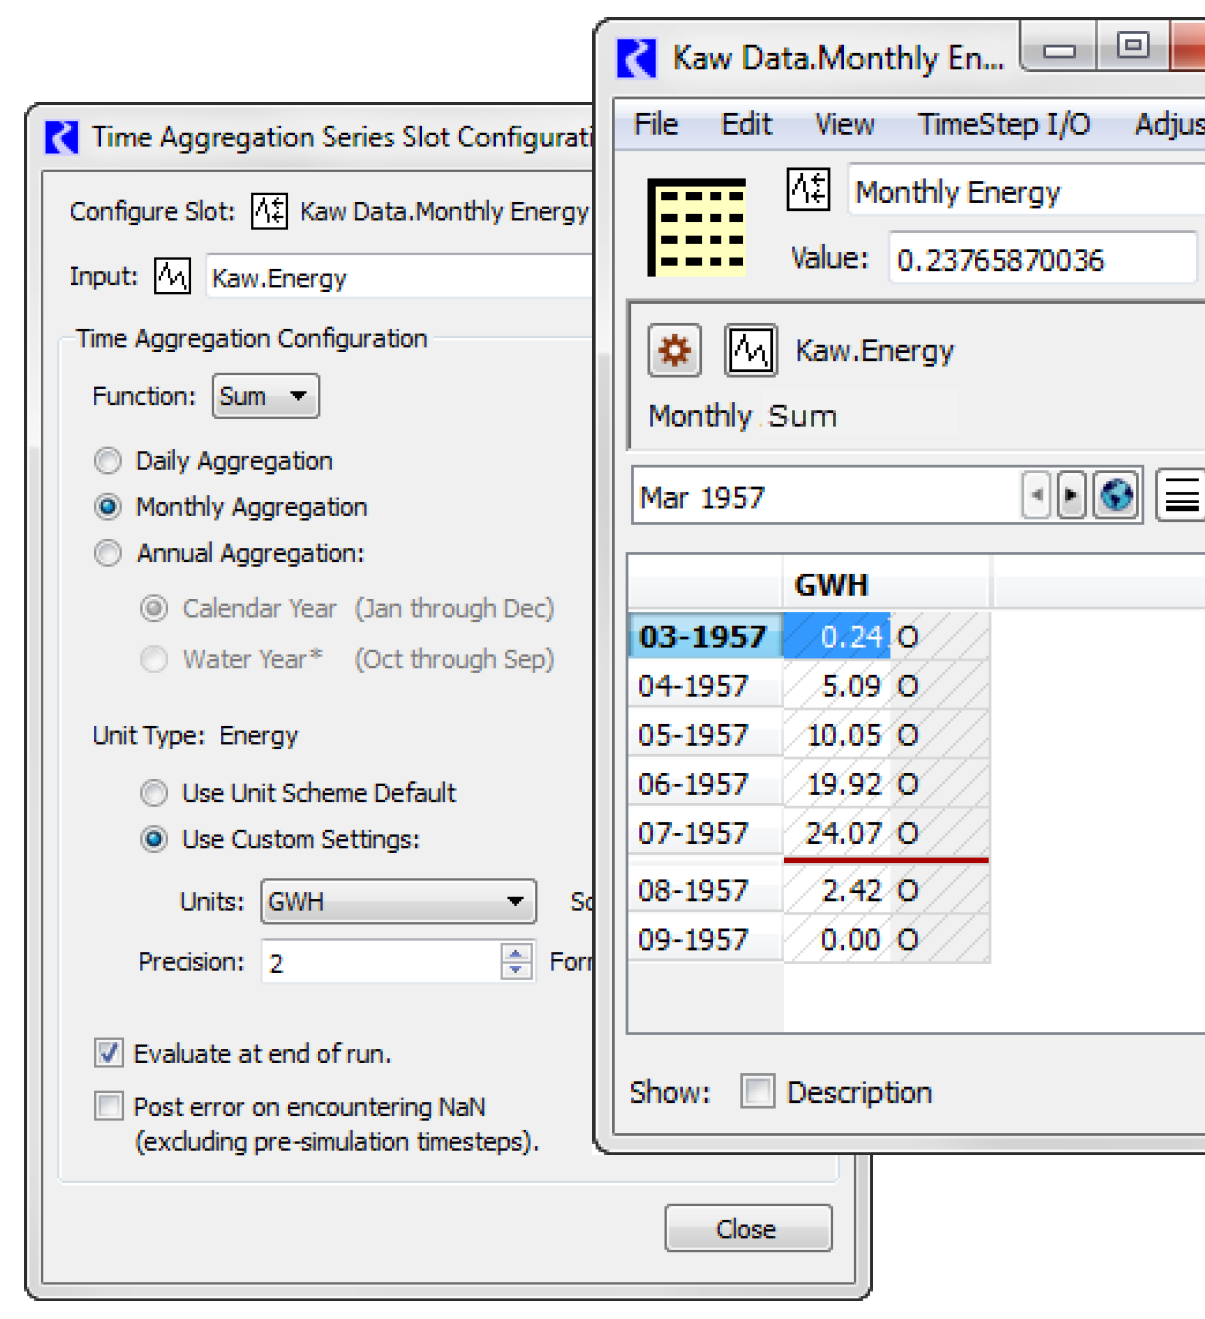
Configuration Dialog
The slot’s aggregation configuration dialog was re-implemented. Now the input slot specification, aggregation function, and aggregation period are all specified in the configuration dialog. This configuration also includes unit specification for better control over the units shown.
Modifications to Aggregation Computations
Time Aggregation Series Slots were enhanced to better calculate averages for monthly flows that are aggregated to an annual timestep. Results for these calculations will change.
In addition, slots with FLOW or VELOCITY unit types (per time and/or rate types) can not use the Sum function as this aggregation does not make sense. The Sum function is no longer available. Instead, use the Ave function and modify the units shown. For example, average daily flows in cfs to monthly flows and show the results in acre-feet/month.
Workspace
Initial Workspace Appearance
You can now configure the workspace appearance when the model is first opened, in terms of the view, zoom, and scroll location. On the workspace, use the Workspace Initial Appearance... menu. The following dialog opens.
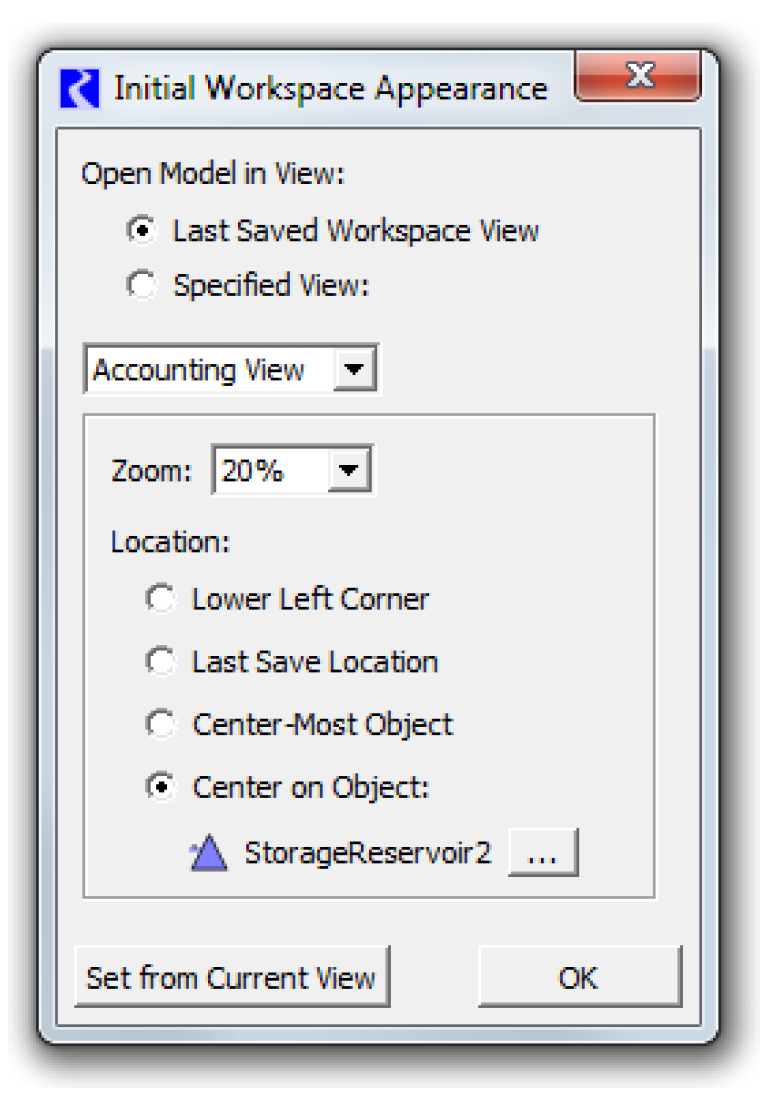
In this dialog, you specify the initial view setting, either the last saved view or a specific view. Then for each view, specify the zoom level and the location at which the model should open. Choices include the
• Lower left corner
• Last saved location
• Center-most object
• Center on object
This functionality applies on model load and provides settings so you can configure the appearance when the model opens.
More information is available “Initial Workspace Appearance” in User Interface.
Closed Bug Reports
The following bugs have been closed for this release. For more information on any bug, see the CADSWES website. The bugs are listed in order by bug number:
3348 | 3609 | 4181 | 4206 | 5476 | 5481 | 5511 |
5523 | 5532 | 5534 | 5537 | 5547 | 5548 | 5557 |
5574 | 5575 | 5576 | 5577 | 5578 | 5579 | 5580 |
5581 | 5582 | 5583 | 5584 | 5585 | 5587 | 5590 |
5591 | 5594 | 5597 | 5600 | 5601 | 5605 | 5606 |
5607 | 5609 | 5611 | 5613 | 5614 | 5616 | 5622 |
5623 | 5626 | 5628 | 5629 | 5630 | 5632 | 5633 |
5634 | 5636 | 5638 | 5639 | 5641 | 5642 | 5643 |
5644 | 5645 | 5647 | 5648 | 5655 | 5657 | 5661 |
5662 | 5663 | 5660 | 5612 |
Revised: 11/11/2019