
Release Notes Version 6.6
Special Attention Notes
Following are special attention notes, indicating that:
• Functionality has changed that requires you to update models, or
• Results may differ.
If you have any questions, contact RiverWare-support@colorado.edu.
Water Quality Method Selection and Names
Water Quality constituent selection and method names were modified. Existing models should be automatically updated. See “Constituent Selection, Method Structure, and Names” for more information.
Reimplemented DSS connectivity
The DSS connectivity was re-implemented to use Java. When installing RiverWare, you are given the choice of whether to install the complete package (with Java) or install only RiverWare (without the Java files).
Note: To use the DSS Database DMIs, you must install RiverWare with Java.
Accounting
Accounting Dialogs - Show Only Non-Zero slots
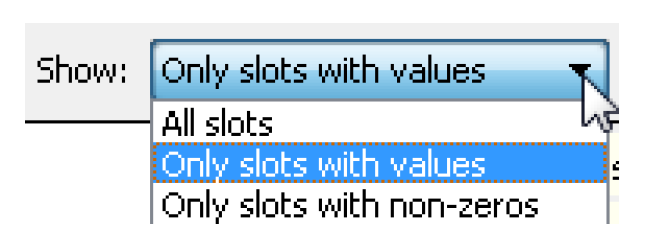
The Object Account Summary and Edit Account dialogs were improved with a Show menu at the bottom of the dialog. The Show menu allows you to specify whether to show:
• All Slots
• Only Slots with values (non NaNs)
• Only slots with non-zeros
See “Viewing Account Data” in Accounting for more information.
Batch Mode
Reorder an Optimization Goal Set
A new RCL command ReorderGoalSet was added. This command allows you to reorder items (goals, groups, or certain statements) within the currently loaded optimization goal set. See “ReorderGoalSet” in Automation Tools for more information.
Data Management Interface
Reimplemented DSS connectivity
The DSS connectivity was re-implemented to use Java. When installing RiverWare, you are given the choice of whether to install the full package (with Java) or install only RiverWare (without the Java files).
Note: To use the DSS Database DMIs, you must install RiverWare with Java.
Other than the installation, there should be no noticeable differences with the java implementation of the DSS connectivity.
Control File-Executable DMIs
Table row label import
A row label can now be imported along with the data into a table slot via a control file DMI. The label must be the first entry in the data file line for the row, and is recognized as a label when the number of items in the row is one more than the number of columns in the table. If there are spaces in the label, it must be surrounded by quotes to be recognized as a complete label item.
Control Files allow Quoted Values
DMI Control Files now support quoting of values, typically to embed spaces in file paths. For more information, see “Control File” in Data Management Interface (DMI).
BigRes.Pool Elevation: file="C:\Data\BigRes.Pool Elevation"
The DMI must be configured to allow spaces in file paths.
Model Files
RiverWare Model Package Functionality
A “package” file can now be created from RiverWare that contains
• A model file
• Multiple SCT files
• Workspace image files
• RPL sets, (rulesets, optimization goal sets, and global functions sets).
The package file allows all of these file types to be easily moved together as a single file. For more information, see “RiverWare Packages” in User Interface.
Multiple Run Management
netCDF and CSV output from MRM
MRM can now output per-run NetCDF files and comma-separated value (CSV) files. Both new Output types are configured in the Output tab of the MRM configuration dialog. CSV files are formatted for direct use in the Tableau data visualization software. For more information on CSV output, see “CSV Files” in Solution Approaches. For more information on netCDF output, see “NetCDF Files” in Solution Approaches.
Object Interface
Object Attributes
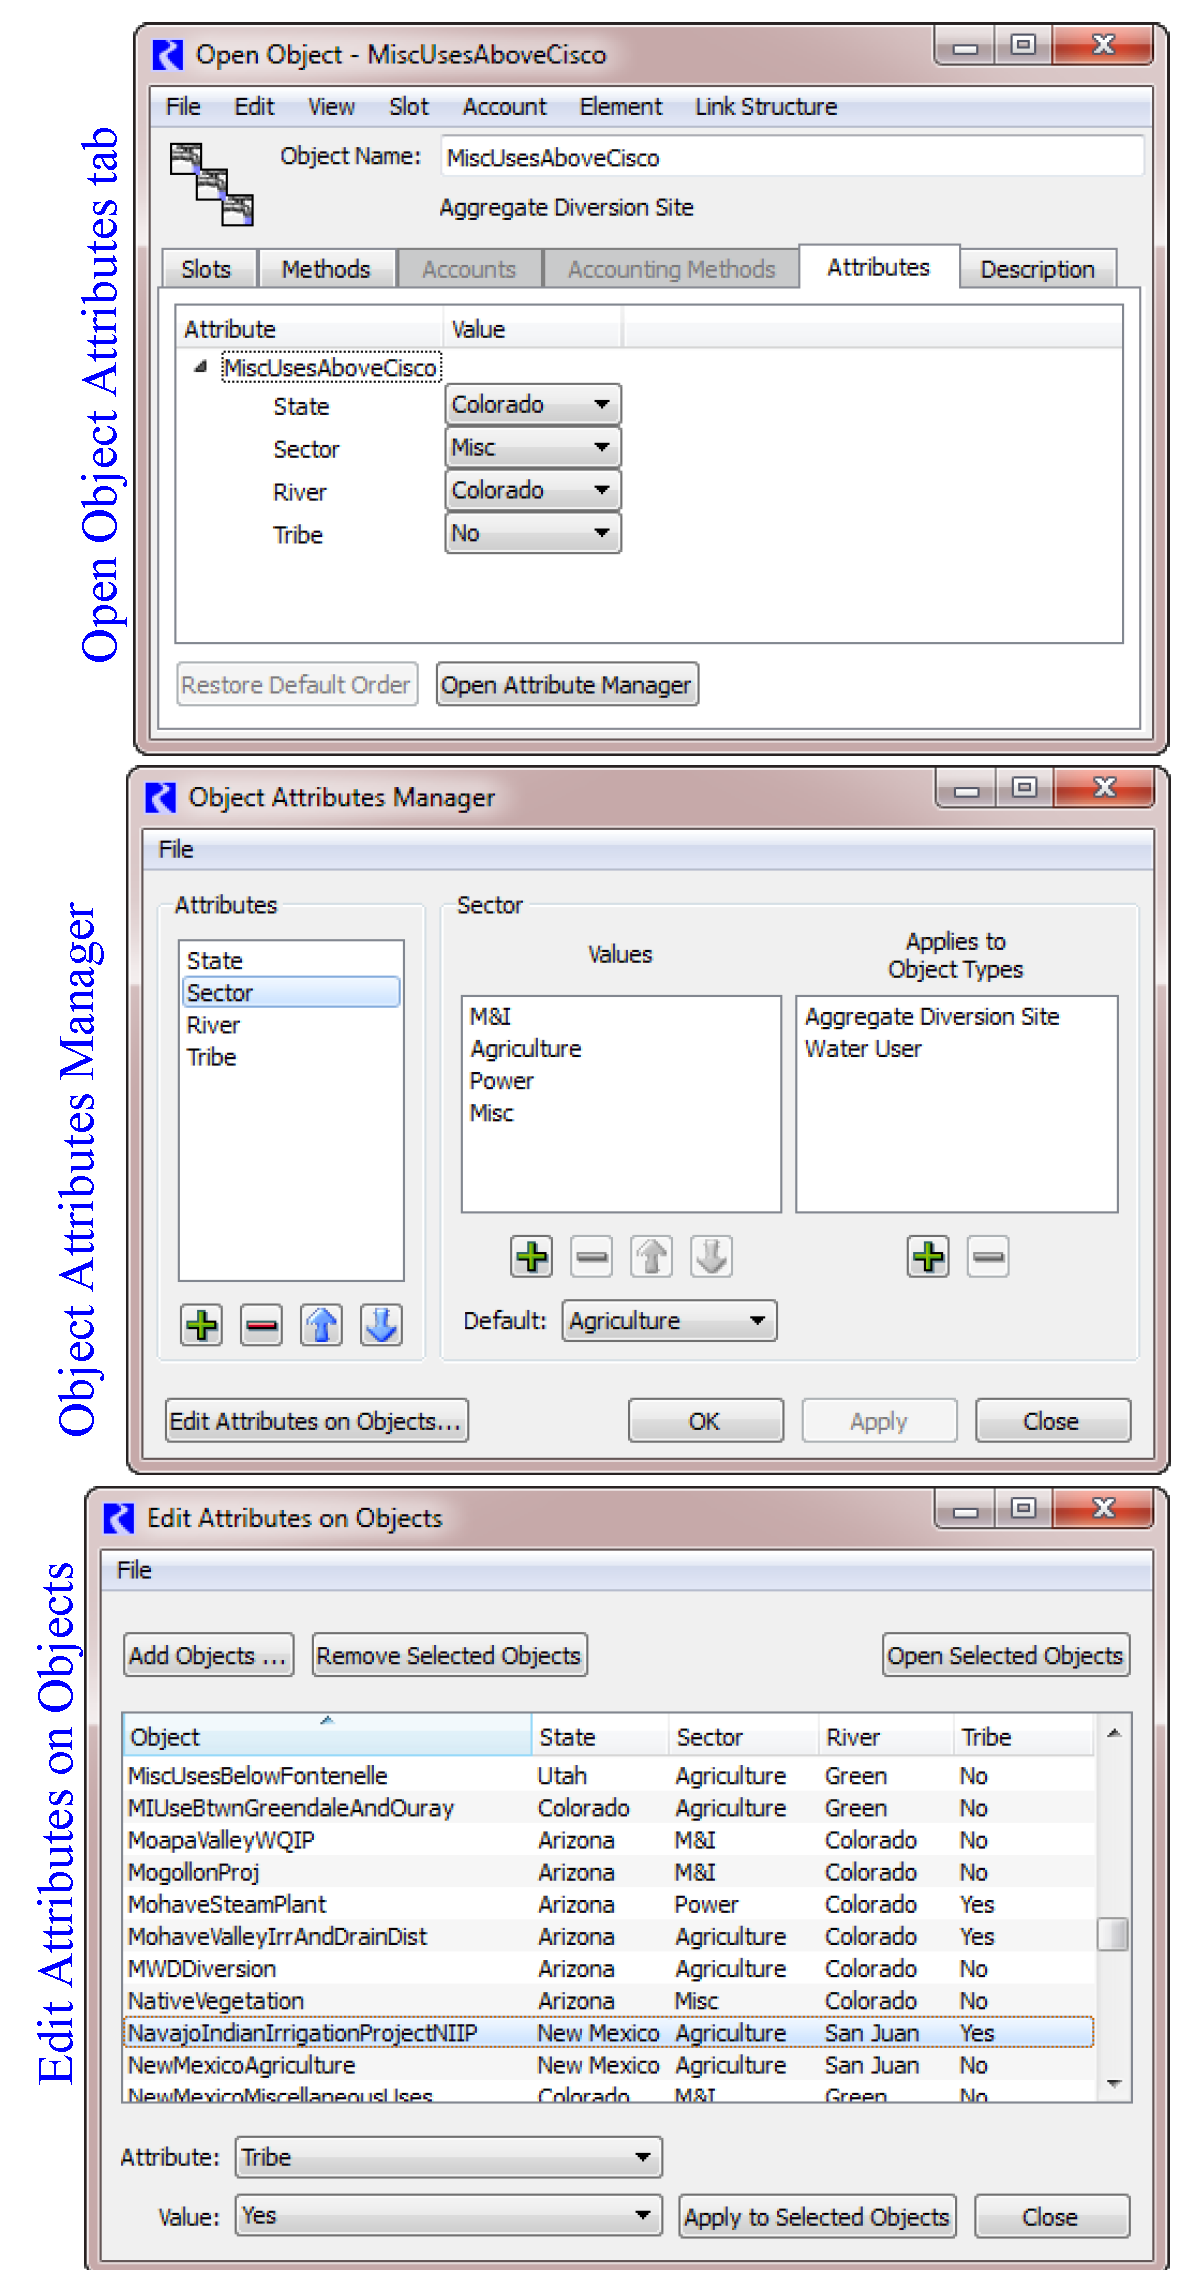
Object Attributes are user defined Object meta data that allow you to define an Attribute for one or more types of objects. You then define values and assign those value to specific objects. For example, you might have 300 water users in your system. With this functionality, you can define, for example, a “Sector” attribute and a “State” attribute. Then you can specify for each water user, its Sector, i.e. Municipal, Industrial, or Agricultural, and its State, i.e. “CO”, “NM”, “TX”, etc. Each Attribute and Value is user defined and customized, both the text that you use and which objects types and specific objects to which they apply.
Attributes are displayed on each Open Object dialog on a new Attributes tab (top image). You manage the model’s attributes through the Object Attribute Manager (middle image). You can view, assign and organize attributes on multiple objects using the Edit Attributes Dialog (bottom image).
For more information, see “Object Attributes Manager” in User Interface.
Objects
Inline Power Plants
The Inline Power Plant object’s calculation for the Flow Tables method was modified. Now the Power Plant Cap Fraction is applied to both the Turbine Release and the computed Power when the flow is above Max Turbine Release times the Power Plant Cap Fraction. It is not applied when the flow is less than Max Turbine Release times the Power Plant Cap Fraction. This change affects only Inline Power Plants using the Flow Tables method. See “Flow Tables” in Objects and Methods for more information.
Level Power and Storage Reservoirs
Unregulated Conditions
For some users, it is necessary to compute the flows in the basin that would have existed if reservoirs were not in place. To meet this need, the Pass Inflows method in the Disable Reservoir Processes category was created: The Pass Inflows method as described “Pass Inflows” in Objects and Methods does the following:
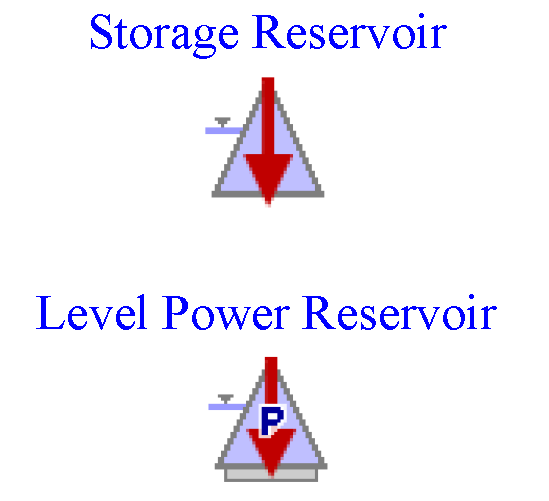
• Changes the Workspace Icon: When this method is selected, the icon on the workspace is modified to indicate the Reservoir is not calculating storage as shown to the right.
• Enables an alternative dispatch method: When this method is selected, only the Outflow Equals Sum of Inflows dispatch method is available. This dispatch method sets the Outflow = Σ Inflows and does no further physical process modeling.
Using scripts (or manually), you can make a model run of your system with the reservoirs in place and executing all the operating policy (rules), then select these methods and re-run the model to get the unregulated conditions. Snapshots can be used to preserve the results between runs. This process and additional information on these methods can be found “Modeling Unregulated Conditions” in USACE‑SWD Modeling Techniques.
Water User
Methods were added to track the Soil Moisture on the Water User object and meet any remaining depletion requests with soil moisture. The new methods are:
• Irrigation Requests with Soil Moisture in the Diversion and Depletion Request category: This method computes the diversion and depletion request to meet irrigation demands and refill the soil moisture. See “Irrigation Requests with Soil Moisture” in Objects and Methods for more information.
• Proportional Shortage with Soil Moisture in the Return Flow category: This method computes the amount of water used from the diversion and from the soil moisture. A new soil moisture volume and return flow are computed. See “Variable Efficiency with Soil Moisture” in Objects and Methods for more information.
• Supplement Diversions including Soil Moisture in the Conjunctive Use category: This method computes the supplemental water required and then tries to meet that request. If there is surplus supplemental water, then it can be used to refill the soil moisture. See “Supplement Diversion including Soil Moisture” in Objects and Methods for more information.
Optimization
Power Reservoir
Power Surface Approximation method
The new Power Surface Approximation (PSA) method was added to the Optimization Power category. The method allows for the modeling of dynamic Operating Head to be incorporated into Optimization Power modeling. The method introduces a new variable, PSA Head Factor, which represents the weighted contributions of Storage, Spill and Tailwater Base Value (if applicable) to Operating Head. The method generates a set of planes to constrain power as a function of Turbine Release and the new PSA Head Factor. The method provides a significant improvement in the Power approximation error for projects that exhibit a wide range of Operating Head over the course of the run. Full documentation of the new method can be found “Power Surface Approximation” in Optimization
Optimization Reserves Category and Method
A new category, Optimization Reserves, was added to Power Reservoirs. The category is dependent on the Optimization controller being selected and either Plant Power Coefficient or Plant Efficiency Curve being selected in the Power category. The new Constraint Based Single Timestep method in the category allows users to account for power reserve requirements in the optimization policy. The method introduces a set of duplicate variables that represent the value of standard variables assuming full deployment of either upward or downward reserves. In the RPL Optimization Goal Set, the users can then write parallel constraints using the duplicate reserve variables for any constraint that cannot be violated while deploying reserves. The purpose of the new variables and their parallel constraints is so that the only reserves that are credited to a hydropower project are those that can actually be reasonably deployed. In other words, it will not “count” reserves that could not be deployed without violating specified constraints. The new method also introduces new variables for upward and downward reserves, which allow the user to write policy on the reserves themselves, for example, minimum reserve requirements at individual reservoirs or total system reserve requirements. Full documentation of the new method can be found “Optimization Reserves” in Optimization.
Output, Plotting, and Model Reports
Model Reports
Model Reports “Model Report” in Output Utilities and Data Visualization allow you to generate a customized HTML document describing various aspects of a model including the configuration, RPL policy, slots, and plots.
Optional PE/Storage column
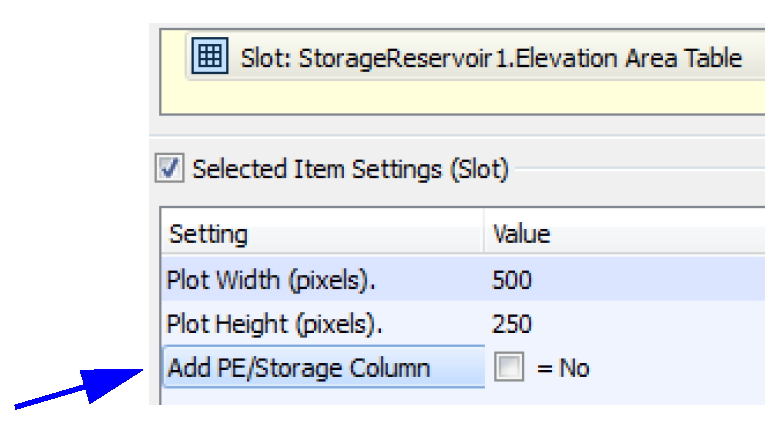
The Model Report’s Slot item displays a table slot’s values as delimited data in the HTML report. For slots like the Elevation Area Table slot (Pool Elevation vs Area), it also shows a column of Storage values that corresponds to each Pool Elevation. This Storage was unconditionally shown. Now there is a setting in the Slot item to specify if you want to see this extra column of data. Use the Add PE/Storage Column to disable showing the extra information.
Output Canvas and Teacups
An Output Canvas is a new output device which shows spatially distributed output information. In the initial implementation, you can create Teacups that show, for example, the current reservoir storage against the reservoir’s full storage. On the teacups you can show marker lines representing important levels and text providing slot values or other useful information. In addition, you can add a legend to annotate the teacups and images representing a map or photos of the reservoir. You can animate the teacups as they change through the run period and export the canvas to an image file.
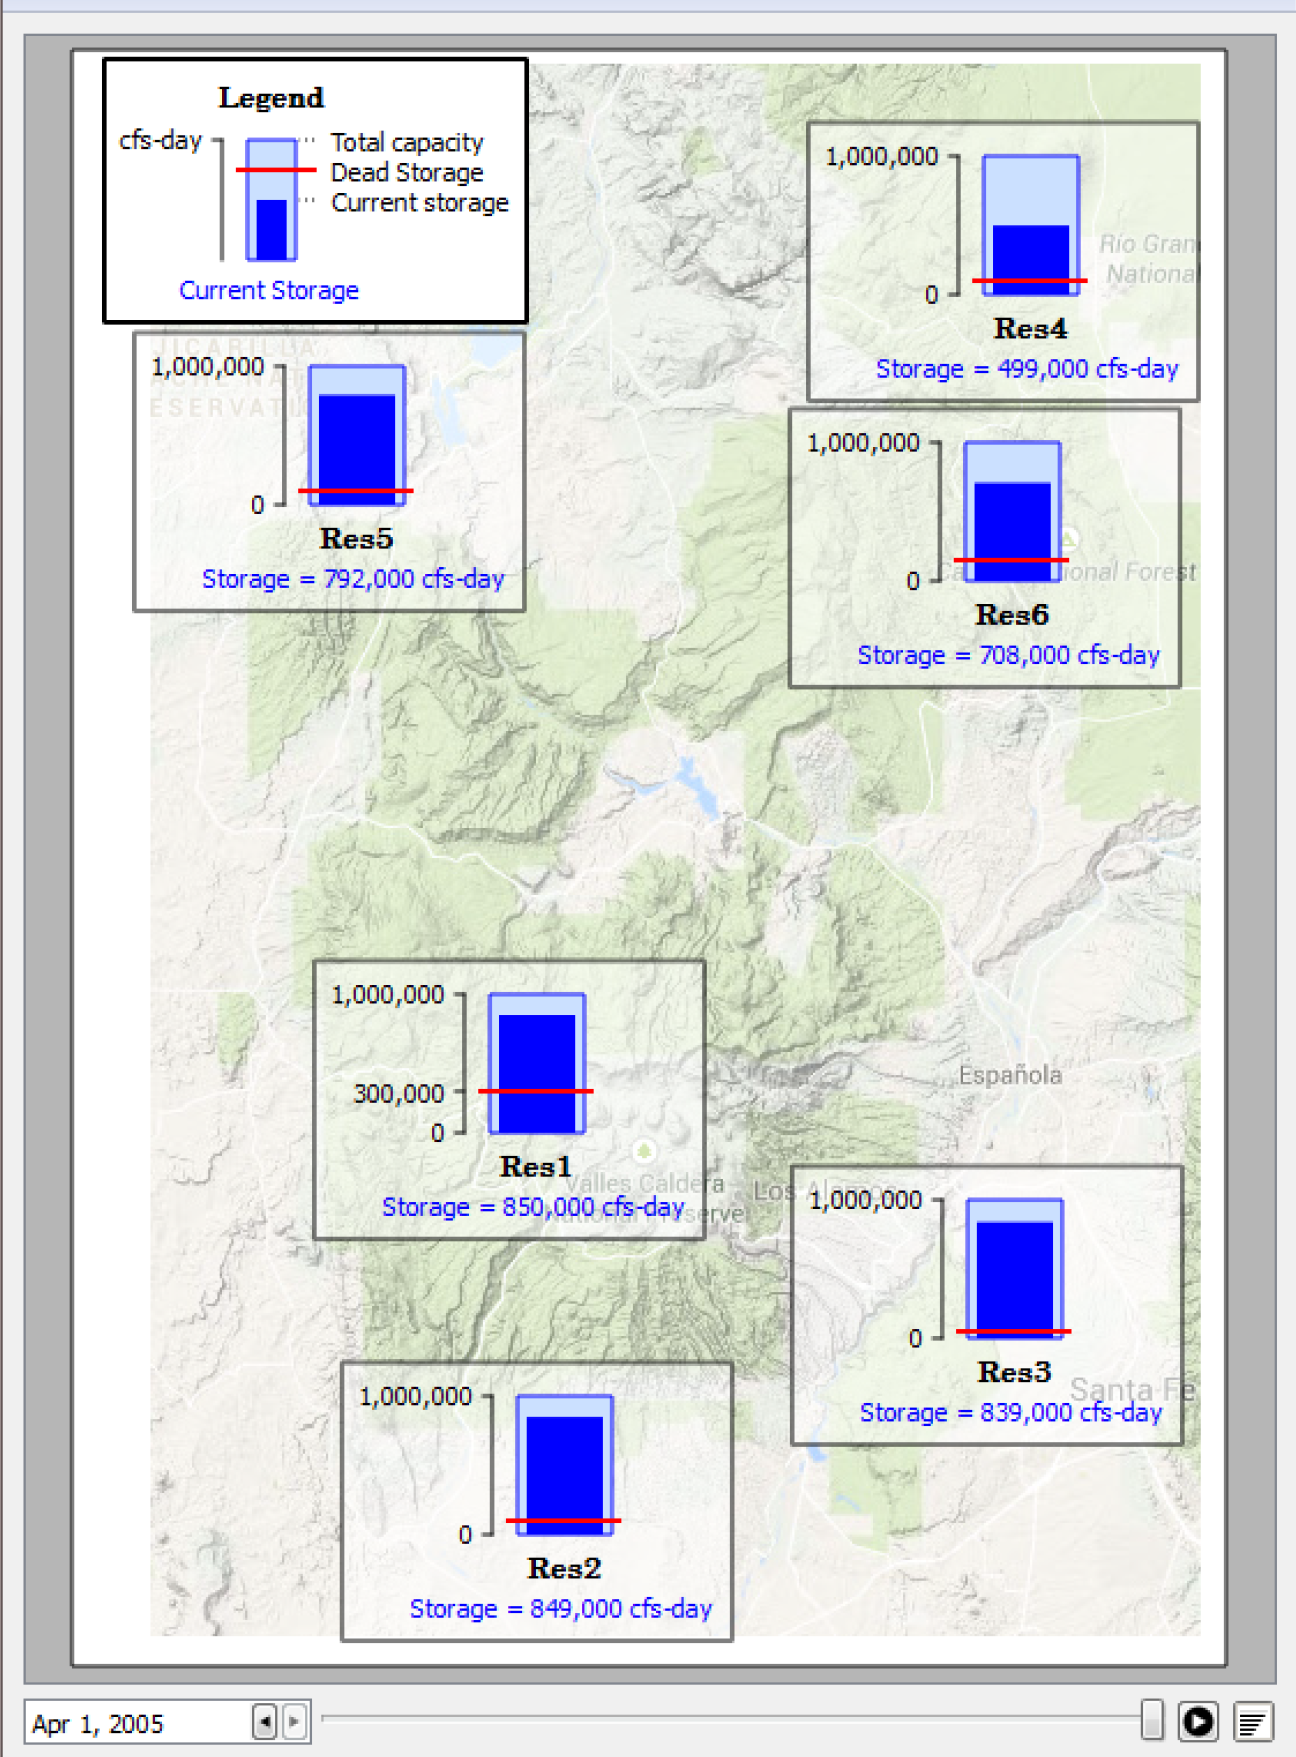
For more information, see “Output Canvas” in Output Utilities and Data Visualization.
Plotting
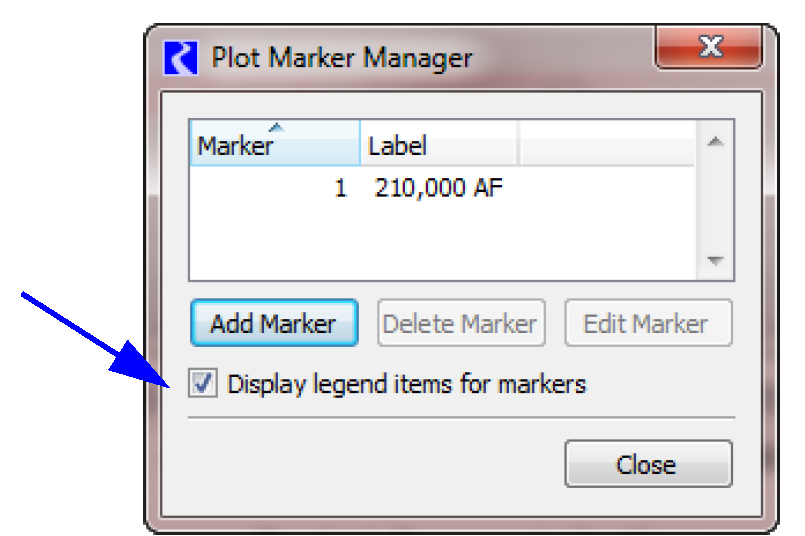
Show Markers in the Legend
You can now show Markers as an item in the legend. In the Plot Marker Manager, shown to the right, use the Display legend items for markers check box.
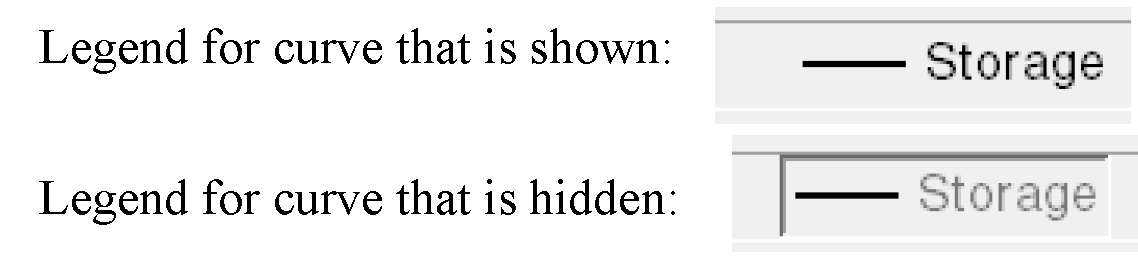
Toggle off curves on a graph
In the graph legend, you can now left-click on an item to temporarily hide the curve. When hidden, the legend item is shown in a disabled state. When the plot is saved, this disabled setting is preserved for future use in the same session, but not saved to the model file. When you open a saved model, all curves are shown regardless.
Finally, as part of the above change, the context menus on the legend items have been moved from the left-click to the right-click. This is more standard and intuitive.
Plot Print Preview and Margin Settings
A plot print preview was added as an option from the File Print Preview menu. Within this preview, you can also configure the page layout including page margins. Use the page setup button to access the margins:

For more information, see “Print Preview” in Output Utilities and Data Visualization.
RiverWare Policy Language
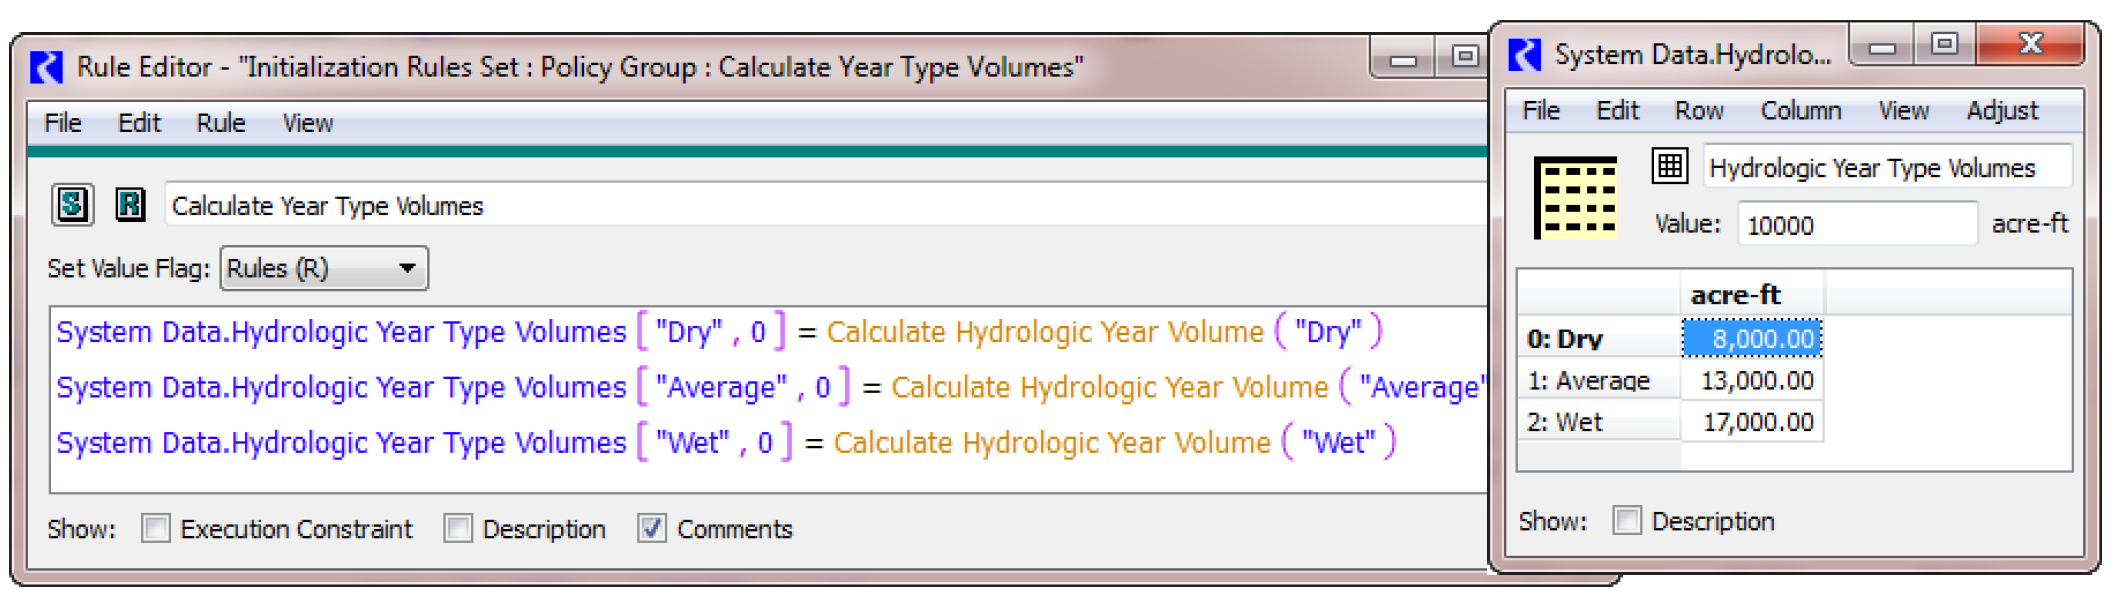
Initialization Rules - Setting Table Slots
Initialization rules can now set Table Slot values. For more information on Initialization rules, see “Initialization Rules” in Solution Approaches. The following screenshot shows an initialization rule that is setting three values on the accompanying table slot.
Predefined Functions
The following RPL predefined functions were added to support Object Attributes (“Object Attributes”:
• ObjectAttributeValue: Returns the value (as a string) of the specified attribute on the specified object. See “ObjectAttributeValue” in RiverWare Policy Language (RPL) for more info.
• ObjectHasAttributeValue: Return a boolean of whether the particular object has the specified attribute value. See “ObjectHasAttributeValue” in RiverWare Policy Language (RPL) for more info.
• ObjectsFromAttributeValue: Return a list of all of the objects that have the specified value for the specified attribute. See “ObjectsFromAttributeValue” in RiverWare Policy Language (RPL) for more info.
In addition, the RPL function SolveTurbineRelGivenEnergyInflow was improved to work with more of the power methods. This function returns the turbine release necessary to meet the specified energy and inflow. If the energy cannot be met, the maximum turbine release is returned. The function correctly deals with Plant Power Limit, Power Plant Cap Fraction, and other constraints, as applicable to the chosen power method.
RPL Statement Names
It has previously been possible to give RPL statements names. To do so:
• In the RPL set editor select View Show Statements
• Select a statement in the RPL set
• Right-click, select Rename and enter a new name
Now, these names persist across a save/load of the set. In addition, the now all statements have their type as the default. You can change the name and that will be saved, otherwise the name will be the default. This represents a change in behavior and a loss of one functionality and a gain of other functionality.
Now that RPL statements can be named, the RPL Search and Replace dialog does match on RPL statement names.
Performance Improvement in RPL
A performance improvement was made within RPL evaluation when looking up slots on the workspace. Now the slot is cached and is referenced in future look ups. In one test model with many slot look ups, this improvements reduced run times by approximately 10%.
Script Management
For more information on Scripts, see “Script Management” in Automation Tools.
Changes to Existing Actions
Memo action
For the Memo action, a new setting, “Pause Execution” was added to control whether or not memo execution pauses script execution. A new setting, “Show Explanation in Dashboard”, was added to control whether or not the memo's explanation text is included with the memo name in the dashboard. The name of the setting “Show Explanation Dialog” was changed to “Show Memo Dialog”.
Set Method
The Set Method action was modified to operate on a selection of objects instead of a single objects. This allows you to set many objects’ methods with one action.
Save Model Action
A “Confirm Overwrite” setting was added to Save Model actions. If the value of this setting is true and the file already exists when the action is executed, the user is presented with a dialog and asked what they would like to do: replace the existing file, ignore the action, or abort script execution.
New Actions
The following actions were added to the script manager.
Reorder RPL Set
Reorder a RPL set according to the values defined in a Table Slot.
Enable RPL Item
Turn on or off a RPL item like a Rule, Goal, or a Policy Group.
Create Snapshot
Create a Snapshot of the specified slots and give it the specified name. Settings allow you to specify whether to overwrite existing snapshots.
User interface Changes
The following changes were made to the Script Manager, Editor, and Dashboard for usability:
• When editing check boxes, the change is applied when a click is made elsewhere.
• Improved combo-box editing of settings
• Script execution progress bars are not re-set when the script execution ends.
• Improved selection of output device settings.
• Making edits in the edit dialog is now disabled when the script is executing.
• On the Dashboard, menu actions were added to Enable All Actions and Disable All Actions.
• Vertical space was added between the actions in the script.
Improved Error and Warning handling
The following changes were made to improve errors that occur within an action:
• If an error occurs during script execution, the script halts execution.
• Execute DMI actions now deal with warnings from DMI invocation.
• Synchronize Objects/Slots actions now abort if the set of objects/slots is empty.
• Improved error reporting in batch execution was added (aborted execution was not reported as an error in diagnostics)
SCT
Series Sheets
It is now possible to create multiple series slot sheets on a single SCT. These sheets are configured by adding new “Sheet Dividers” to the SCT on the Edit Series Slot List tab. Each divider/sheet can be renamed as desired. There is always an “All Slots” sheet.
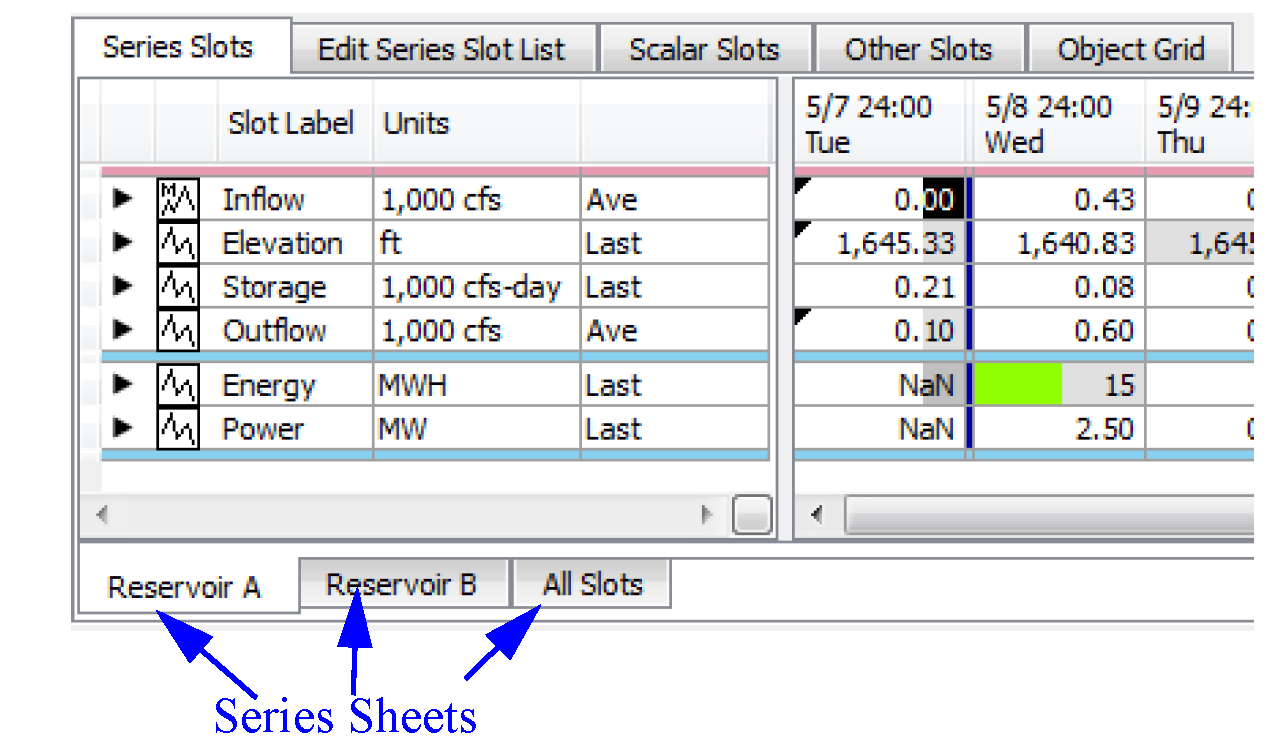
For more information, see “Dividers” in User Interface.
Custom Time Aggregation Summary Rows
You can now add custom time aggregation summary rows when in time-aggregated, vertical timestep view (where slots are columns). You can specify one or more custom Summary Rows at the end of each time aggregation.The following example has eight custom rows (including dividers as the first and last custom summary rows).
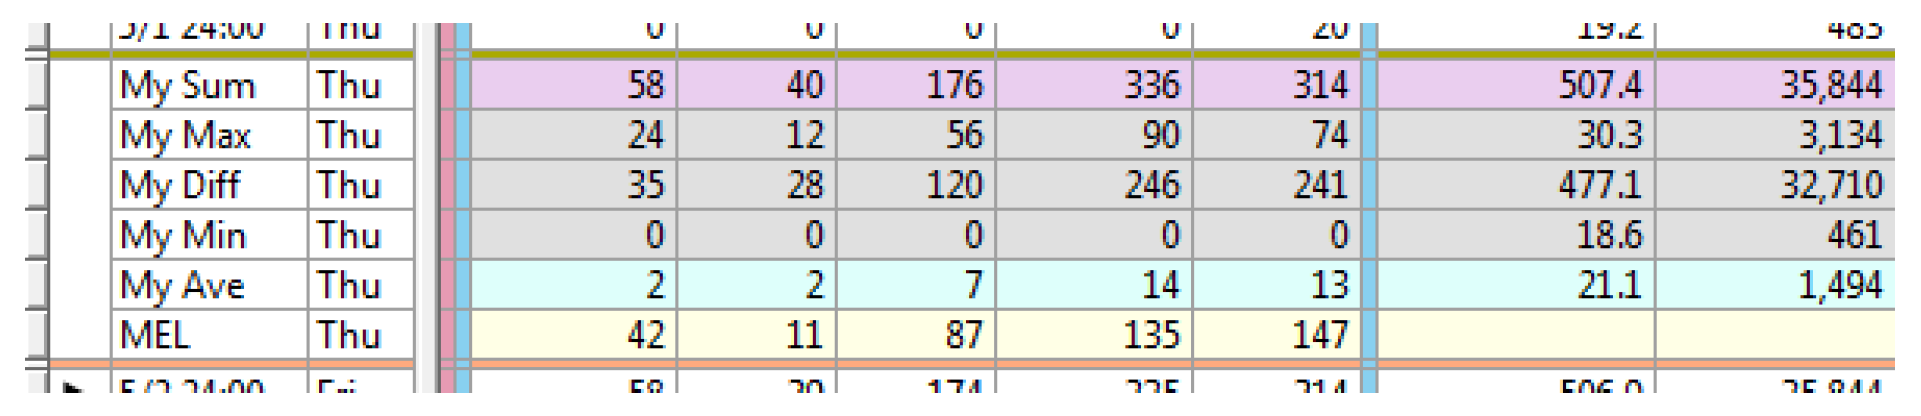
For more information, see “Custom Aggregation Rows” in User Interface
Navigation from the Diagnostics Output
From the Diagnostic Output window, there is now a right-click menu to Scroll Open SCT’s to Context. When selected, this navigates any open SCTs to the context timestep and slot/object whenever possible.
Water Quality
Constituent Selection, Method Structure, and Names
The selection process for Water Quality parameters was moved from the Run Control parameters to the objects themselves. Now each object that models water quality has a user selectable method. On aggregate objects, the aggregate usually controls the methods and links on the elements, so the methods are not shown on the elements.
With this change it is now possible to mix constituents and solution approach within a model. For example, you could model well mixed salinity on most objects, but use a layered approach to model salinity and temperature on a single reservoir.
In addition, the water quality method names were modified to be more intuitive. The term Layered is still used on reservoirs and groundwater objects where there is layering. Discretized is used on reaches. Other objects have methods called “Propagate” indicating that the water quality information is passed through.
All existing models should update automatically without any user changes.
For more information, see “Water Quality Overview” in Water Quality.
Run Analysis for Water Quality Dispatching
The Model Run Analysis tool was improved to show Water Quality dispatching information. When Water Quality is enabled, a toggle is shown in the upper part of the Model Run Analysis tool. When checked, information on the water quality dispatching is shown instead of the usual simulation dispatching. This information is also shown on the Dispatch Details dialog.
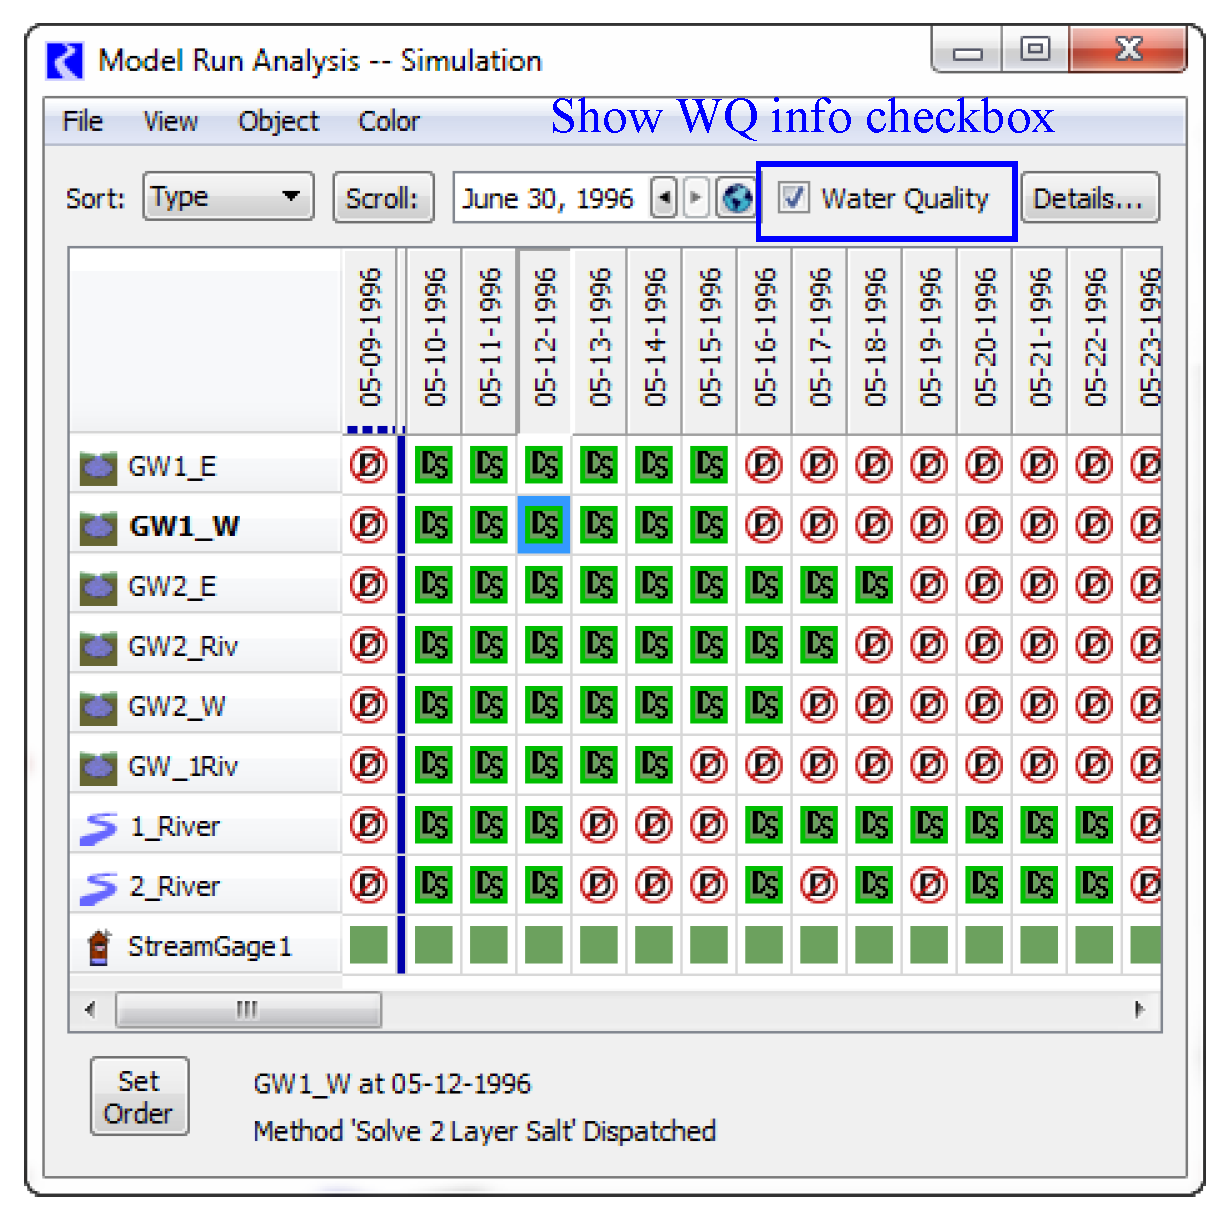
For more information, see “Viewing Water Quality Dispatch Information” in Water Quality
Closed Bug Reports
The following bugs have been closed for this release. For more information on any bug, see the CADSWES website. The bugs are listed in order by bug number:
4956 | 5362 | 5481 | 5498 | 5524 | 5525 | 5526 |
5527 | 5528 | 5530 | 5531 | 5533 | 5536 | 5538 |
5539 | 5540 | 5542 | 5543 | 5544 | 5545 | 5546 |
5550 | 5551 | 5552 | 5553 | 5555 | 5556 | 5558 |
5559 | 5560 | 5562 | 5564 | 5566 | 5567 | 5573 |
Revised: 11/11/2019