
Plotting
The following changes were made to Plotting.
Quick Plots
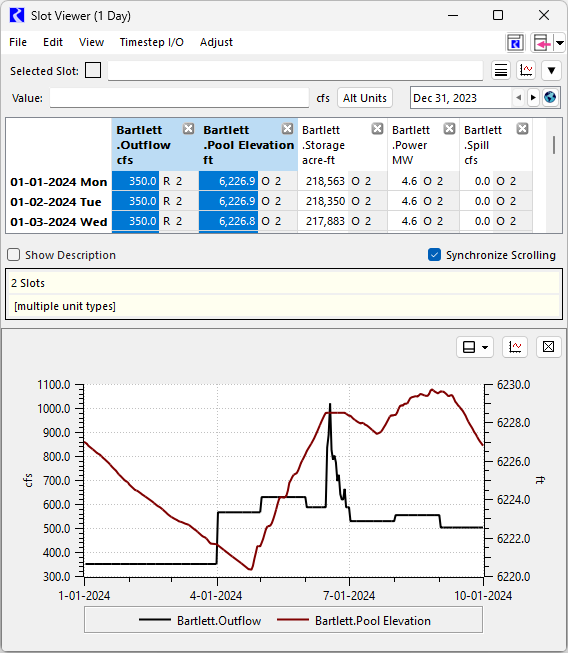
The new Quick Plot can be displayed in many top-level windows that have data that can be plotted. The Quick Plot panel displays a single plot of the selected slots. As you change the slots selected, the plot will change to plot that data.
Figure 1.6 Slot Viewer (Series) with the Quick Plot panel shown on the Bottom.
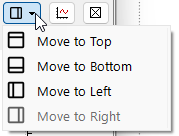
Specify the relative location of the plot within the larger window by selecting top, bottom, left or right (see Figure 1.7).
Figure 1.7 Select Quick Plot location
Multiple slots can be plotted on one plot, but only two Unit Types can be shown on a single Quick Plot. Data for the third, fourth, and so on Unit Types are not plotted. The default plotting settings, configured in the Settings Manager are used for axis configuration, line types, range, and so on. Table Slot data can be shown, but only one table is shown at a time.
The Quick Plot is supported on the following windows.
See Quick Plots in Output Utilities and Data Visualization for more information.
Object Shortcuts to Plots
It is now possible to create shortcuts to Plot Pages from the Object Viewer and Open Object windows. See Object Shortcuts for information on the new object shortcuts to plots.
Revised: 05/31/2026