
RiverSMART User’s Guide
RiverSMART Event Reference
Topics
CSV Combiner Event
The CSV Combiner event takes multiple CSV files and combines them into a single CSV file. Input is in the form of scenario sets, allowing you to combine data from all scenarios in a scenario set into a single CSV file. The first field in each line of the combined file identifies the scenario name.
To set up the CSV Combiner, on the RiverSMART workspace, add a CSV Combiner event, and then link the CSV file icons to the event as input or output.
The input CSV files do not all need to include the same columns, as named in the file header line. If a column is not included in an input file, or if a line in the input file has no value for the column, the combined file includes the column with a blank. For example:
,2,,,4,
CSV Combiner Configuration Dialog Box
This dialog box opens when you open a CSV Combiner event on the RiverSMART workspace.
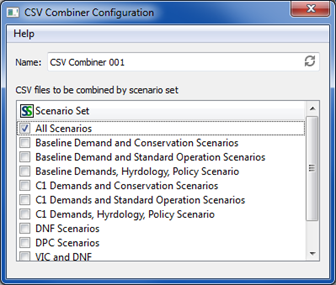
Name
Enter a user-defined unique name for the CSV Combiner event.
Scenario Set
Lists all scenario sets defined for the study in the Scenario Set Manager.
Select the check boxes of the scenario sets for which you want to combine CSV files. When the CSV Combiner is executed, an output CSV file is generated for the scenarios in each selected scenario set. Each CSV file is added to a subfolder of the ScenarioSet\ folder named with the scenario set name.
GPAT Graphs Event
The GPAT Graphs event takes Excel files with series data from RiverWare or other data sources and generates graphs in an Excel output file. The graphs are generated according to the configurations defined in the GPAT Graphs configuration file, which is created in GPAT and referenced in the GPAT Graphs Configuration dialog box.
Note: The Graphical Policy Analysis Tool (GPAT) is an add-in to Excel; therefore, for the event to function, Excel must be installed on your computer, and the GPAT add-in must be installed in Excel.
GPAT Graphs Configuration Dialog Box
This dialog box opens when you open a GPAT Graphs event on the RiverSMART workspace.
Note: The input Excel data files and output Excel file with graphs are configured in RiverSMART; therefore, they are not included in this dialog box.
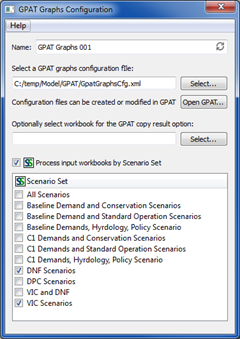
Name
Enter a user-defined unique name for the GPAT Graphs event.
Select a GPAT graphs configuration file
The GPAT Graphs configuration file is an XML-based file that specifies the graphs to generate. To specify this file, either enter the path in the text box, or select Select and navigate to the file. The file is created in GPAT and defines graph configurations created in the GPAT interface.
Open GPAT
If GPAT is installed in Excel on your computer, the Open GPAT button opens the GPAT interface, allowing you to create or modify GPAT Graphs configuration files. If you specify a configuration file, GPAT is opened with the configuration file already loaded.
Optionally select workbook for the GPAT copy result option
Optional field. Allows you to enter or select an Excel workbook for the copy result option in GPAT. If graphs that use the copy result option have been saved in the GPAT Graphs configuration file, you must select the workbook to which results will be copied; otherwise, this field is not applicable.
Process input workbooks by Scenario Set
Optional field. Allows input workbooks from selected scenario sets to be processed together into graphs in an output workbook.
Scenario Set list
This list is displayed only if the Process input workbooks by Scenario Set option is selected. It lists all scenario sets defined for the study in the Scenario Set Manager.
Select the check boxes of the scenario sets you want to process. Each selected scenario set is processed separately by the GPAT Graphs event, as follows:
1. The input workbook for each scenario in the set is located, and these are passed as inputs to GPAT.
2. GPAT creates the graphs specified in the selected configuration file using the input data from the scenarios in the set.
3. GPAT writes the graphs and associated data to the scenario set folder using the linked output workbook name.
4. If you have selected more than one scenario set, processing moves to the next set and its scenarios are processed into graphs and written to an output workbook in its scenario set folder.
Source Excel Data Workbooks
In RiverSMART, you can link one or more Excel workbooks as source data for the GPAT Graphs event. The requirements for the source data workbook are as follows:
• Rows represent timesteps.
• The first column of a worksheet includes the timestep names.
• The first row of a worksheet includes the column names.
In RiverWare, you can generate workbooks of this type directly by specifying an Excel output device through the Output Manager or by specifying the creation of Excel files in the Output frame of the Multiple Run Management Configuration dialog box. You can also convert RiverWare output files (.rdf) to Excel files using the RDF To Excel event or the RDF To Excel standalone tool distributed by CADSWES.
Note: For the graphs to be generated successfully by the GPAT Graphs event, column and worksheet names specified in the saved graph configurations in the GPAT Graphs configuration file must be present in the source data workbooks.
Output Excel Workbook
You specify the output Excel workbook by creating an output link from the GPAT Graphs event on the RiverSMART workspace.
Each time the GPAT Graphs event is run, it creates a single workbook that includes all the graphs generated according to the specified graphs configuration file. Each graph has a data worksheet, which includes the data for the graph, and an adjacent graph worksheet, which includes the Excel plot. If an existing workbook is specified as the output workbook, additional graph worksheets are added to the workbook; existing worksheets in the workbook are not deleted.
The event creates a log file in the Working\ folder, in a subfolder named for the processed scenario or scenario set. The log file includes informational messages, warnings, and error messages generated during the graph creation process.
Hydrology Simulator Event
The Hydrology Simulator event takes observed annual streamflow values and synthesizes an ensemble of annual flow data for a user-specified number of traces. These trace flow files can then be imported through a DMI to a RiverWare multiple run.
Note: For the Hydrology Simulator to successfully generate hydrology ensembles, the R Project for Statistical Computing must be installed on your computer; see “Install R and Component Packages” for details. This event was developed and tested with R version 2.14.2, but it should work with newer versions of R.
Note: The Hydrology Simulator should be used for annual flow data only. The event does not have any knowledge of the timestep size and will technically simulate with flow data based on any timestep. However, the algorithm does not have any means to account for seasonality, and thus, the results are only meaningful for annual data. For details and disaggregating annual flow data to monthly, see “Temporal Disaggregation Event”.
Available Functions
The Hydrology Simulator provides the following functions for generating ensembles.
Resampled KNN
This function resamples historic streamflow values using the k-Nearest Neighbor algorithm; see “Resampled KNN Function Configuration” for configuration details. The general algorithm is as follows.
1. For the first simulated year, a year is selected randomly from the historic streamflow data. For all subsequent years in the Trace Length, the following steps are carried out.
2. The historic years are sorted based on the difference in their flow relative to the flow of the previous simulated year to find the “nearest neighbors.”
3. The k number of “nearest neighbors” are selected. The k value is the square root of the number of values in the historic streamflow time series.
4. The nearest neighbor years are weighted with the highest weight on the year most similar to the previous simulated year.
5. A sample is taken from the nearest neighbor years based on the weighting.
6. The year following the selected year in the historic streamflow sequence is taken as the simulated flow on the current timestep.
Paleo Conditioned Homogeneous Markov Chain
This function resamples historic streamflow values using paleo-reconstructed streamflow sequences; see “Paleo Conditioned Homogeneous Markov Chain Interface Function Configuration” for configuration details. The general algorithm is as follows.
1. The historic streamflow data are divided into two transitional states (wet and dry) or three transitional states (very wet, normal, and very dry), as specified by the user.
2. A transition probability matrix, which represents the probability of each of the states occurring on a given year given the state the previous year, is created from the entire paleo period.
3. For the first simulated year, a year is selected randomly from the historic streamflow data. For all subsequent years in the Trace Length, the following steps are carried out.
4. Given the state from the previous timestep, and using the transition probabilities as weights, a state is selected for the current timestep.
5. An observed streamflow value from the selected state is chosen using the k-Nearest Neighbor algorithm.
Paleo Conditioned Nonhomogeneous Markov Chain
This function resamples historic streamflow values using paleo-reconstructed streamflow sequences; see “Paleo Conditioned Nonhomogeneous Markov Chain Interface Function Configuration” for configuration details. The general algorithm is as follows.
1. The historic streamflow data is divided into two transitional states (wet and dry) or three transitional states (very wet, normal, and very dry), as specified by the user.
2. A transition probability matrix, which represents the probability of each of the states occurring on a given year given the state the previous year, is created from a randomly selected window from the paleo period of length equal to Trace Length; this is what differentiates this method from the Homogeneous Markov Chain method, which uses the entire paleo record to establish th transition probabilities.
3. For the first simulated year, a year is selected randomly from the historic streamflow data. For all subsequent years in the Trace Length, the following steps are carried out.
4. Given the state from the previous timestep, and using the transition probabilities as weights, a state is selected for the current timestep.
5. An observed streamflow value from the selected state is chosen using the k-Nearest Neighbor algorithm.
Hydrology Simulator Configuration Dialog Box
This dialog box opens when you open a Hydrology Simulator event on the RiverSMART workspace.
Name
Enter a unique user-defined name for the Hydrology Simulator event.
Function
Select the hydrology function to use, as follows.
• Resampled KNN; see “Resampled KNN Function Configuration” for details.
• Paleo Conditioned Homogeneous Markov Chain; “Paleo Conditioned Homogeneous Markov Chain Interface Function Configuration” for details.
• Paleo Conditioned Nonhomogeneous Markov Chain; “Paleo Conditioned Nonhomogeneous Markov Chain Interface Function Configuration”; for details.
Resampled KNN Function Configuration
If you select the Resampled KNN option in the Function field, the Hydrology Simulator Configuration dialog box appears as follows.
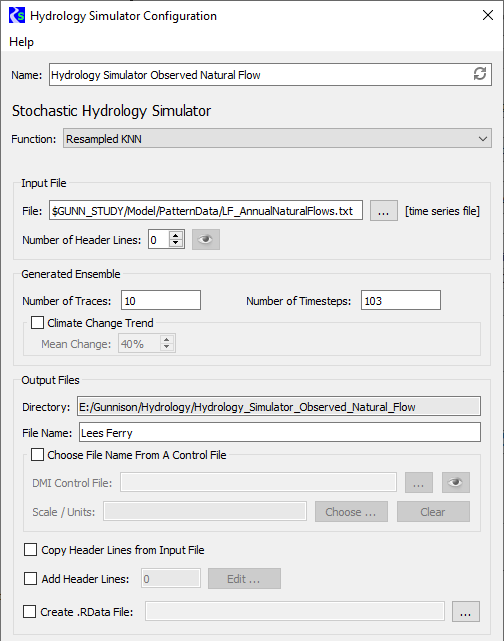
Input File frame
In this frame, you specify information about the input file, which is a single time series of observed historic flows for the desired site.
File
Specify the input file to use. You can enter the path or select it through the File Chooser.
Number of Header Lines
Enter the number of non-data header lines in the input file. The R scripts expect the file to start with data values; therefore, if there are header lines, this entry is required to inform the scripts how many lines to skip. If you need to see how many header lines there are, select Preview to preview the file in a separate window.
Generated Ensemble frame
In this frame, you specify information to configure the generated ensembles.
Number of Traces
Enter the number of traces in the ensemble.
Number of Traces
Enter the number of timesteps in each trace.
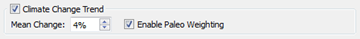
Climate Change Trend
Select the check box to apply a percentage change to the timestep values, and enter the percentage in the text box. Your entry must be a whole number, either positive or negative. Over the course of all timesteps in the trace, the values will trend linearly up or down by this percentage. The climate change trend is applied after the k-NN resampling algorithm.
Clear the check box to use the timestep values with no trend change.
Output Files frame
In this frame, you specify information to configure the output generated by the event.
Directory
Display only. displays the output folder to be created by RiverSMART. This folder is located under the Hydrology subfolder of the study folder and is named with the user-defined event name. A folder for each trace, named trace1, trace2, and so on, is created under the output folder.
File Name
Enter the file name for the resulting output file generated in each trace folder. This is typically the site name. Optionally, you can select the name from a RiverWare DMI Control File using the DMI Control File and Choose options.
DMI Control File
Select the check box to select the output file name from a DMI Control File, and specify the control file to use. You can enter the file path in the text box or select it through the File Chooser. If you need to view the file contents, select Preview to preview the file in a separate window.
Optionally, select Choose to display a list of the slot names in the specified DMI Control File. You can then select a slot, which is entered in the File Name field.
Scale/Units
Display only. Displays the units for the specified slot from the control file, if available. This is informational only and has no impact on the ensemble calculations.
Select Clear to clear the File Name and Scale/Units entries.
Copy Header Lines from Input File
Select this check box to copy the header lines in the input traces to the output files.
Add Header Lines
Select this check box to enter additional header lines to add to the output files. Select Edit, then enter the lines in the Additional Meta Data Lines dialog box and select OK when done. The number of additional lines is displayed in the text box.
Create .R Data File
Select this check box to save the R session that generates the ensembles to a file, which can be reopened later in the R application. You can enter the file path in the text box or select it through the File Chooser.
Paleo Conditioned Homogeneous Markov Chain Interface Function Configuration
If you select the Paleo Conditioned Homogeneous Markov Chain option in the Function field, the Hydrology Simulator Configuration dialog box appears as follows.
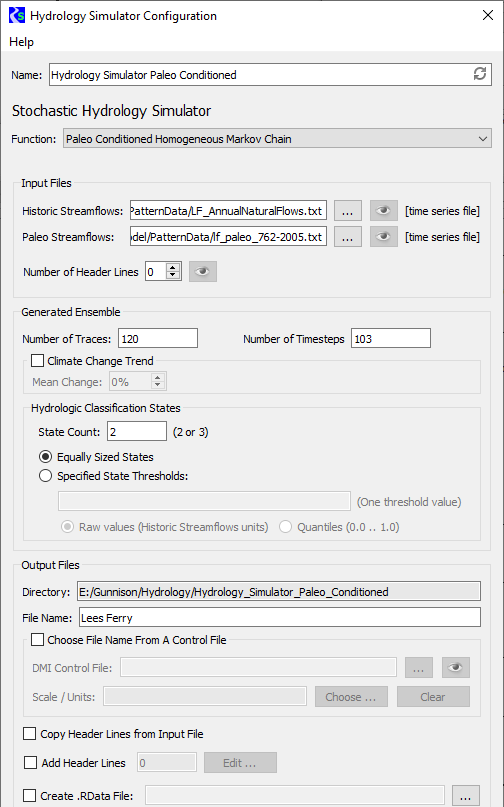
Input Files frame
In this frame, you specify information about the input files.
Historic Streamflows
These are a single time series of observed historic flows for the selected site. Specify the file with the streamflows to use. You can enter the path or select it through the File Chooser. Select Preview to preview the file in a separate window.
Paleo Streamflows
These are a single time series of paleo-reconstructed streamflows for the selected site. Specify the file with the streamflows to use. You can enter the path or select it through the File Chooser. Select Preview to preview the file in a separate window.
Number of Header Lines
Enter the number of non-data header lines in the input file. The R scripts expect the file to start with data values; therefore, if there are header lines, this entry is required to inform the scripts how many lines to skip. If you need to see how many header lines there are, select Preview to preview the file in a separate window.
Generated Ensemble frame
In this frame you specify information to configure ensembles.
Number of Traces
Enter the number of traces in the ensemble.
Number of Traces
Enter the number of timesteps in each trace.
Climate Change Trend
Select the check box to apply a percentage change to the timestep values, and enter the percentage in the text box. Your entry must be a whole number, either positive or negative. Over the course of all timesteps in the trace, the values will trend linearly up or down by this percentage. The climate change trend is applied after the k-NN resampling algorithm.
Clear the check box to use the timestep values with no trend change.
Hydrologic Classification States frame
In this frame, you enter information defining the hydrologic states used in the calculations.
State Count
Enter the value classifying the hydrology for each year; valid entries are as follows:
• 2 = dry/wet
• 3 = very dry/normal/very wet
Equally Sized States
Select this option to size the states equally.
Specified State Thresholds
Select this option to size the states according to user-defined settings. Enter the threshold values in the text box. If the State Count is 2, enter one threshold value; if the State Count is 3, enter two values, separated with a comma.
Select one of the following options to specify the type of values used to define the thresholds.
• Raw values (Historic Streamflows units). Select this option if the threshold values represent raw flow values.
• Quantiles (0.0 .. 1.0). Select this option if the threshold values represent quantiles; valid entries are 0.0–1.0.
Output Files frame
In this frame, you specify information to configure the output generated by the event.
Directory
Display only. displays the output folder to be created by RiverSMART. This folder is located under the Hydrology subfolder of the study folder and is named with the user-defined event name. A folder for each trace, named trace1, trace2, and so on, is created under the output folder.
File Name
Enter the file name for the resulting output file generated in each trace folder. This is typically the site name. Optionally, you can select the name from a RiverWare DMI Control File using the DMI Control File and Choose options.
DMI Control File
Select the check box to select the output file name from a DMI Control File, and specify the control file to use. You can enter the file path in the text box or select it through the File Chooser. If you need to view the file contents, select Preview to preview the file in a separate window.
Optionally, select Choose to display a list of the slot names in the specified DMI Control File. You can then select a slot, which is entered in the File Name field.
Scale/Units
Display only. Displays the units for the specified slot from the control file, if available. This is informational only and has no impact on the ensemble calculations.
Select Clear to clear the File Name and Scale/Units entries.
Copy Header Lines from Input File
Select this check box to copy the header lines in the input traces to the output files.
Add Header Lines
Select this check box to enter additional header lines to add to the output files. Select Edit, then enter the lines in the Additional Meta Data Lines dialog box and select OK when done. The number of additional lines is displayed in the text box.
Create .R Data File
Select this check box to save the R session that generates the ensembles to a file, which can be reopened later in the R application. You can enter the file path in the text box or select it through the File Chooser.
Paleo Conditioned Nonhomogeneous Markov Chain Interface Function Configuration
If you select the Paleo Conditioned Nonhomogeneous Markov Chain option in the Function field, the Hydrology Simulator Configuration dialog box appears the same as for the Paleo Conditioned Homogeneous Markov Chain function, with the addition of the following check box in the Generated Ensemble frame.
Enable Paleo Weighting
Select this check box to enable paleo weighting for the climate change calculation.
See “Paleo Conditioned Homogeneous Markov Chain Interface Function Configuration” for details about the remaining fields.
R Plugin Event
The R Plugin event allows scripts in the R programming language to be executed as a post-processing event in a study.
Note: For you to use the R Plugin event, the R Project for Statistical Computing must be installed on your computer; see “Install R and Component Packages” for details. This event was developed and tested with R version 3.0.2, but it should work with newer versions of R.
To configure an R Plugin event, you specify an R script file and a function within the R script file. You can also specify arguments to pass to the function. When the R Plugin event is executed, it calls the function and passes the defined arguments. See “R Function frame” and “Arguments frame” for details.
There are no formal restrictions on the user-defined R functions that can be called. However, the R Plugin event does provide utilities that assist in integrating post-processing outputs from R into the general RiverSMART file management framework. This is done by providing predefined arguments that pass information such as scenario names, linked input files, and output file locations.
Note: In this section, the term input files refers to files that are inputs to the R Plugin event. These files are outputs from previous events in the study, such as a RiverWare event or an RDF To Excel event. See “Predefined Arguments” for details.
Using the R Plugin Event
You can add an R Plugin event to the post-processing of scenario data in RiverSMART. When the event is executed, it runs a user-defined R script in the background.
The file types defined and used in post-processing—RDFs and Excel workbooks—can be linked to the R Plugin event as input files. The user’s R script is responsible for processing the data provided in the input files. The R Plugin event is not linkable in the interface to any files on its output side; that is, the R Plugin event is the terminus of its post-processing stream. However, there is no limit to the number of R Plugin events in a study; each as its own terminus.
RiverSMART provides an output folder as an optional predefined argument to the event. The user’s R script can use this specified output folder as a location to save any files generated by the R code, but RiverSMART does not link these files into subsequent processes. Though RiverSMART does not force files generated by the R code to be saved in the predefined output folder, for the following reasons, it is recommended that R scripts called from RiverSMART be written to save all output files to this location.
• The predefined output folder guarantees that R output files are saved in a file structure consistent with the general RiverSMART file management framework.
• Writing files to another location in the RiverSMART folder structure may result in file-naming conflicts or the unintentional deletion of output files if RiverSMART clears a folder of its contents as part of the re-execution of a portion of a study.
Using an R Plugin Event Outside of RiverSMART
Following is the process for using an R Plugin event outside of RiverSMART.
1. Install R; see “Install R and Component Packages” for details.
2. Create an R script. This script must contain, at a minimum, a single user-defined function that matches the function named in the R Plugin event configuration. The script can contain additional commands before or after the function definition. These commands are executed when the script is sourced from the RiverSMART-generated R script, but RiverSMART only passes arguments for the single function call; see “RiverSMART-generated R Script” for details.
The user-defined R script is responsible for all processing of data, including reading the data from the input files. The script can use any R functionality, including sourcing other script files, calling other functions, or reading data from files outside the RiverSMART folder structure.
Using an R Plugin Event Within RiverSMART
Following is the process for using an R Plugin event withing RiverSMART.
1. Add an R Plugin event to the workspace.
2. Link input files. These are one or more RDF files or Excel workbooks on the RiverSMART workspace that are outputs from another RiverSMART event; see “Linking Files” for details.
3. Specify an R script; see “R Function frame” for details.
4. Specify an R function; see “R Function frame” for details.
5. Specify arguments and their values; see “Arguments frame” for details.
6. Specify how to process scenarios; see “Scenario Processing frame” for details.
7. Generate and simulate scenarios, if not done previously.
8. Post-process scenarios.
Linking Files
RDF and Excel workbooks can be linked to the R Plugin event as input files. Multiple input files can be linked to a single R Plugin event, and a single input file can be linked to multiple R Plugin events. The event is not linkable in the interface to any files on its output side; that is, the R Plugin event is the terminus of its post-processing stream.
The linked input files are used by RiverSMART to define the values of the <linked input file paths> and <linked input file names> predefined arguments; see “Predefined Arguments” for details.
R Plugin Event Configuration Dialog Box
This dialog box opens when you open an R Plugin event on the RiverSMART workspace.
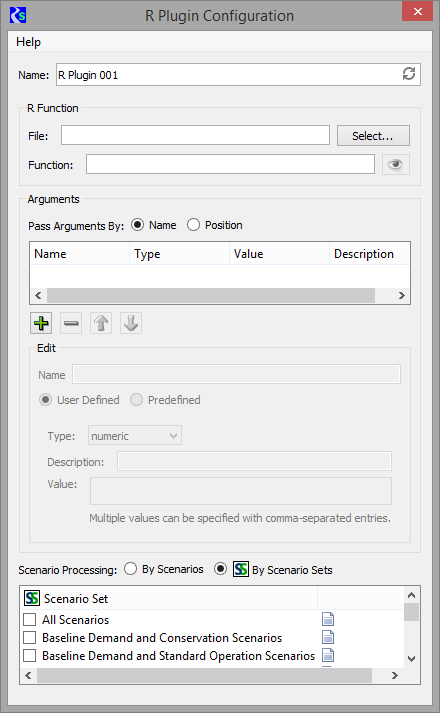
Name
Enter a user-defined unique name for the R Plugin event.
R Function frame
In this frame, you specify the R script file and function.
File
Specify the R script file. The R Plugin event creates its own R script file that sources this user-specified script file when the event is executed; see “RiverSMART-generated R Script” for details.
Enter the folder path in the text box, or select Select and select the folder through the File Chooser.
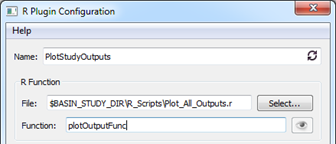
Function
Specify a function from the R script file. This function allows the R Plugin event to pass user-specified arguments to the R script. The event calls the function after sourcing the R script file; see “RiverSMART-generated R Script” for details.
Note: It is the user's responsibility to write an R script and function that use proper R syntax. There are no limits to what can be included in the script, other than it must include the specified function and the function must accept the arguments specified in the R Plugin Configuration dialog box. The user-created R script can source other files, call other functions, or require any installed R packages. See “Install R and Component Packages” for details.
If you need to view the script file to find the function, select Preview to view the script file in a separate window.
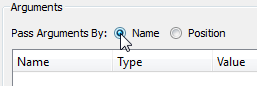
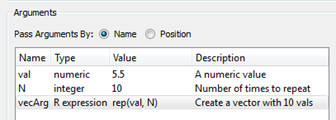
Arguments frame
In this frame, you define arguments and their values.
Pass Arguments By
Select the option for how arguments are to be passed.
• Name. Arguments are passed by name. You must specify a name for each argument in the R Plugin configuration that exactly matches the name in the function definition in the R script. In this case, the order of arguments in the R Plugin configuration does not matter.
Note: This option is recommended.
• Position. Arguments are passed by position. You do not specify names for arguments. Instead, each argument is given an index number identifying its position in the list of arguments. In this case, the order of the arguments in the R Plugin configuration must match the order of the arguments in the function definition.
Argument list
To add a new argument to the list, select Plus. To remove a selected argument, select Minus. To adjust the order of arguments in the configuration, select an argument, then select the Up or Down arrows, as appropriate.
Edit frame
In this frame, you define details for each argument in the list. It is made available when you add or select an argument on the list.
Name
Available only if the Pass Arguments by Name option is selected. Enter a user-defined name for the argument. This can be any valid name in the R programming language. All alphanumeric symbols are allowed plus ‘.’ and ‘_’, with the restriction that the name must start with ‘.’ or a letter, and if it starts with ‘.’ the second character must not be a digit.
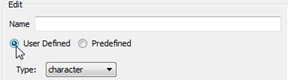
Class
Select the argument class, as follows. This selection determines the remaining options.
• User Defined. The argument is user-defined. You must specify values in the Type, Description, and Value fields; see “User-defined Arguments” below for details.
• Predefined. The argument is predefined, and the value is determined at run time. You must specify an Argument option; see “Predefined Arguments” for details.
User-defined Arguments
The following fields are available only if the User Defined option is selected.
 See
SeeType
Select the argument type. This must match the type expected by the user function called by the R Plugin event.
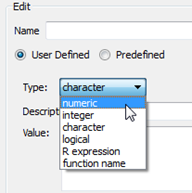
Options are as follows.
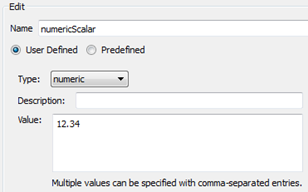
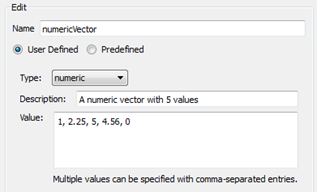
• Numeric. A numeric argument passes a double-precision vector of values; the vector may have a length of 1. The following figures show possible valid entries for numeric argument values.
• Integer. An integer argument is the same as a numeric type, but any digits after a decimal point are truncated; that is, all values are rounded down to the nearest whole number. For example, a value entered as “12.75” is passed to the R function as “12”.
• Character. A character argument allows a character string or a vector of character strings to be passed. The following figures show possible valid entries for character argument values.
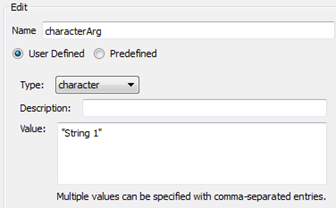
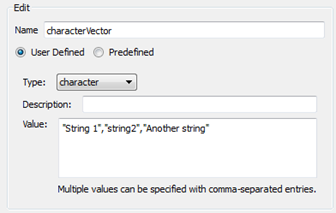
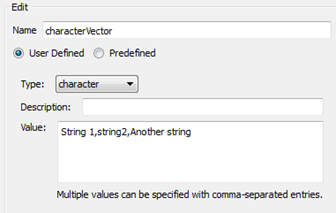
Quotation marks are optional; their use has no effect on the result. For example, the characterVector definition, with quotation marks, in the previous figure produces the same result as the characterVector definition, without quotation marks, in the following figure.
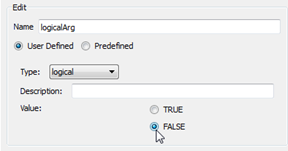
• Logical. A logical argument passes either TRUE or FALSE. When you select this argument type, you must set the value for the argument by selecting either TRUE or FALSE. A logical argument cannot contain multiple values.
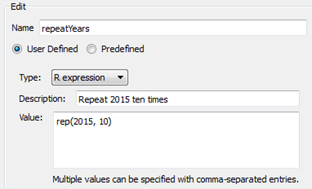
• R Expression. This argument is generic and can contain any valid R expression. Technically, any of the previous arguments can be defined as an R expression argument, but this type also allows commands that are part of the R programming language to be passed as an argument value. For example, a vector of a single value repeated 10 times may be passed through an R expression argument using the R rep() function.
Note: It is the user’s responsibility to ensure that valid R syntax is used to specify the R expression argument.
Note: It is possible to use other previously defined arguments in an R expression. For example, if a previous argument is of type Integer with name N and value 10, the expression for the repeatYears argument shown in the following figure can be written as follows.
rep(2015, N)
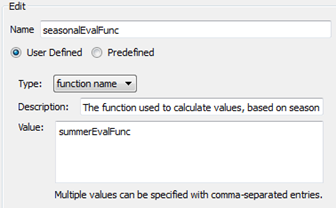
• Function Name. The name of a function is passed as an argument to the function being called by the R Plugin event. For example, in one season, values may be processed using one method, but other seasons may use a different method. No arguments are passed in the function name argument; only the function name is passed.
The specified function can be either user-defined or predefined in the R programming language. For a user-defined function, you must ensure the function is defined in the script. For a predefined R function, you must ensure any required packages are loaded by the script.
Description
Enter an optional argument description. This is for your reference only.
Value
Enter the argument value. Values for numeric, integer and character arguments can either be a single value or a vector with the individual elements separated by commas.
Note: You do not need to enter the R concatenate command, c(...), for a vector of values; only the commas separating the values are required. The R Plugin event requires a value to be specified for each argument in the list.
Predefined Arguments
The following fields are available only if the Predefined option is selected.
Argument
Select a predefined argument. The value of the argument to be passed is determined at runtime, so the menu options show the generic argument value.
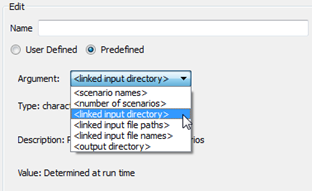
Options are as follows. See Example 4.1 for sample values that might be passed in a simple study.
• <scenario names>. If the Scenario Processing By Scenario Sets option is selected, this argument matches the scenarios defined by the selected scenario set. If the Scenario Processing By Scenarios option is selected, this argument is a single scenario name each time it is passed.
• <number of scenarios>. This argument is an integer equal to the length of the <scenario names> argument.
• <linked input directory>. This argument is always the Study Folder specified in the main RiverSMART workspace, appended with the Scenario\ subfolder. The use of the term linked input indicates this folder includes files that are inputs to the R script. The <linked input directory> includes the raw RiverWare outputs—typically RDF files—or outputs from another RiverSMART event.
• <linked input file paths>. This argument allows the files to be fully specified for each scenario. The length of this character vector is calculated as follows:
<number of scenarios> * length(<linked input file names)
• <linked input file names>. This argument includes just the general file names, as displayed in the RiverSMART workspace. It does not include a separate element for each scenario.
• <output directory>. This argument specifies a file path where outputs from the R script can be saved. RiverSMART creates the folder but does nothing with this argument directly after passing it to R. If the Scenario Processing By Scenario Sets option is selected, <output directory> is the Study Folder specified in the main RiverSMART workspace, with the ScenarioSet\Scenario_Set_Name\R_Plugin_Name\ subfolder appended. If the Scenario Processing By Scenarios option is selected, <output directory> is the Study Folder with the Scenario\Scenario_Name\R_Plugin_Name\ subfolder appended.
It is the user’s responsibility to incorporate the <output directory> argument into R script commands that write output files; RiverSMART does nothing to enforce the use of this output location. For the following reasons, however, it is recommended that R scripts called from RiverSMART save all output files to this location.
• The predefined output folder guarantees R output files are saved in a file structure consistent with the general RiverSMART file management framework.
• Writing files to another location in the RiverSMART folder structure may result in file-naming conflicts or the unintentional deletion of output files if RiverSMART clears a folder of its contents as part of the re-execution of a portion of a study.
Example 4.1 Example values passed by predefined arguments
Assume the study has the following characteristics. The table lists possible values that might be passed by each predefined argument.
• Four supply and demand scenarios, consisting of the following.
– Two supply scenarios: Wet and Dry
– Two demand scenarios: HighDemand and LowDemand
• Two linked rdf files: UpperBasinOutput.rdf and LowerBasinOutput.rdf
• The scenarios are processed by a scenario set named “AllScenarios” that includes all four scenarios.
• The R Plugin event is named “BasinResultsR”.
Predefined argument | Sample value passed to R |
|---|---|
<linked input directory> | “C:\users\UserName\RiverSMARTFiles\MyStudy\Scenario\” |
<scenario names> | c(“Dry,HighDemand”, “Dry,LowDemand”, “Wet,HighDemand”, “Wet,LowDemand”) |
<number of scenarios> | 4 |
<linked input file names> | c("UpperBasinOutput.rdf", "LowerBasinOutput.rdf") |
<linked input file paths> | c("C:\users\UserName\RiverSMARTFiles\MyStudy\Scenario\Dry,HighDemand\UpperBasinOutput.rdf", "C:\users\UserName\RiverSMARTFiles\MyStudy\Scenario\Dry,HighDemand\LowerBasinOutput.rdf", "C:\users\UserName\RiverSMARTFiles\MyStudy\Scenario\Dry,LowDemand\UpperBasinOutput.rdf", ...) |
<output directory> | “C:\users\UserName\RiverSMARTFiles\MyStudy\ScenarioSet\AllScenarios\BasinResultsR\” |
Type
Display only. All predefined arguments have the character type, with the exception of <number of scenarios>, which is an integer.
Description
Display only. Displays a description of the selected argument.
Value
Display only. Indicates the argument value is determined at run time.
Scenario Processing frame
In this frame, you select the method for processing scenarios.
By Scenarios
The R Plugin event is executed once for each scenario selected in the Scenario List Post-Processor dialog box. To open this dialog box, on the RiverSMART menu, select Scenarios, then Post-Process Scenarios and select the scenarios to be applied.
To execute the R Plugin event using this option, in the Scenario List Post-Processor dialog box, select Scenarios, then Post-Process Checked Scenarios; this executes all post-processing events for the selected scenarios. If the R Plugin event uses the scenario_names predefined argument, its value is a single scenario name each time the R Plugin event is executed. The number_of_scenarios argument has a value of 1.
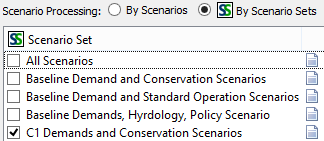
By Scenario Sets
The R Plugin event is executed once for each selected scenario set. When you select this option, all scenario sets defined in the study are listed in the frame, allowing you to select the scenario sets to be applied.
To execute the R Plugin event using this option, on the RiverSMART menu, select Scenarios, then R Plugin, then select the appropriate R Plugin event. If the R Plugin event uses the scenario_names predefined argument, it is a vector with the list of scenarios defined by the scenario set. The number_of_scenarios argument is equal to the length of that vector.
Error Handling and Log File
RiverSMART has no knowledge of the user-created R script and therefore does not report success or failure of the script execution. It is the user’s responsibility to verify that the R script executed successfully.
Note: RiverSMART does not automatically delete old output files generated by your R script, so it is possible for old output files to exist if the R script fails on a current invocation. Therefore, it is important to check the time stamps on output files to verify they are from the current invocation.
RiverSMART creates a log file, which you can open in a text editor after the R Plugin event has executed. This is useful for verifying successful execution and identifying errors.
• If processing by Scenario Sets, the file is at the following location:
Study_Folder\Working\Plugin_Name\Scenario_Set_Name\RPlugin.log
• If post-processing by Scenarios, the file is at the following location:
Study_Folder\Working\Plugin_Name\Scenario_Name\RPlugin.log
Tip: Use the button to get to the log file for the scenario set: 
The log file includes all messages sent to R Standard Out and Standard Error. For an execution with no errors and no output messages, the only contents of the log file may be the following lines:
STANDARD OUT
STANDARD ERROR
STANDARD ERROR
If an error occurs during execution, messages are printed under STANDARD ERROR. Any print commands in the user’s script print to the STANDARD OUT in the log file.
RiverSMART-generated R Script
The R Plugin event creates an R script file, which is executed in the background by the R application each time the R Plugin event is invoked.
After the R Plugin event has executed, you can open the log file in a text editor. This is useful for debugging issues, when the R script does not execute as expected.
• If processing by Scenario Sets, the file is at the following location:
Study_Folder\Working\Plugin_Name\Scenario_Set_Name\RPlugin.R
• If processing by Scenarios, the file is at the following location:
Study_Folder\Working\Plugin_Name\Scenario_Name\RPlugin.R
If arguments are passed By Position, the RiverSMART-generated R Script has the following general form.
source(User-specified_R_file)
arg1 <- <value>
arg2 <- <value>
...
argN <- <value>
<UserSpecifiedFunction>(arg1, arg2, arg3, ..., argN)
If arguments are passed By Name, the commands assigning values to the arguments use the argument names specified in the R Plugin Configuration dialog box. The final function call has the following form. Using this form, the order of arguments in the event may differ from the order in the function definition.
<UserSpecifiedFunction>(arg1 = arg1, arg2 = arg2, arg3 = arg3, ..., argN = argN)
The R script is sourced as the first command in the script; then arguments are assigned values; then the function is called.
This process allows you to include additional commands in the R script before the specified function is called. These can include additional function definitions, which are then used as R expression arguments in the event. This process also allows an argument to be used in the definition of another argument value further down the list. For example, the following list of arguments is valid.
RDF Annualizer Event
The RDF Annualizer event takes the data from an RDF file with a timestep of less than a year and aggregates the data, generating an RDF file with an annual timestep.
Configuring the RDF Annualizer
To configure the RDF Annualizer, you specify the following items:
• Source RDF file—source file with non-annualized data.
• Method control file—defines the methods for aggregating the slot data from the input file.
• End-year month—defines the last month of the aggregated year, allowing you to generate aggregations for calendar years or water years, for example.
• Result annual RDF file—file with the resulting annualized data.
Source RDF File
RDF files are generated from RiverWare and include data for user-specified slots. Non-series slots can be written to RDF files, but the RDF Annualizer only processes data for series slots. See the “Output Utilities” section of the RiverWare Help for details about the RDF file format.
In the Output tab of the MRM Configuration dialog box, you can configure slot data for a multiple run in RiverWare to be output to an RDF file.
The source RDF file must include series data with a timestep of less than a year. This includes timesteps of 1 hour, 6 hour, 12 hour, daily, weekly, and monthly. If the source RDF file includes yearly timestep data, the RDF Annualizer displays an error message that the run is already annualized.
Method Control File
The method control file specifies the slots to be processed and the annualization method to be used for each one. This is a text file, with one entry per line. Each line has the following syntax:
Object.Slot: Method
Note: If a slot is included more than once in the file—by specific declaration or wildcard—the RDF Annualizer uses first method listed.
Object can be any of the following:
• Specific object name from RiverWare
• * (asterisk) as a wildcard to match any object name
• Object type from RiverWare, to match all objects of this type, such as LevelPowerReservoir
Slot can be any of the following.
• Specific slot name from RiverWare
• * (asterisk) as a wildcard to match any slot name
Method can be any of the following.
• Sum—sum of all values for the year
• Average—average of all values for the year
• Max—maximum value for the year
• Min—minimum value for the year
• End—last value for the year
• Begin—first value for the year
• SumNan
• AverageNan
• MaxNan
• MinNan
• EndNan
• BeginNan
Methods with the “Nan” suffix ignore NaN input values when calculating the annualized value. Methods without the “Nan” suffix report “NaN” for the annualized value if any input values for the year are NaN.
Example 4.2 Sample method control file entries
*.Outflow: Average
*.Pool Elevation: End
Big Reservoir.Evaporation: SumNan
DataObj.*: EndNan
These entries are processed as follows:
• Outflow values for all objects in the file are averaged over the year. If any values are NaN, the result for those objects is NaN.
• Pool Elevation for all objects in the file is the last value for the year. If any values are NaN, the result for those objects is NaN.
• For the object named “Big Reservoir”, the Evaporation slot is summed over the year. If any values are NaN, they are skipped and the remaining values are used in the sum.
• For all data objects in the file, all slots are assigned the last value of the year, regardless of whether any values are NaN.
End-year Month
The end-year month defines the last month of the year for the annualization calculations. The default is December, which annualizes to a calendar year; however, you can specify any month, such as September for water years.
For example, if you want to create an RDF file that includes storage values for reservoirs at the end of March, you can specify March as the end month and use the End method to report the last value for the year.
Note: The result RDF file only includes data for full annualized years. If the timesteps in the source RDF file result in partial years at the beginning or end of the time range when annualized according to the end-year month, the partial years are dropped from the result RDF file.
Result Annual RDF File
The result RDF file includes the same descriptive fields as the source RDF file—such as name, owner, and description—and the same number of runs.
Note: Only source file slots with a defined method in the method control file are processed by the RDF Annualizer; therefore, the output RDF file may include fewer slots than the input file. Also, any non-series slots in the source RDF file are not annualized.
The time_step_unit field is written as year, and the end times for the annualized years are listed as the new timesteps for the file.
The slot header information in the result RDF file is the same as the source file, except a method field is added to identify the method by which the slot data was annualized. Also, if the method is Sum or SumNan, the units field for the slot includes the phrase “summed over the year”; for example, “acre-ft/month summed over the year”.
Essentially, the result RDF file appears the same as an RDF file that was output from a RiverWare model with a yearly timestep, with a few minor exceptions.
RDF Annualizer Configuration Dialog Box
This dialog box opens when you open an RDF Annualizer event on the RiverSMART workspace.
Note: The source RDF file and result annual RDF file are configured in the program calling the event; therefore they are not included in this dialog box.
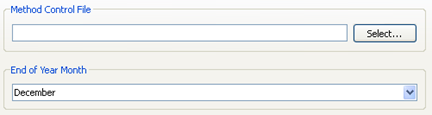
Method Control File
Specify the file name, either by entering the file path in the text file or by selecting Select and navigating to the file in the File Chooser. Environment variables are allowed; for example, if you enter $NAME, the defined NAME system environment variable is substituted in the Method Control File path when the RDF Annualizer event is run.
End of Year Month
Select the last month of the annualized year in the menu.
RDF To Excel Event
The RDF To Excel event takes a RiverWare Data Format (RDF) file and converts the contents to an Excel workbook according to user-specified configuration options.
Note: This event functions, in part, by automating Excel on your computer; therefore, Excel must also be installed. Since the event automates the installed version of Excel, it does not require a specific version of Excel or Excel workbook format.
RDF Files
RDF files are generated from RiverWare and include data for user-specified slots. Non-series slots can be written to RDF files, but the RDF To Excel event only processes data for series slots. See the “Output Utilities” section of the RiverWare Help for details about the RDF file format.
In the Output tab of the MRM Configuration dialog box, you can configure slot data for a multiple run in RiverWare to be output to an RDF file.
Excel Workbook
When the RDF To Excel event writes an RDF file to an Excel workbook, it creates a worksheet named “Header”, followed by worksheets containing the slot data. These are discussed in the following sections.
Header Sheet
The Header sheet summarizes RDF file information that is not slot data, including the following:
• File name
• Owner
• Description
• Creation Date
• Number of Runs
• Number of Slots
• Number of Timesteps
• Information for Each Run
• Information for Each Slot
• Listing of the Timestep Dates
Data Sheet Layout
The data sheet layout is determined by the user-selected workbook orientation option. The three workbook dimensions—rows, columns, and worksheets—can be mapped to the three data dimensions—timesteps, slots, and runs, allowing for six possible workbook orientations. The following orientations are common:
• Each run is a sheet; each timestep is a row; each slot is a column
• Each slot is a sheet; each timestep is a row; each run is a column
In the second orientation, each sheet tab is labeled with the slot name; each row header includes the timestep label; each column header includes the run label; and the table cells include the corresponding timestep data as indicated by the header labels and sheet name.
Slot Names
Because RiverWare slot names can be long, it can be challenging to fit them into the workbook, particularly for sheet tab labels, which are limited to 31 characters. The RDF To Excel event provides the following options for writing slot names to the workbook.
Slot Index Labels
Slot index labels are Slot0, Slot1, Slot2, and so on The index labels are mapped to the full slot names on the Header sheet, and the index labels are used on the data sheets.
Full Slot Name; truncated, if necessary
The full slot names—Object.Slot—are used. The following adjustments are made when slot names are used on sheet tabs.
• The complete Object.Slot name is inserted into the first cell (A1) of the sheet, to aid in identification.
• Colons are removed because they are not legal characters on tabs.
• Because only 31 characters are allowed on tabs, the name is truncated at 30 characters and a tilde character (~) is added to the end to indicate it is truncated. If the truncated name is not unique, a sequential number is prepended to the name.
Automatically Shortened Slot Names
Slot names are automatically shortened according to the following criteria.
• The string “And” is replaced with “&”.
• Colons and spaces are removed.
• All lowercase vowels are removed.
For example, PowellStorage becomes PwllStrg.
When used on sheet tabs, if a shortened name still exceeds 31 characters, the name is truncated at 30 characters and a tilde character (~) is added to the end to indicate it is truncated. If the truncated name is not unique, a sequential number is prepended to the name.
RDF To Excel Configuration Dialog Box
This dialog box opens when you open an RDF To Excel event on the RiverSMART workspace.
Note: The source RDF file and result annual RDF file are configured in the program calling the event; therefore they are not included in this dialog box.
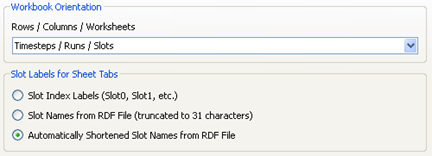
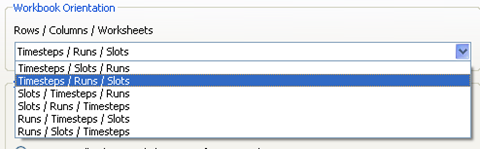
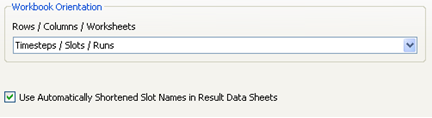
Workbook Orientation
This menu includes options for mapping Excel workbook rows, columns, and worksheets to the RDF file timesteps, runs, and slots. The following figure shows the available options.
Slot Labels for Sheet Tabs
This area of the dialog box is displayed only if the selected Workbook Orientation option maps slots to worksheets. You can select the slot naming option to use for the sheet tabs; see “Slot Names” for details.
Use Automatically Shortened Slot Names in Result Data Sheets
This check box is displayed if the selected Workbook Orientation option does not map slots to worksheets.
• If you select the check box, automatically shortened slot names are used in columns or row headers, depending on the specific orientation. Even when there is no strict limit on number of characters allowed, shortened names may be useful because they allow you to identify slots when columns are narrow.
• If you clear the check box, the full slot name—Object.Slot—is used in headers.
RiverWare Event
The RiverWare event allows you to perform the following actions.
• Control whether the simulation status dialog box is displayed.
• Add batch script commands to the simulations.
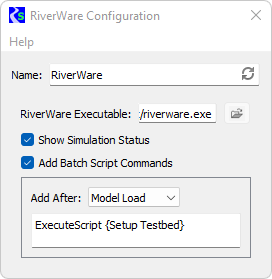
RiverWare Configuration Dialog Box
This dialog box opens when you open a RiverWare event on the RiverSMART workspace.
Name
Enter a unique user-defined name for the RiverWare event.
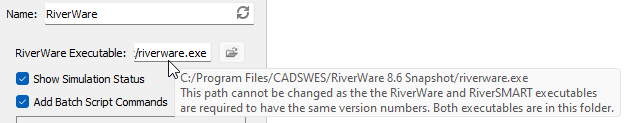
RiverWare Executable
Display only. This shows the path to the RiverWare executable.
In version 8.5 and before, the installation of RiverSMART and RiverWare were separate and you had to specify the location of RiverWare in the RiverWare Event. Starting in version 9.0, RiverWare and RiverSMART are bundled and installed together. The RiverWare version and RiverSMART version are the same and the path is automatic. It is shown here for your reference. Mouse over the path to see more information:
Show Simulation Status
Select the check box if you want to display simulation status; this is the default.
Clear the check box if you do not want to display simulation status.
Add Batch Script Commands
Select the check box if you want user-defined RiverWare Command Language (RCL) batch script commands inserted into the RCL script used to configure a model file for a scenario. You can enter the commands in the text box below.
Clear the check box if you do not want batch script commands inserted into the RCL script; this is the default.
Add After
Available only if the Add Batch Script Commands selection is enabled. Select when you want the batch script commands to be inserted. Options are:
• Model Load—inserts the commands after the model file is loaded; this is the default.
• Pre-Run DMIs—inserts the commands after the prerun DMIs are invoked.
Enter batch script commands
Available only if the Add Batch Script Commands selection is enabled. Enter one or more batch script commands in the text box. The commands are inserted into the RCL script as entered, except with blank lines removed. The commands can include environment variables.
RiverWare DMI Event
The RiverWare DMI event allows you to specify configuration information that is applied to a DMI in a RiverWare model. The RiverWare Data Management Interface (DMI) provides a mechanism for importing data to a RiverWare model.
If you link a DMI event to the RiverWare event in the RiverSMART workspace, the DMI configuration is included as a variable in the generation of RiverWare scenarios. The DMI configurations generated by RiverSMART are passed to RiverWare before RiverWare executes. They are used to modify the DMI in the model for that RiverWare invocation.
DMI Configuration Dialog Box
This dialog box opens when you open a DMI Configuration event on the RiverSMART workspace.
Name
Enter a user-defined unique name for the DMI Configuration event.
DMI Configuration frame
Name
The menu lists all DMIs in the RiverWare model that have the type selected in the DMI Type field. Select the name of the DMI you want to use. If the name does not match a DMI in the model—for example, if the DMI was deleted from the model—the text box is highlighted yellow to indicate the error.
Category
Enter a user-defined category name. Categories allow you to group DMI events based on the type of data imported—for example, “Supply”, “Demand”, and “Evaporation”. The category is used as an input type when RiverSMART scenarios are generated. For example, all DMIs with the “Supply” category would be considered as alternative choices in the Supply dimension when inputs to the RiverWare event are combined into alternative scenarios. See “Simulating Scenarios” for details.
DMI Type
Select the DMI type, as follows.
• Direct Connect (Excel); see “Direct Connect DMI (Excel)”.
• Direct Connect (DIT); see “Direct Connect DMI (DIT)”.
• Direct Connect (Web Service) see “Direct Connect DMI (Web Service)”.
• Control File / Executable; see “Control File / Executable DMI”.
• Trace Directory; see “Trace Directory DMI”.
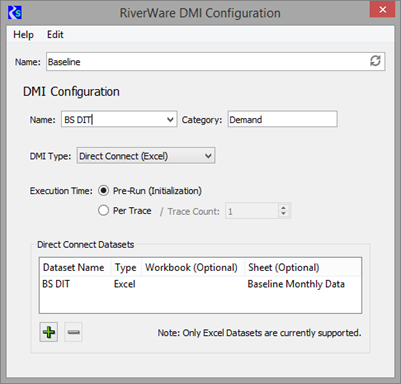
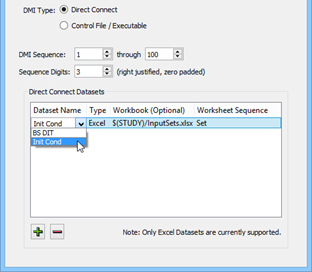
Direct Connect DMI (Excel)
If you select the Direct Connect (Excel) option in the DMI Type field, the DMI Configuration dialog box appears as follows.
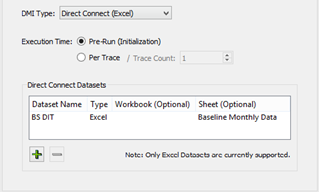
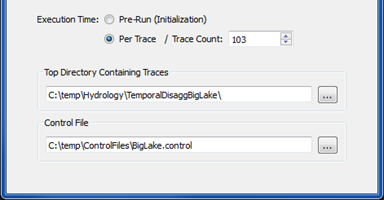
Execution Time
Select one of the following options to specify when the DMI is to be executed within the RiverWare invocation.
• Pre-run (Initialization). DMIs are executed once before the multiple run is started.
• Per Trace. DMIs are run at the beginning of each trace (run) of the multiple run. If you select this option, the Trace Count field is also required. Enter the number of traces (runs) you want in the multiple run. This number is incorporated in the multiple run configuration to control the number of runs when RiverWare is invoked.
Direct Connect Datasets frame
In this frame, you can modify the datasets specified for the DMI connection in the RiverWare model.
Note: These setting only support Excel Datasets.
To add a new dataset to the list, select Plus. To remove a selected dataset, select Minus. When you add a dataset, the following fields are available.
Dataset Name
Required field. Specify the name of the dataset to use. You can select the name from the menu, which lists all the Excel datasets in the RiverWare model, or you can enter the name directly in the text box. This entry must match exactly the name of an Excel dataset configured for the DMI in the RiverWare model. If the entry does not match—for example, if the dataset was deleted from the model—the text box is highlighted yellow to indicate the error.
Type
Display only. Indicates the dataset is an Excel workbook.
Workbook
Optional field. Open the field and enter the path for the Excel workbook to use as input when the DMI is invoked; this entry overrides the workbook path specified for the Excel dataset in the RiverWare model.
Sheet
Available only if the Pre-Run option is selected for Execution Time. Optionally, open the field and enter the workbook sheet name to use when the DMI is invoked; this entry overrides the sheet specified in the dataset configuration in the model.
Direct Connect DMI (DIT)
If you select the Direct Connect (DIT) option in the DMI Type field, the DMI Configuration dialog box appears as follows.
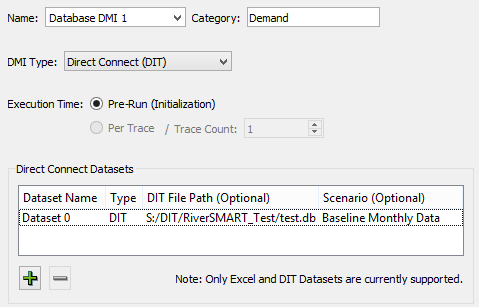
Execution Time
Only Pre-Run (Initialization) is supported. DMIs are executed once before the multiple run is started.
Direct Connect Datasets frame
In this frame, you can modify the datasets specified for the DMI connection in the RiverWare model.
Note: These setting only support DIT datasets.
To add a new dataset to the list, select Plus. To remove a selected dataset, select Minus. When you add a dataset, the following fields are available.
Dataset Name
Required field. Specify the name of the dataset to use. You can select the name from the menu, which lists all the DIT datasets in the RiverWare model, or you can enter the name directly in the text box. This entry must exactly match the name of a DIT dataset configured for the DMI in the RiverWare model. If the entry does not match—for example, if the dataset was deleted from the model—the text box is highlighted yellow to indicate the error.
Type
Display only. Indicates the dataset is the DIT type.
DIT File Path (Optional)
Optional field. Open the field and enter the path for the DIT SQLite file to use as input when the DMI is invoked; this entry overrides the file path specified for the DIT dataset in the RiverWare model.
Scenario (Optional)
Optional field. Open the field and enter the name of a DIT scenario to use when the DMI is executed; this entry overrides the scenario specified in the dataset configuration in the model.
Direct Connect DMI (Web Service)
If you select the Direct Connect (Web Service) option in the DMI Type field, the DMI Configuration dialog box appears as follows.
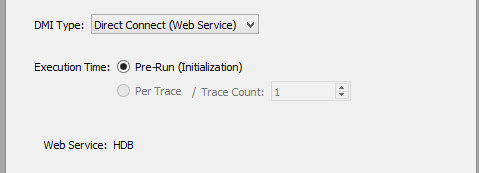
Execution Time
Only Pre-Run (Initialization) is supported. DMIs are executed once before the multiple run is started.
DMI Information
The dialog box lists the Web Service type (HDB, USGS Daily Values or CWMS RADAR) for the selected DMI.
Control File / Executable DMI
If you select the Control File / Executable option in the DMI Type field, the DMI Configuration dialog box appears as follows.
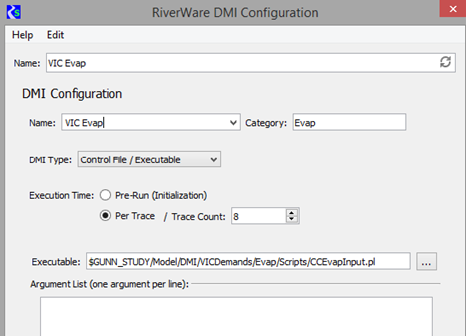
Execution Time
Select one of the following options to specify when the DMI is to be executed within the RiverWare invocation.
• Pre-run (Initialization). DMIs are executed once before the multiple run is started.
• Per Trace. DMIs are run at the beginning of each trace (run) of the multiple run. If you select this option, the Trace Count field is also required. Enter the number of traces (runs) you want in the multiple run. This number is incorporated in the multiple run configuration to control the number of runs when RiverWare is invoked.
Executable
This field allows you to override the executable configured for the DMI in the model. Enter the file path in the text box or select it through the File Chooser. This executable is invoked when the existing DMI in the model is run. Executables are typically developed by users to do certain data-related tasks. In the previous figure, the executable is a Perl script that copies trace data to a specified location.
Argument List
Enter arguments, one per line, to be passed to the DMI executable when the DMI is run. In the previous figure, a trace folder is passed to tell the CopyTraces.pl DMI executable where to find the traces to copy.
Trace Directory DMI
If you select the Trace Directory option in the DMI Type field, the DMI Configuration dialog box appears as follows.
Execution Time
Select one of the following options to specify when the DMI is to be executed within the RiverWare invocation.
Note: For Trace Directory DMIs, the Per Trace option is most applicable. If the Pre-run option is selected, only the information for trace one is imported before the multiple run is started.
• Pre-run (Initialization). DMIs are executed once before the multiple run is started.
• Per Trace. DMIs are run at the beginning of each trace (run) of the multiple run. If you select this option, the Trace Count field is also required. Enter the number of traces (runs) you want in the multiple run. This number is incorporated in the multiple run configuration to control the number of runs when RiverWare is invoked.
Top Directory Containing Traces
This is the top-level folder that includes the trace folders to be imported. Enter the folder path in the text box or select it through the File Chooser.
It is assumed that trace folders are labeled trace1, trace2, and so on. The top-level folder specification allows RiverWare to find the trace data without an executable specification, as is required for the Control File / Executable DMI.
Control File
This file is used as a basis for RiverWare to create temporary control files for each trace of the multiple run. Enter the file path in the text box or select it through the File Chooser.
The control file lists slots to be imported, as well as optional keyword/value pairs, such as units and scale, that can be used with control files in Control File / Executable DMIs.
• If keyword/value pairs are specified, the path up to the file name is substituted with the path to the appropriate trace folder when the DMI is run in RiverWare.
• If keyword/value pairs are not specified, RiverWare inserts the trace path with the following file name:
%o%s
where:
• %o is the object name.
• %s is the slot name.
RiverWare DMI Sequence Event
The RiverWare DMI Sequence event allows you to specify a sequence of initial conditions for RiverSMART scenarios. The RiverWare Data Management Interface (DMI) provides a mechanism for importing data to a RiverWare model.
If you link a DMI Sequence event to the RiverWare event in the RiverSMART workspace, multiple DMI configurations are included as variables in the generation of RiverSMART scenarios. The DMI configurations generated by RiverSMART are passed to RiverWare before RiverWare executes. They are used to configure the DMI in the model for RiverWare execution.
Example 4.3 Example DMI Sequence configuration
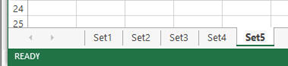
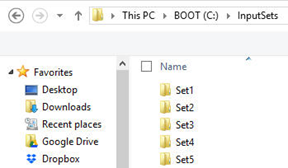
You have a model that generates 100 sets of data, each of which may be a set of initial conditions for RiverSMART scenarios. The initial condition sets are named sequentially, in either of the following ways:
• As Excel workbook sheets
• As file system folders
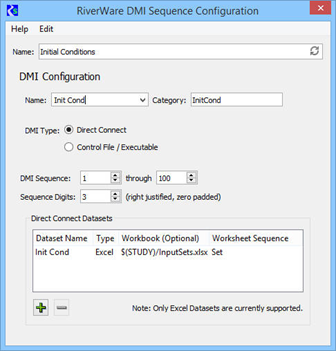
You can configure 100 instances of the DMI Event—one for each set of initial conditions—but this is a tedious and error-prone process, and it will clutter the RiverSMART workspace. A better alternative is to configure one instance of the DMI Sequence event for the 100 sets of initial conditions, as shown in the following DMI Sequence Configuration dialog box.
Note: In this section, the term sets of input is used to refer to sets of initial conditions.
See “RiverWare DMI Event” for details about that event.
DMI Sequence Configuration Dialog Box
This dialog box opens when you open a DMI Sequence event on the RiverSMART workspace.
Name
Enter a user-defined unique name for the DMI Sequence event. This name is used in naming scenarios in RiverSMART.
DMI Configuration frame
Name
The menu lists all DMIs in the RiverWare model that have the type selected in the DMI Type field. Select the name of the DMI you want to use. If the name does not match a DMI in the model—for example, if the DMI was deleted from the model—the text box is highlighted yellow to indicate the error.
Category
Enter a user-defined category name. This allows you to group DMI Sequence events on the RiverSMART workspace that import similar data. The category is used when RiverSMART scenarios are generated; for example all DMIs with the “Supply” category would be considered as alternative choices in the Supply dimension when inputs to the RiverWare event are combined into alternative scenarios.
Note: These DMIs are executed as MRM pre-run (initialization) DMIs, which are executed once before a multiple run is started.
DMI Type
Select the DMI type, as follows.
• Direct Connect; see “Direct Connect DMI”.
• Control File / Executable; see “Control File / Executable DMI”.
DMI Sequence
Enter the starting and ending numbers of the input set sequence to be used. The sequence is used to configure Excel worksheet names and file system folder names.
Sequence Digits
Enter the number of digits used to format the sequence numbers in scenario names. At a minimum, the value must be the number of digits necessary to represent the largest sequence number. This entry enables the input sets to sort in a natural order—for example, if you enter “2”, 09 sorts before, rather than after, 10. The field is necessary because the sequence may be extended.
For example, if the event is originally configured for input sets 1 to 50, the event can use two digits to identify the sequence; however, if the event is later configured for input sets 1 to 100, the input set names will change from two to three digits—that is, 01 to 001—and when scenarios are regenerated, this name change will cause scenarios to be removed unnecessarily. If, instead, you anticipate the maximum number of digits when you define this field, you will be able to extend the sequence later, without changing input set names.
Direct Connect DMI
If you select the Direct Connect option in the DMI Type field, the DMI Sequence Configuration dialog box appears as follows.
Direct Connect Datasets frame
In this frame, you can modify the datasets specified for the DMI in the RiverWare model.
Note: The DMI Sequence event supports Excel datasets only.
To add a new dataset to the list, select Plus. To remove a selected dataset, select Minus. When you add a dataset, the following fields are available.
Dataset Name
Required field. Specify the name of the dataset to use. You can select the name from the menu, which lists all the Excel datasets in the RiverWare model, or you can enter the name directly in the text box. This entry must match exactly the name of an Excel dataset configured for the DMI in the RiverWare model. If the entry does not match—for example, if the dataset was deleted from the model—the text box is highlighted yellow to indicate the error.
Type
Display only. Indicates the dataset is an Excel workbook.
Workbook
Optional field. Open the field and enter the path for the Excel workbook to use as input when the DMI is invoked; this entry overrides the workbook path specified for the Excel dataset in the RiverWare model.
Worksheet Sequence
Optional field. Open the field and enter the base name of the input set sheets. The index of the current input set is appended to this entry to configure the dataset to use the appropriate sheet when the DMI is invoked; for example, sheet Set37.
Control File / Executable DMI
If you select the Control File / Executable option in the DMI Type field, the DMI Sequence Configuration dialog box appears as follows.
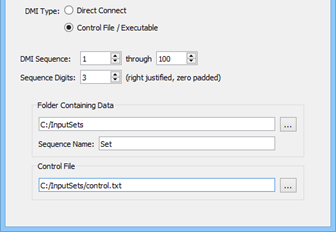
Folder Containing Data
Specify the folder that includes the input set folders. You can enter the path in the text box or select it through the File Chooser. The path can include environment variables.
Sequence Name
Enter the base name of the input set folders. The index of the current input set is appended to the sequence name to inform the DMI which input set folder to use.
Control File
Optional field. The control file identifies slots and the data files they import, as well as information such as units and scale. You can enter the path in the text box or select it through the File Chooser. The path can include environment variables. This overrides the control file path configured for the DMI in the RiverWare model.
Example 4.4 Example control file
Following is an example control file.
DeepLake.Inflow: file=C:\TestData\DeepLake.Inflow units=cfs scale=1000
When the DMI is invoked, it replaces the path in the control file with the current input set folder; for example:
DeepLake.Inflow: file=C:\InputSets\Set37\DeepLake.Inflow units=cfs scale=1000
If the file keyword is not specified, it is added to the entry with the current input set folder and the following file name:
%o.%s
where:
– %o is the object name.
– %s is the slot name.
RiverWare Model Event
The RiverWare Model event allows you to specify a RiverWare model file. If you link a RiverWare Model event to the RiverWare event, the model is included in the development of RiverWare scenarios.
RiverWare Model Dialog Box
This dialog box opens when you open a RiverWare Model event on the RiverSMART workspace.
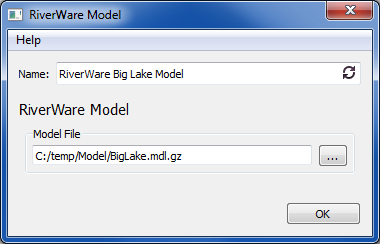
Name
Enter a user-defined unique name for the RiverWare Model event.
Model File
Specify the path to the model file. You can enter the path in the text box or select it through the File Chooser. The path can include environment variables.
RiverWare MRM Event
The RiverWare MRM event allows you to specify the name of a Multiple Run Management (MRM) configuration that has been set up in the RiverWare model. If you link a RiverWare MRM event to a RiverWare event, the MRM configuration is included as a variable in the development of RiverWare scenarios.
Note: To work correctly with RiverSMART, concurrent MRM configuration in the RiverWare model must specify that runs be distributed. Iterative MRM runs are described in “Using Iterative MRM configurations”.
MRM Configuration Dialog Box
This dialog box opens when you open an MRM event on the RiverSMART workspace.
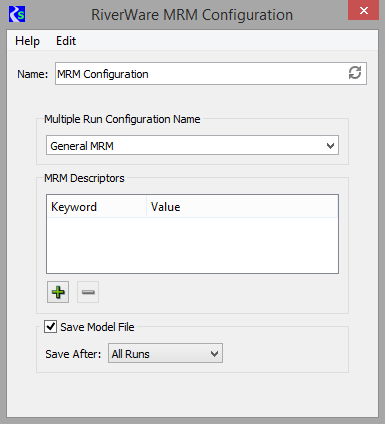
Name
Enter a unique user-defined name for the RiverWare MRM event.
Multiple Run Configuration Name
Select the MRM configuration file from the menu, which lists all MRM configurations defined in the specified RiverWare model.
MRM Descriptors frame
In this frame, you add user-defined optional MRM descriptors. To add a new MRM descriptor to the list, select Plus. To remove a selected MRM descriptor, select Minus.
Keyword / Value
When you add an MRM descriptor, you define keyword/value pairs by editing the Keyword and Value fields. This is useful when policies and DMIs in an MRM configuration go together, rather than exist as separate input events in RiverSMART—for example, VIC demand, VIC supply, and VIC operations. You can associate one or more keyword/value pairs with the configuration to describe the inputs it represents.
Using the previous MRM Configuration dialog box as an example, a DMI in the MRM configuration brings in a hydrology based on climate change projections. A descriptor is therefore added to indicate the Supply is Climate Change. When a scenario is simulated, these descriptors are written to the MRM configuration in the RiverWare model as MRM descriptors. They also appear in the Description tab of the MRM Configuration dialog box of the model running the scenario.
Within the RiverWare model, you can optionally configure MRM descriptors to be written to CSV and netCDF files that may be outputs from the multiple run for the scenario.
Save Model File
To save the model after each run, select the Save Model File option and specify when to save the model as follows:
– Successful Runs: Save the model for runs that complete successfully.
– Unsuccessful Runs: Save the model for runs that abort.
– All Runs: Save the model for both successful and unsuccessful runs.
For the specified runs, the model will be saved in the Working\RiverWare\ScenarioName folder with names RwModel-00001.mdl.gz, RwModel-00002.mdl.gz, and so on.
Using Iterative MRM configurations
RiverSMART supports iterative MRM configurations by configuring the runs to be “distributed” across one core. While not actually distributed, this allows the distributed MRM controller to perform the simulations. A characteristic of iterative MRM is that the number of runs isn't known in advance and the time remaining is not known. On the simulation dialog, the labels show the current run number while the progress bar is a busy indicator, rather than showing the percent complete.
See the RiverWare help on “Solution Approaches” for more information on Iterative MRM.
RiverSMART scenarios with an iterative MRM event have the following characteristics:
• The runs are considered successful if the iterative MRM converges on a solution:
– If the Post-Run Rules return “no change”, that is, they do not assign one or more new (different) values, the iteration is complete. Individual runs can abort and still be considered successful if the MRM is configured to continue after runs abort.
– If the Post-Run Rules use a Stop Run statement or expression to abort the MRM runs. The MRM must be configured to continue after runs abort.
The scenario's diagnostics will identify any runs that aborted.
• The runs are considered unsuccessful if the iteration does not converge, that is, max iterations are met OR an individual run aborts and the MRM is configured to stop after an individual run aborts.
RiverWare Policy Event
The RiverWare Policy event allows you to specify a RiverWare Policy Language Rulebased Simulation ruleset. We refer to this as simply a RPL set here. If you link a RiverWare Policy event to a RiverWare event, the policy event is included in the development of RiverWare scenarios.
If you have a rulebased simulation with only one ruleset, you do not need a Policy event, but you must specify that ruleset in the MRM configuration. Alternatively, you can save the ruleset in the model file and RiverWare will load that set after the model is loaded.
RiverWare Policy Dialog Box
This dialog box opens when you open a RiverWare Policy event on the RiverSMART workspace.
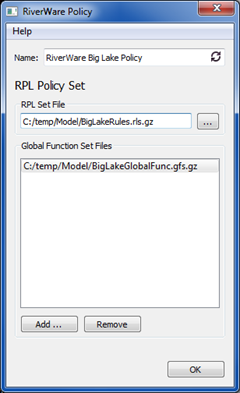
Name
Enter a unique user-defined name for the RiverWare Policy event.
RPL Set File
Specify the path to the RPL set file. You can enter the path in the text box or select it through the File Chooser. The path can include environment variables.
Global Function Set Files
This list allows you to specify global function sets that are required for the RPL set.
To add a function set to the list, select Add and select the file in the File Chooser. You can change the path by editing it directly.
To delete a function set from the list, select the entry and select Remove.
RiverWare Run Range Event
The RiverWare Run Range Event allows you to configure a study in which scenarios have different run ranges—for example, different start or end dates. This event allows you to configure a series of run ranges, which are used to generate scenarios.
Example 4.5 Example Run Range event
For the sample study there are 12 run ranges with a monthly timestep, beginning with each month from 1980-01 through 1980-12. The run duration is 24 months, with the exception that the policy requires the run ranges to extend through at least May of the end year. There are 12 run ranges, as shown in Table 4.1.
Each run range is a unique input to the study and is used to generate scenarios. If the study has two RiverWare Policy events, four RiverWare DMI events with a Supply category, and two RiverWare DMI events with a Demand category, then the study has 12 x 2 x 4 x 2 = 192 scenarios.
Start Date | End Date | # Timesteps | |
|---|---|---|---|
1 | 1980-01 | 1982-05 | 28 |
2 | 1980-02 | 1982-05 | 27 |
3 | 1980-03 | 1982-05 | 26 |
4 | 1980-04 | 1982-05 | 25 |
5 | 1980-05 | 1982-05 | 24 |
6 | 1980-06 | 1982-06 | 24 |
7 | 1980-07 | 1982-07 | 24 |
8 | 1980-08 | 1982-08 | 24 |
9 | 1980-09 | 1982-09 | 24 |
10 | 1980-10 | 1982-10 | 24 |
11 | 1980-11 | 1982-11 | 24 |
12 | 1980-12 | 1982-12 | 24 |
Run Range Configuration Dialog Box
This dialog box opens when you open a Run Range event on the RiverSMART workspace.
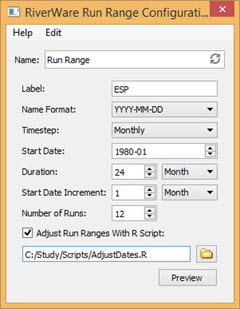
Name
Enter a user-defined name for the event.
Label
Enter an optional label to be prepended to the run range name, in format label-YYYY-MM-DD or labelYYYYMMDD, depending on the Name Format entry. If a study includes multiple run range events with overlapping dates, the label can help to distinguish the events.
Name Format
This entry specifies how the run range start date is formatted to form the run range name, which in turn, forms scenario names. Select the format to use. Although the menu options show full YYYY-MM-DD precision, only the precision necessary for the simulation timestep is used: YYYY, YYYY‑MM, or YYYY-MM-DD.
Timestep
Select the simulation timestep: Yearly, Monthly, or Daily. This must match the model simulation timestep.
Start Date
Enter the start date of the first run range in the series. Only the precision necessary for the simulation timestep is used: YYYY, YYYY-MM or YYYY-MM-DD.
Duration
Enter the duration of each run range in the series. For a yearly timestep, the duration is specified in years; for a monthly timestep, the duration is in years or months; for a daily timestep, the duration is in years, months, or days.
Start Date Increment
Enter the offset added to the start date of each run range to determine the start date of the next run range in the series. For a yearly timestep, the increment is specified in years; for a monthly timestep, the increment is in years or months; for a daily timestep, the increment is in years, months, or days.
Note: For daily timesteps or start date increments specified in years or months, the results may have unintended offsets. For example, if the start date is 1980-01-31 and the start date increment is 1 month, the start dates of the first few run ranges in the series, assuming a non-leap year, would be 1980-01-31, 1980-02-28, and 1980-03-28, not the last day of each month, as may be intended.
Number of Runs
Enter the number of run ranges in the series.
R Language Script
Select the check box to use an R script to adjust the run ranges for policy-specific requirements; see “Run Range R Script” for details. Specify the R script file by entering the path in the text box or selecting it through the File Chooser.
Run Range R Script
Note: For the Run Range event to use an R script, the R Project for Statistical Computing must be installed on your computer; see “Install R and Component Packages” for details.
In Example 4.5, the policy requires run ranges to extend through at least May of the end year, which means the run ranges beginning in January through April have durations greater than 24 months. This type of policy-specific behavior cannot be captured in the Run Range event configuration; however, you can provide an R script file to adjust the run ranges as necessary.
The R language script file must define the function.
adjustDates <- function(inputFile, outputFile)
{
}
The inputFile and outputFile parameters are the full paths to the function input and output files. The workflow is as follows.
1. The event generates the run ranges from its configuration. The run ranges conform to the duration and start date increment.
2. The event writes the run ranges to a CSV file; see “CSV File Format” for details.
3. The event invokes Rscript.exe to execute the adjustDates() function.
– The outputFile parameter is the full path to a file the function will write.
Rscript.exe must be installed and in the user search path; see “Install R and Component Packages” for details.
If RiverSMART diagnostics are enabled, the input and output file paths are displayed in diagnostic messages, which may be helpful for debugging the R script.
4. The adjustDates() function parses the input file, adjusts the run ranges as necessary, and writes the output file, which is a CSV file with an identical format to the input file.
– If the function determines no adjustments are necessary, it should not write an output file, indicating no change.
– If the function finishes successfully, including no change, it should exit with a zero status; otherwise it should exit with a non-zero status.
5. If the adjustDates() function finishes successfully, and if it writes the output file, the event parses the file and validates the adjusted run ranges included in the file. If the adjusted run ranges are valid, the event replaces the run ranges it generated with the adjusted run ranges.
adjustDates() Function
This function can print informational and error messages that are displayed in the RiverSMART Diagnostic window. Informational messages are displayed only if RiverSMART diagnostics are enabled. There are many ways to do this in the R language; one way is to define the functions, which can be called in the same manner as the R language sprintf() function is called.
info <- function(...) cat(sprintf(...), sep='', file=stdout());
error <- function(...) cat(sprintf(...), sep='', file=stderr())
The exit status indicates whether the function finished successfully.
# Successful:
quit(, 0, )
# Error:
quit(, 1, )
An error exit status should be accompanied by error messages.
CSV File Format
The input and output CSV files for the adjustDates() function include the following fields:
• Run number (1 .. N)
• Run name
• Timestep (year, month, or day)
• Start year
• Start month
• Start day
• End year
• End month
• End day
• Number of timesteps
The CSV files include full precision (yyyy,mm,dd), even if not required by the timestep. For the example, the first few lines of the input file for the adjustDates() function are as follows:
run_number,run_name,timestep,start_year,start_month,start_day,end_year,end_month,end_day,num_timesteps
1,1980-01,month,1980,01,31,1982,01,31,24
2,1980-02,month,1980,02,29,1982,02,28,24
3,1980-03,month,1980,03,31,1982,03,31,24
Run Range Preview
The Run Range Preview executes the R script workflow (see “Run Range R Script”) and displays the results in the RiverWare Run Range Preview dialog box. This allows you to easily view the run ranges generated by the Run Range event and the adjustments made by the R script. Without this capability, you would need to generate the scenarios and compare two CSV files in the event Working\ folder.
Figure 4.1shows the run ranges from Example 4.5 extended through May of the end year.
• Blue cells are the initially generated run ranges.
• Green cells are the adjusted run ranges
• Magenta cells highlight the differences.
Figure 4.1 Run Range Preview
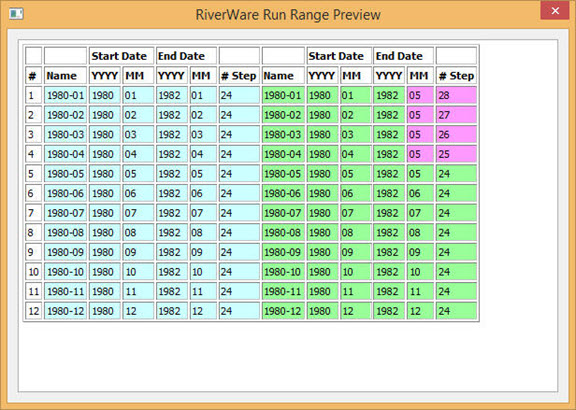
DMI Event Integration
In some applications of the Run Range event, run ranges are associated with DMIs. For example, the run range 1980‑01 may have different initial conditions than the run range 1980‑02. In this case, you need to organize your data to include the run range names.
For example, you can organize the data in trace folders, as follows.
C:\Study\InitCond\1980-01
C:\Study\InitCond\1980-02
...
Alternatively, you can organize the data in an Excel workbook with sheets named “1980‑01”, “1980‑02”, and so on.
To facilitate DMI event configuration, you can use the %RunRange% variable, which is replaced with the name of the run range. The following DMI event configuration fields support the %RunRange% variable:
• Direct Connect DMI: workbook and sheet
• Control File / Executable DMI: executable and arguments
• Trace Directory DMI: top folder and control file
Example 4.6 Example DMI Event configuration using the %RunRange% variable
The following figure shows a Trace Directory DMI event using the %RunRange% variable. The scenarios using run range 1980‑01 will import the initial conditions in C:\Study\InitCond\1980-01; the scenarios using run range 1980‑02 will import the initial conditions in C:\Study\InitCond\1980-02, and so on.
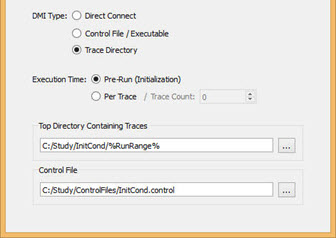
Spatial Disaggregation Event
The Spatial Disaggregation event takes a hydrology ensemble consisting of trace folders, each containing a file of flow data for a single site, and spatially disaggregates the site flow data, resulting in trace folders that contain files of flow data for multiple sites. These trace flow files can then be imported through a DMI to a RiverWare multiple run.
Note: For the Spatial Disaggregation event to successfully disaggregate flow data, the R Project for Statistical Computing must be installed on your computer; see “Install R and Component Packages” for details. This event was developed and tested with R version 2.14.2, but it should work with newer versions of R.
The general algorithm for the spatial disaggregation is as follows.
1. For each timestep in the trace, a k-NN sampling is used to select a timestep from the pattern data that has aggregated flow similar to the simulated annual flow.
2. From the selected timestep in the pattern data, the individual location flows are used to calculate the percentage of aggregated flow for each location.
3. The individual location percentages are applied the aggregated trace flow value allocate the total flow to individual locations.
4. The process is repeated for all timesteps in the trace.
Spatial Disagg Dialog Box
This dialog box opens when you open a Spatial Disaggregation event on the RiverSMART workspace.
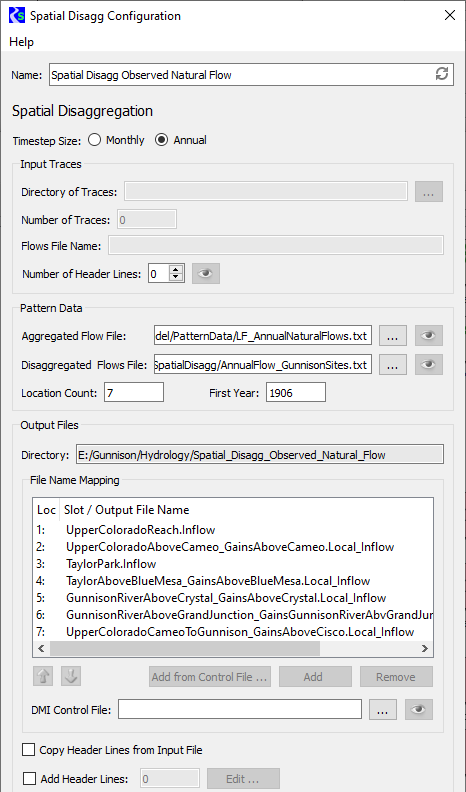
Name
Enter a user-defined unique name for the Spatial Disaggregation event.
Timestep Size
Select the appropriate option to specify whether the input ensemble data is monthly or annual data.
Input Traces frame
In this frame, you specify information about the ensemble of trace data that is input to the Spatial Disaggregation process.
• If the Spatial Disaggregation event is linked on the input side, the Directory, Number of Traces, and Flows File Name fields are not available (dimmed); they are automatically completed when the upstream event is generated.
• If the Spatial Disaggregation event is not linked on the input side, these fields are enabled and you must complete them; all are required.
Directory of Traces
Specify the folder that includes all trace folders for the input ensemble. You can enter the path or select it through the File Chooser.
Number of Traces
Enter the number of traces in the ensemble.
Flows File Name
Enter the name of the site data file that is in each trace folder. A site data file should be a single time series of flows for the desired site.
Number of Header Lines
Enter the number of non-data header lines in the site data file. The R scripts expect the file to start with data values; therefore, if there are header lines, this entry is required to inform the scripts how many lines to skip. If you need to see how many header lines there are, select Preview to preview in a separate window a sample site data file for trace1, if the file exists.
Pattern Data frame
In this frame, you provide data to define the pattern for spatially disaggregating the input site.
Aggregated Flow File
Specify a file that includes a single time series of historical observed values for the input site. You can enter the path or select it through the File Chooser. To preview the file in a separate window, select Preview.
Disaggregated Flows File
Specify a file that includes a time series of flows for each site to be disaggregated to. The file is structured as columns of data, one column per site, with a single space between columns. Each column represents a time series of historical observed values for one site.
You can enter the path or select it through the File Chooser. To preview the file in a separate window, select Preview.
Location Count
Enter the number of sites to disaggregate to; this must match the number of columns in the Disaggregated Flows File.
First Year
Enter the year of the first observation in the Disaggregated Flows File.
Output Files frame
In this frame, you specify information to configure the output generated by the event.
Directory
Display-only field. Displays the output folder to be created by RiverSMART. This folder is located under the Hydrology subfolder of the study folder, and it is assigned the user-defined Name of the Spatial Disaggregation event. A folder for each trace—named trace1, trace2, and so on—is created under this folder.
File Name Mapping
This list allows you to specify the names of the output files to be generated; enter one name for each site that is disaggregated to.
Note: If the number of entries in the list does not match the specified Location Count, a warning message is displayed above the list.
Use either of the following methods to add an entry to the list.
• Select Add, then open the entry and enter the file name, which is typically the name of the site.
• Enter a DMI Control File to select entries from that file. You can enter the file path in the text box or select it through the File Chooser. To preview the file in a separate window, select Preview.
You can then select Add from Control File to display a list of slot names included in the DMI control file and select the ones to add to the File Name Mapping list. If units are specified in the control file for the site, they are displayed in the list for informational purposes only.
The order of the entries in the File Name Mapping list must match the order of the columns of site data in the Disaggregated Flows File. To reorder selected entries in the list, select the Up or Down arrow to move them one step in that direction. You can remove selected entries from the list by selecting Remove.
Copy Header Lines from Input File
Select the check box to copy the header lines in the input traces to the output files.
Add Header Lines
Select the check box to enter additional header lines to add to the output files. Select Edit, then enter the lines in the Additional Meta Data Lines dialog box and select OK when done. The number of additional lines is displayed in the text box.
Temporal Disaggregation Event
The Temporal Disaggregation event takes a hydrology ensemble consisting of trace folders, each containing files of annual flow data for multiple sites, and temporally disaggregates the flow data, resulting in trace folders that include files of monthly flow data for the sites. These trace monthly flow files can then be imported through a DMI to a RiverWare multiple run.
Note: For the Temporal Disaggregation event to successfully disaggregate flow data, the R Project for Statistical Computing must be installed on your computer; see “Install R and Component Packages” for details. This event was developed and tested with R version 2.14.2, but it should work with newer versions of R.
Note: The Temporal Disaggregation Event can only be used to disaggregate from annual to monthly flow data. Attempting to disaggregate from or to different timestep sizes will not produce the intended results.
The general algorithm for the temporal disaggregation is as follows.
1. For each year in the trace, a k-NN sampling is used to select a year from the pattern data that has annual flow similar to the simulated annual flow.
2. From the selected year in the pattern data, the monthly flows are used to calculate percentage of annual flow for each month.
3. The monthly percentages are applied the annual trace flow value allocate annual flow to monthly flows.
4. The process is repeated for all years in the trace.
Temporal Disagg Dialog Box
This dialog box opens when you open a Temporal Disaggregation event on the RiverSMART workspace.
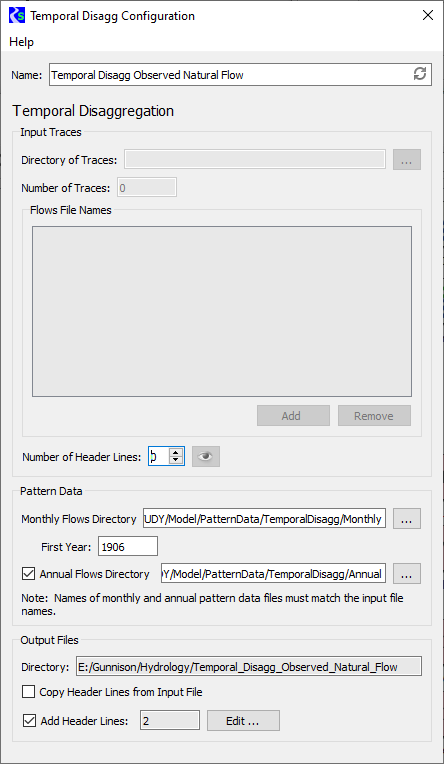
Name
Enter a user-defined unique name for the Temporal Disaggregation event.
Input Traces frame
In this frame, you specify information about the ensemble of trace data for sites that are input to the Temporal Disaggregation process.
• If the Temporal Disaggregation event is linked on the input side, the Directory, Number of Traces, and Flows File Names fields are not available (dimmed), and they are automatically completed when output from the upstream event is generated.
• If the Temporal Disaggregation event is not linked on the input side, these fields are enabled and you must complete them; all are required.
Directory of Traces
Specify the folder that includes all trace folders for the input ensemble. You can enter the path or select it through the File Chooser.
Number of Traces
Enter the number of traces in the ensemble.
Flows File Names
Enter the names of the site data files in each trace folder. Each site data file should be a single time series of flows for a site. To add an entry to the list, select Add, then open the entry and enter the file name, which is typically the name of the site. The order of names in the list does not matter. You can remove selected entries from the list by selecting Remove.
Number of Header Lines
Enter the number of non-data header lines in the site data files. The R scripts expect the files to start with data values; therefore, if there are header lines, this entry is required to inform the scripts how many lines to skip. If you need to see how many header lines there are, select Preview to preview a sample site data file for trace1 in a separate window.
Pattern Data frame
In this frame, you provide data to define the pattern for temporally disaggregating the input sites.
Monthly Flows Directory
Required field. This folder includes a file of monthly flow data for each site in the Flows File Names list, and the file names must match the site names in the list. Each file should include a single time series of monthly historical observed values, starting with January for that input site, and must include no header rows. Enter the folder path in the text box or select it through the File Chooser.
First Year
Required field. Enter the first year of the monthly flow data.
Annual Flows Directory
Optional field. This folder includes a file of annual flow data for each site in the Flows File Names list, and the file names must match the site names in the list. Each file should include a single time series of annual historic observed values, with no header rows.
• Select the check box to include this folder, then enter the folder path in the text box or select it through the File Chooser.
• Clear the check box to leave out this folder. The required monthly flow files will be aggregated to provide annual values for the calculations.
Output Files frame
In this frame, you specify information to configure the output generated by the event.
Directory
Display-only field. Displays the output folder to be created by RiverSMART. This folder is located under the Hydrology subfolder of the study folder, and it is assigned the user-defined Name of the Temporal Disaggregation event. A folder for each trace—named trace1, trace2, and so on—is created under this folder, and a monthly flows file for each site is generated in each trace folder.
Copy Header Lines from Input File
Select this check box to copy the header lines in the input traces to the output files.
Add Header Lines
Select this check box to enter additional header lines to add to the output files. Select Edit, then enter the lines in the Additional Meta Data Lines dialog box and select OK when done. The number of additional lines is displayed in the text box.
Install R and Component Packages
Use this procedure to install the R Project for Statistical Computing and some component packages on your computer. These are required for some RiverSMART events, including the following:
1. Use the following steps to download and install R for Windows on your computer.
a. Go to the R download site: http://cran.r-project.org/
b. Select Download R for Windows.
c. In the Subdirectories section, select base.
The download page for the current R version opens.
d. Select Download R for Windows at the top of the page to download the current version of R.
Note: If necessary, you can download an earlier version of R by selecting Previous Releases.
e. Save the download file to your computer.
f. As Administrator, run the downloaded file to install R on your system. You can accept the default installation folder and other options.
2. Use the following steps to add the R executable location to the Path environment variable.
a. As Administrator, open System Properties.
b. Go to the Advanced tab, and select Environment Variables.
The Environment Variables dialog box opens.
c. In the System variables section, select the Path entry, then select Edit.
The Edit System Variable dialog box opens.
d. In the Variable value text box, add a semicolon to the end of the entry and enter the path to the installed R executable; for example: C:\Program Files\R\R-2.14.2\bin\x64
e. Select OK in all dialog boxes to save your updates and close the dialog boxes.
3. Use the following steps to install packages needed by R scripts in RiverSMART.
a. As Administrator, open the R application.
b. In the R menu, select Packages, then Install Package(s).
The Secure CRAN mirrors dialog box may open, listing available mirror sites.
c. Select the mirror site from which to download the packages, then select OK.
The Packages dialog box opens, listing the available packages.
d. Select the following packages, then select OK.
• e1071
• ggplot2
• gplots
• msm
• reshape
• zoo
The packages are downloaded and installed on your computer.
e. In the R menu, select File, then Exit.
Revised: 06/04/2023