
RiverWISE Stakeholder’s Guide
RiverWISE Stakeholder’s Guide
RiverWISE (RiverWare Interactive Scenario Explorer) is a standalone application for viewing and exploring alternatives of certain specially configured models generated in the RiverWare software. RiverWISE is freely available and easy to use – it does not require the RiverWare software or training.
RiverWare model developers build a river system model, develop a baseline scenario, and select important input variables that could reasonably be modified in exploring alternative scenarios. They select key output variables of interest for comparing alternatives. Using a utility in RiverWare, they create and export a special file, a WISE file (*.wise) that can be opened in RiverWISE. The model developer communicates with both CADSWES and the stakeholders to facilitate the stakeholder licenses.
Stakeholders include anyone interested in viewing results of the RiverWare model and exploring alternative scenarios. Stakeholders use RiverWISE to open the WISE file, view results, change values of the designated input variables, execute the simulation and compare resulting output values. They may create several scenarios, save them and send them to others.
Install and Run RiverWISE
If you already have an active RiverWare license, RiverWISE is included; a separate RiverWISE license is not needed. To execute RiverWISE, from the Windows Start menu select All Programs, then CADSWES, then RiverWISE #.#.#.
Use this procedure to install an active RiverWare license:
1. Obtain a WISE (*.wise) file from a RiverWare model developer.
2. Obtain a RiverWISE license file from the RiverWare model developer. The model developer will communicate with CADSWES to facilitate the license. See instructions at the following location.
3. Download and install RiverWISE according to the instructions at the following location.
Note: You must install the same version that was used to generate the WISE file, so you must get the version number from the model developer.
4. Execute RiverWISE by selecting the Desktop icon. 
5. An empty RiverWISE window should open.
Open a WISE File
Open a WISE file using the menu File, then Open WISE File. Navigate to the location of the WISE file that you wish to open, then select the Open button.
If large, WISE files might take several minutes to load. A status message at the bottom left of the dialog will note the time the loading began; for example, “Open WISE File Started at 11-08-2017 10:23:18”. While loading, the cursor will be displayed as an animated circle; when loading is complete, the status message will be updated to reflect the new status.
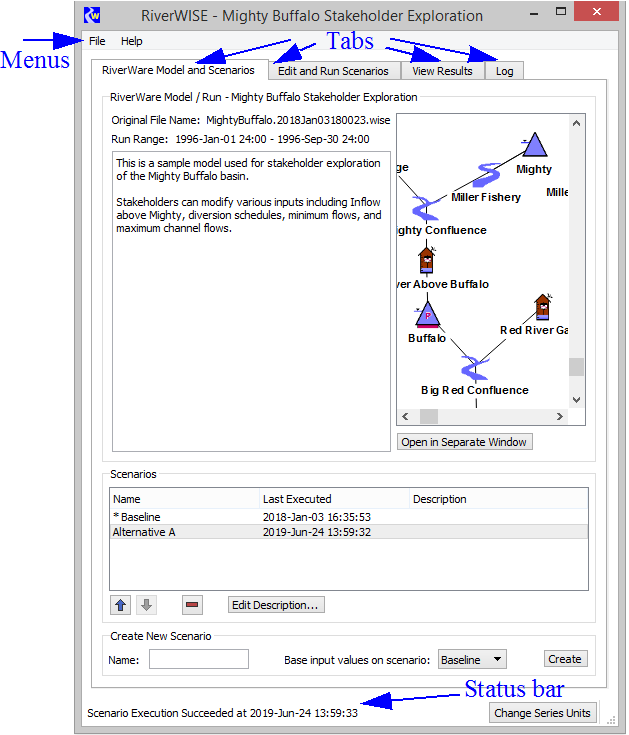
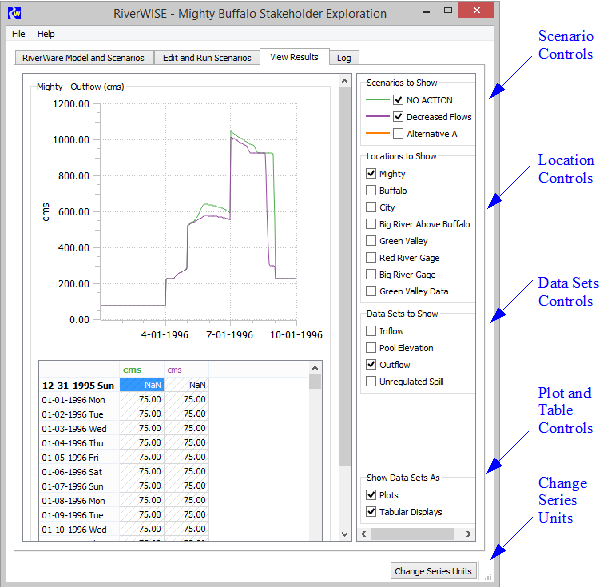
After opening a WISE file, the RiverWISE window should appear similar to Figure 1.1, with menus at the top and tabs for various displays and functions. The WISE file opens to the RiverWare Model and Scenarios tab that shows a textual description of the model/run (if one is provided by the model developer), a schematic of the river system and scenario information. The original WISE file name (when exported from RiverWare) and the simulation time period are shown.
Figure 1.1 Screenshot showing an overview of the RiverWISE interface
Note: The file name consists of a root, the date when the wise file was exported by the developer, a tag if saved from RiverWISE, and the “.wise” extension. The convention is FileNameRoot.ExportDate.wise. For example: MightyBuffalo.2018JAN03180023.wise. The WISE file you opened might also have a tag before the “.wise” extension. The tag is not present in the original file name, as created by RiverWare. The file name and export date persist in the file name through subsequent saves of the wise file and when exporting scenarios. This allows you to associate your saved WISE files and scenario files with the original WISE file. See “Save WISE File and Export Scenarios” for details on saving and exporting.
View the RiverWare Model Schematic
The model schematic shows the model components (objects and links) that form the network of the RiverWare hydrologic model. The various Object types are listed in the table below. Links represent data connections between data on the Objects. An image, such as a map, may be displayed with the schematic.
Use the following actions to navigate the model schematic.
• Zoom in or out. Right-click in the display panel and select the desired zoom level.
• Pan. Use the middle mouse button and Scroll bars to pan through the schematic.
• View links. Hover over the lines on the workspace to see tooltips describing the links.
• Select Open in Separate Window to show the schematic in a separate display. This allows it to be visible even when another RiverWISE tab is selected.
Icon | Description | Icon | Description |
|---|---|---|---|
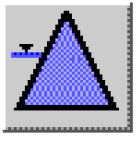 | Storage Reservoir Reservoir with Release and spillways; no hydropower. Pool Elevation is a function of Storage. | 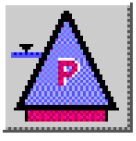 | Level Power Reservoir Reservoir with hydropower (turbine release) and spillways; Pool Elevation is a function of Storage. |
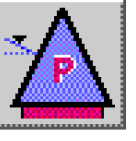 | Slope Power Reservoir Reservoir with hydropower and spillways. Storage is level storage plus wedge storage. |  | Pumped Storage Reservoir Reservoir with reversible pump-turbines that may generate or pump at each timestep. |
 | Reach Models routing in a river section; acts as node for diversions and return flows; models gains, losses. |  | Groundwater Models head based flow and storage of water in ground, groundwater-surface water interaction. |
 | Aggregate Reach Aggregation of multiple Reach objects. |  | Aquifer A deep, fully saturated, often confined groundwater system. |
 | Confluence A flow junction with two Inflows and a single Outflow. |  | Stream Gage Represents a gauge location in a river system; no simulated process. |
 | Bifurcation A flow junction with two Outflows and a single Inflow. |  | Pipeline Models pipe flow (pressurized). |
 | Water User Diverts water from a Reach or Reservoir, models consumptive use and return flows. |  | Pipe Junction Models a junction in pressurized flow system. |
 | Aggregate Diversion Site Contains Water Users; diverts from Reach or Reservoir; models consumptive user and return flow. |  | Inline Pump Models a booster pump station; calculates added head and power consumed. |
 | Diversion Diverts water from a Reservoir or Reach. |  | Inline Power plant Models power generation in reach with no storage, also called run-of-river power plant. |
 | Canal Models bi-directional conveyance channel by gravity flow between two reservoirs. |  | Power Plant Diversion Models the diversion and consumption of water by a Power Plant, often for cooling. |
 | Aggregate Distribution Canal Routes flows through multiple canal reaches from Diversion to Water users, and routes demands |  | Thermal Models economics of thermal power system and thermal replacement value of hydropower. |
 | Control Point Point of regulation; for example, for channel capacity for floods or instream flow regulation. |  | Data Object Container for user-configured data and custom slots; for example, expressions for user-defined calculations. |
Manage the Scenario List
A scenario in RiverWISE consists of a set of input values along with the results computed by a RiverWare simulation. When a WISE file is exported from RiverWare, it contains a single scenario, the baseline scenario, representing the input/results for the original simulation, as conducted by the model developer. RiverWISE users (stakeholders) may create new scenarios, receive scenarios from other stakeholders, and export their scenarios to others.
The Scenarios panel in the lower portion of the RiverWare Model and Scenarios tab displays the list of scenarios currently in this WISE file and has controls to reorder the scenarios in the list, delete and create new scenarios.
The list has the following columns:
• Name. Short text identifying the scenario; the name is assigned when the scenario is created or imported. Each name must be unique in the list
• Last executed. Completion date/time for the last execution of the scenario. This is empty if the scenario has not been executed.
• Description. Optional and editable textual description of the scenario.
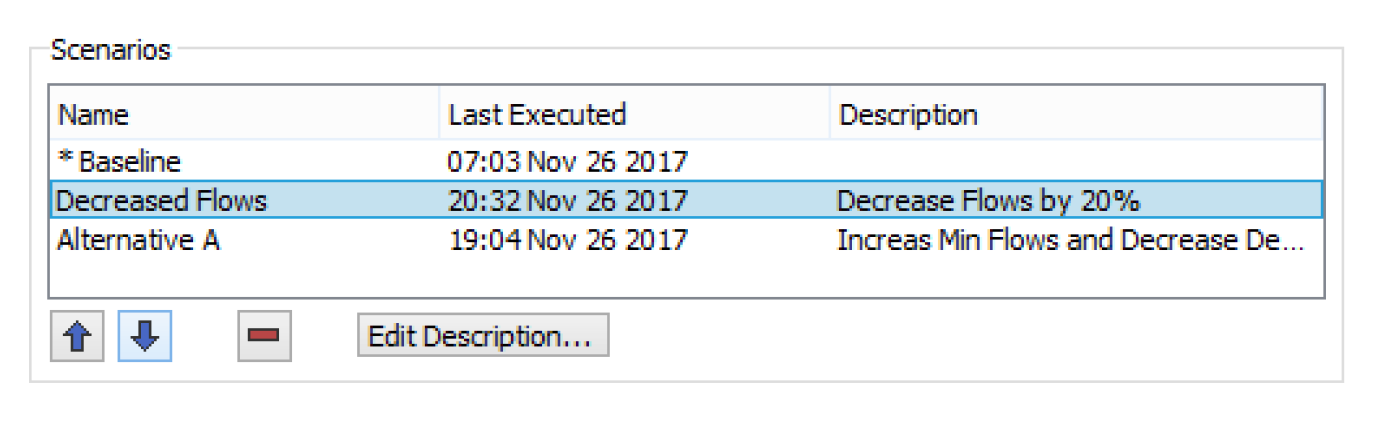
To edit a description, select the scenario in the list, then select the Edit Description button. Edit the text in the description field.
Note: Useful information to add to the comment includes the name of the scenario that this scenario is based on, user who created the scenario, changes made to input data, and comments on the results.
The baseline scenario, indicated by an asterisk is defined by the model developer and cannot be edited.
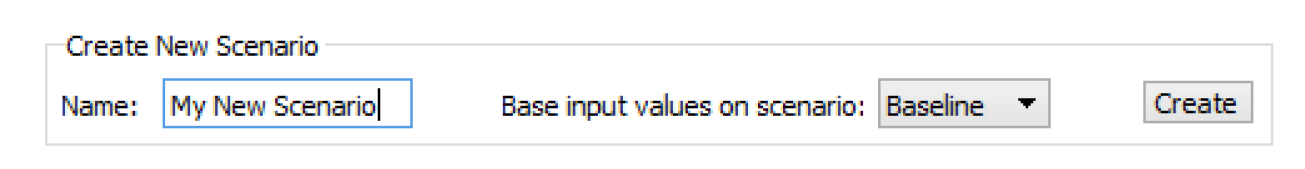
Create a New Scenario
Enter a name into the Name field of the Create New Scenario box, then select one of the currently listed scenarios on which to base the input values of the new scenario. When the new scenario is created, its input values will be identical to those of this scenario. Select the Create button to have the new scenario appear in the list.
To modify the inputs of your new scenario and execute a simulation to compute results, select the Edit and Run Scenarios tab.
Import Scenarios
One or more scenarios based on the same RiverWare model and baseline scenario, created in RiverWISE and exported to a *.sce file can be imported into the list. From the File menu, select Import Scenarios. You are first prompted for the path of the *.sce file to be imported, and then the import occurs. The new scenarios are appended to the list. Imported scenarios are renamed as necessary to ensure that all scenario names are unique in the currently open WISE file list.
Edit and Run Scenarios
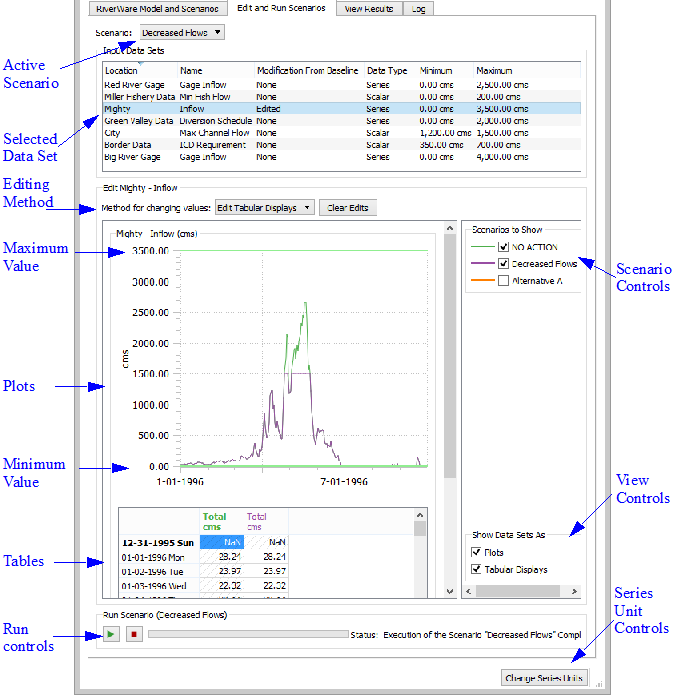
To edit input data and run the scenarios, select the Edit and Run Scenarios tab. As shown in Figure 1.2, you can activate a scenario, view and change the input data, compare the inputs with the inputs of other scenarios, and execute a simulation of the scenario to compute the results for the modified inputs.
To select the active scenario—the non-baseline scenario you wish to edit and simulate—select the Scenario button from the menu, then select the desired scenario from the list. You can create new scenarios on the Scenarios panel on the lower portion of the RiverWare Model and Scenarios tab.
Figure 1.2 Screenshot of the Edit and Run Scenarios tab
Select Data Sets to Modify
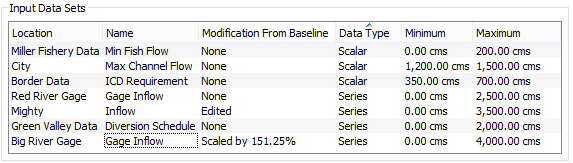
The Input Data Sets panel lists the active scenario's input data that can be modified from the baseline run. The columns of the list provide the following information for each data set:
• Location. Basin location of the data.
• Name. Name of the modeled quantity; it can be physical data (for example, “Inflow”) or water accounting data (for example, “Storage in the M&N Account”).
• Modification from Baseline. Indicates whether the data in the data set for the selected scenario differs from the data in the baseline. “None” indicates that no modification from the baseline values has been made; “Edited” indicates that one or more values have been changed.
• Data Type. Form of the numeric data associated with the data set. There are the following options:
– Series: Time series of values
– Table: Matrix of values
– Scalar: Single value
• Minimum and Maximum. Minimum and maximum values permitted for the data set. These are optionally established by the developer for Scalar and Series data.
Note: All scenarios contain the same list of Input Data Sets. Values in those data sets may vary between scenarios. These variables are a subset of the models input, selected by the developer, and common to all scenarios for a given WISE file.
Tip: Series data units, including the Minimum and Maximum, can be modified to show Flows as Volumes over the timestep and vice-versa, as described in “Series Units”.
Modify a Data Set
To change the values for one or more input data sets, select the data from the Input Data Sets list. Then, controls for modifying values are displayed below the Input Data Sets list. These controls vary according to the data type: Series, Scalar or Tables.
Note: You can edit multiple series data sets at once using scaling and offsets as described in“Modify Series Data”. You can only edit scalar values or tables one at a time.
The edit panel displays values for all displayed scenarios to allow comparison of input values, but only the values for the currently active scenario can be changed, On the Scenarios to Show panel to the right of the data display, select which scenarios’ data to display and the display color associated with each.
Modify Series Data
When one or more series data sets is selected in the Input Data Sets list, the edit controls consist of a plot and a table of values. The plot shows the data associated with the data set, with each scenario’s data plotted using its color.
Note: You can edit multiple series data sets at once as long as each series has minimum and maximum values specified by the developer. If these bounds were not specified, then you can only edit one data set at a time.
Either the plot or the table can be hidden by clearing the appropriate checkbox to the lower right of the panel. See “Plot Controls” for details on plotting.
The table of values has one row for each date in the series, listed on the left, and one column for each scenario. The columns have a label (may be created by model developer) and the units of the values. (The color of the label corresponds to the color of the scenario associated with that column).
There are three methods to edit the selected series data sets:
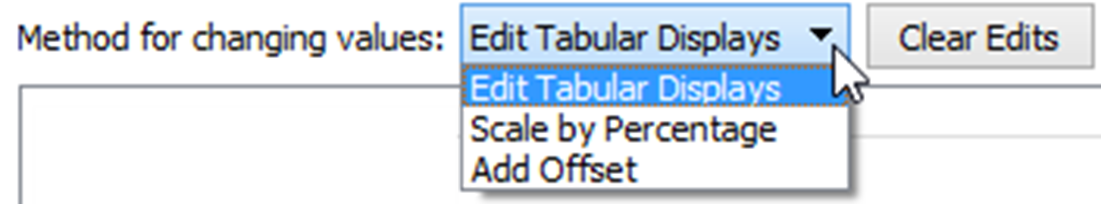
Use the Clear Edits button to revert any changes back to the baseline data
Note: When switching between methods, the data is always reset to the baseline data.
The display units for series data can be modified to show Flows as Volumes over the timestep and vice-versa, as described in “Series Units”. You can modify the input series data in either display unit.
Edit Tabular Display
When in the Edit Tabular Displays mode, you must enter the values for the desired input data. You can either type in the new values or copy and paste them. To enter a value into one or more cells of the table, first select the cells you would like to change, type in the number, and then press Return.
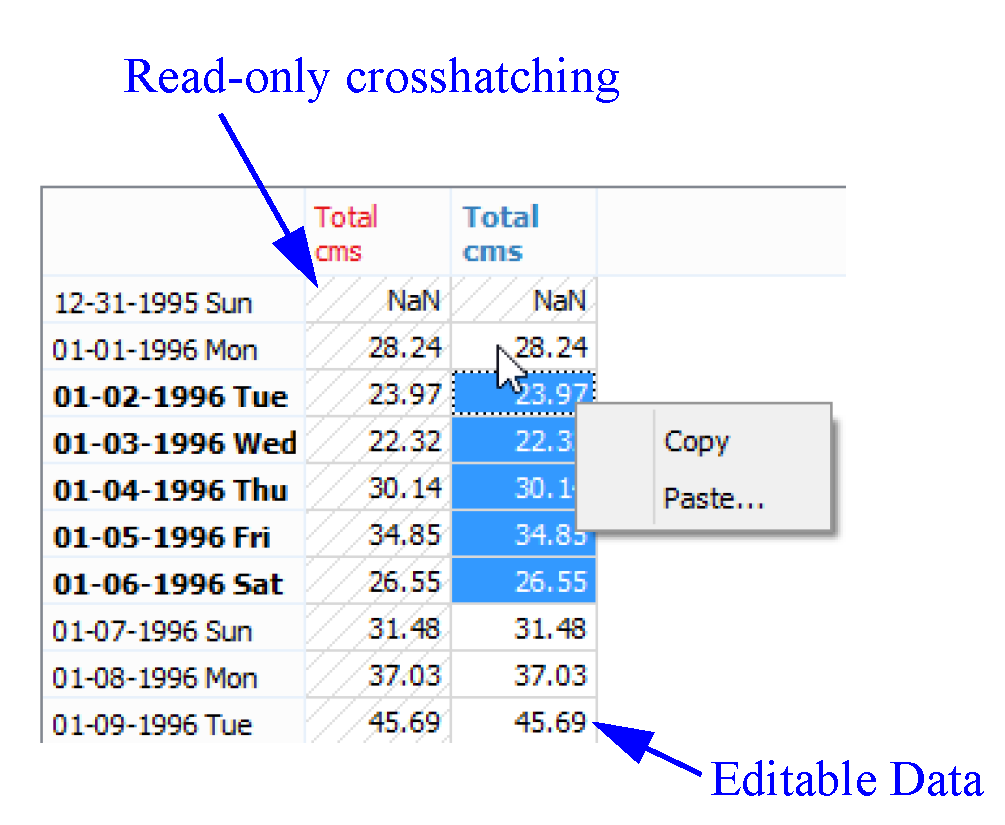
Only values for the active scenario can be edited, and of those, only those that were provided as inputs to the original RiverWare model run can be edited. That is, if the series value for a particular date was computed by RiverWare and not originally input by the model developer, then it is not editable. Non-editable values show cross-hatching and cannot be changed.
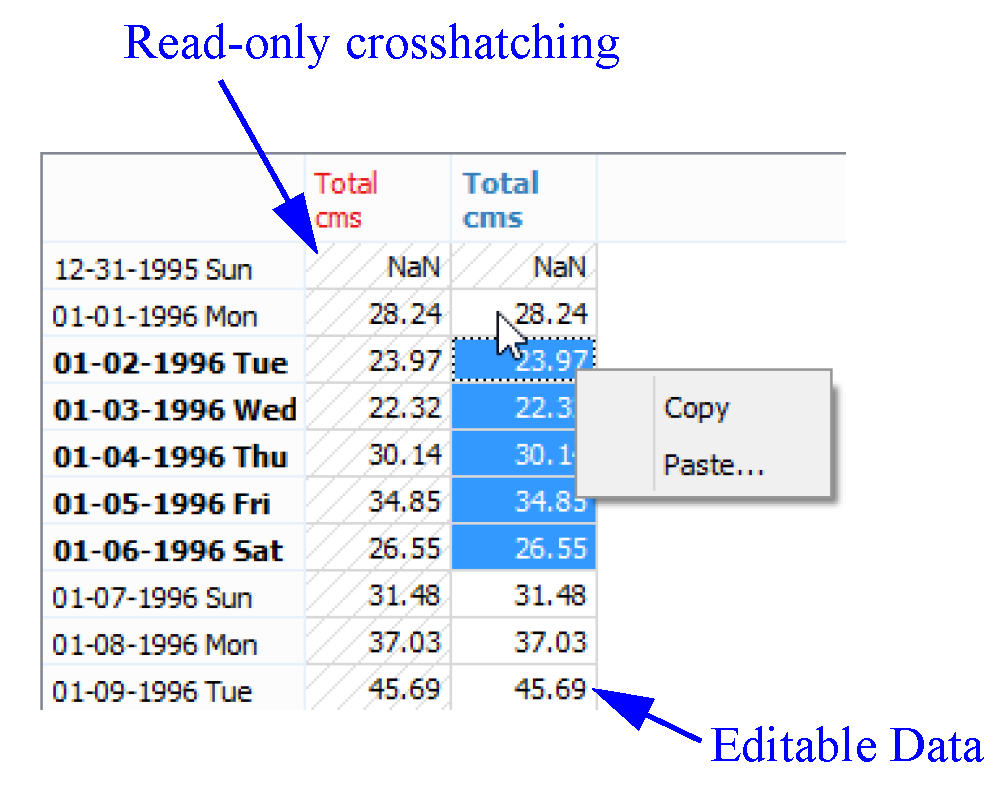
See “Edit Operations and Copy To and From Excel” for instructions on how to enter values into multiple cells, and how to copy and paste to and from other applications, such as Excel.
Scale by Percentage
When in the Scale by Percentage mode, you can use the scale edit box and/or the slider to set the percentage to scale all input values in the series data sets. The screenshot shows a sample scaled data set.
Figure 1.3 Screenshot showing a dataset that is scaled by a percentage
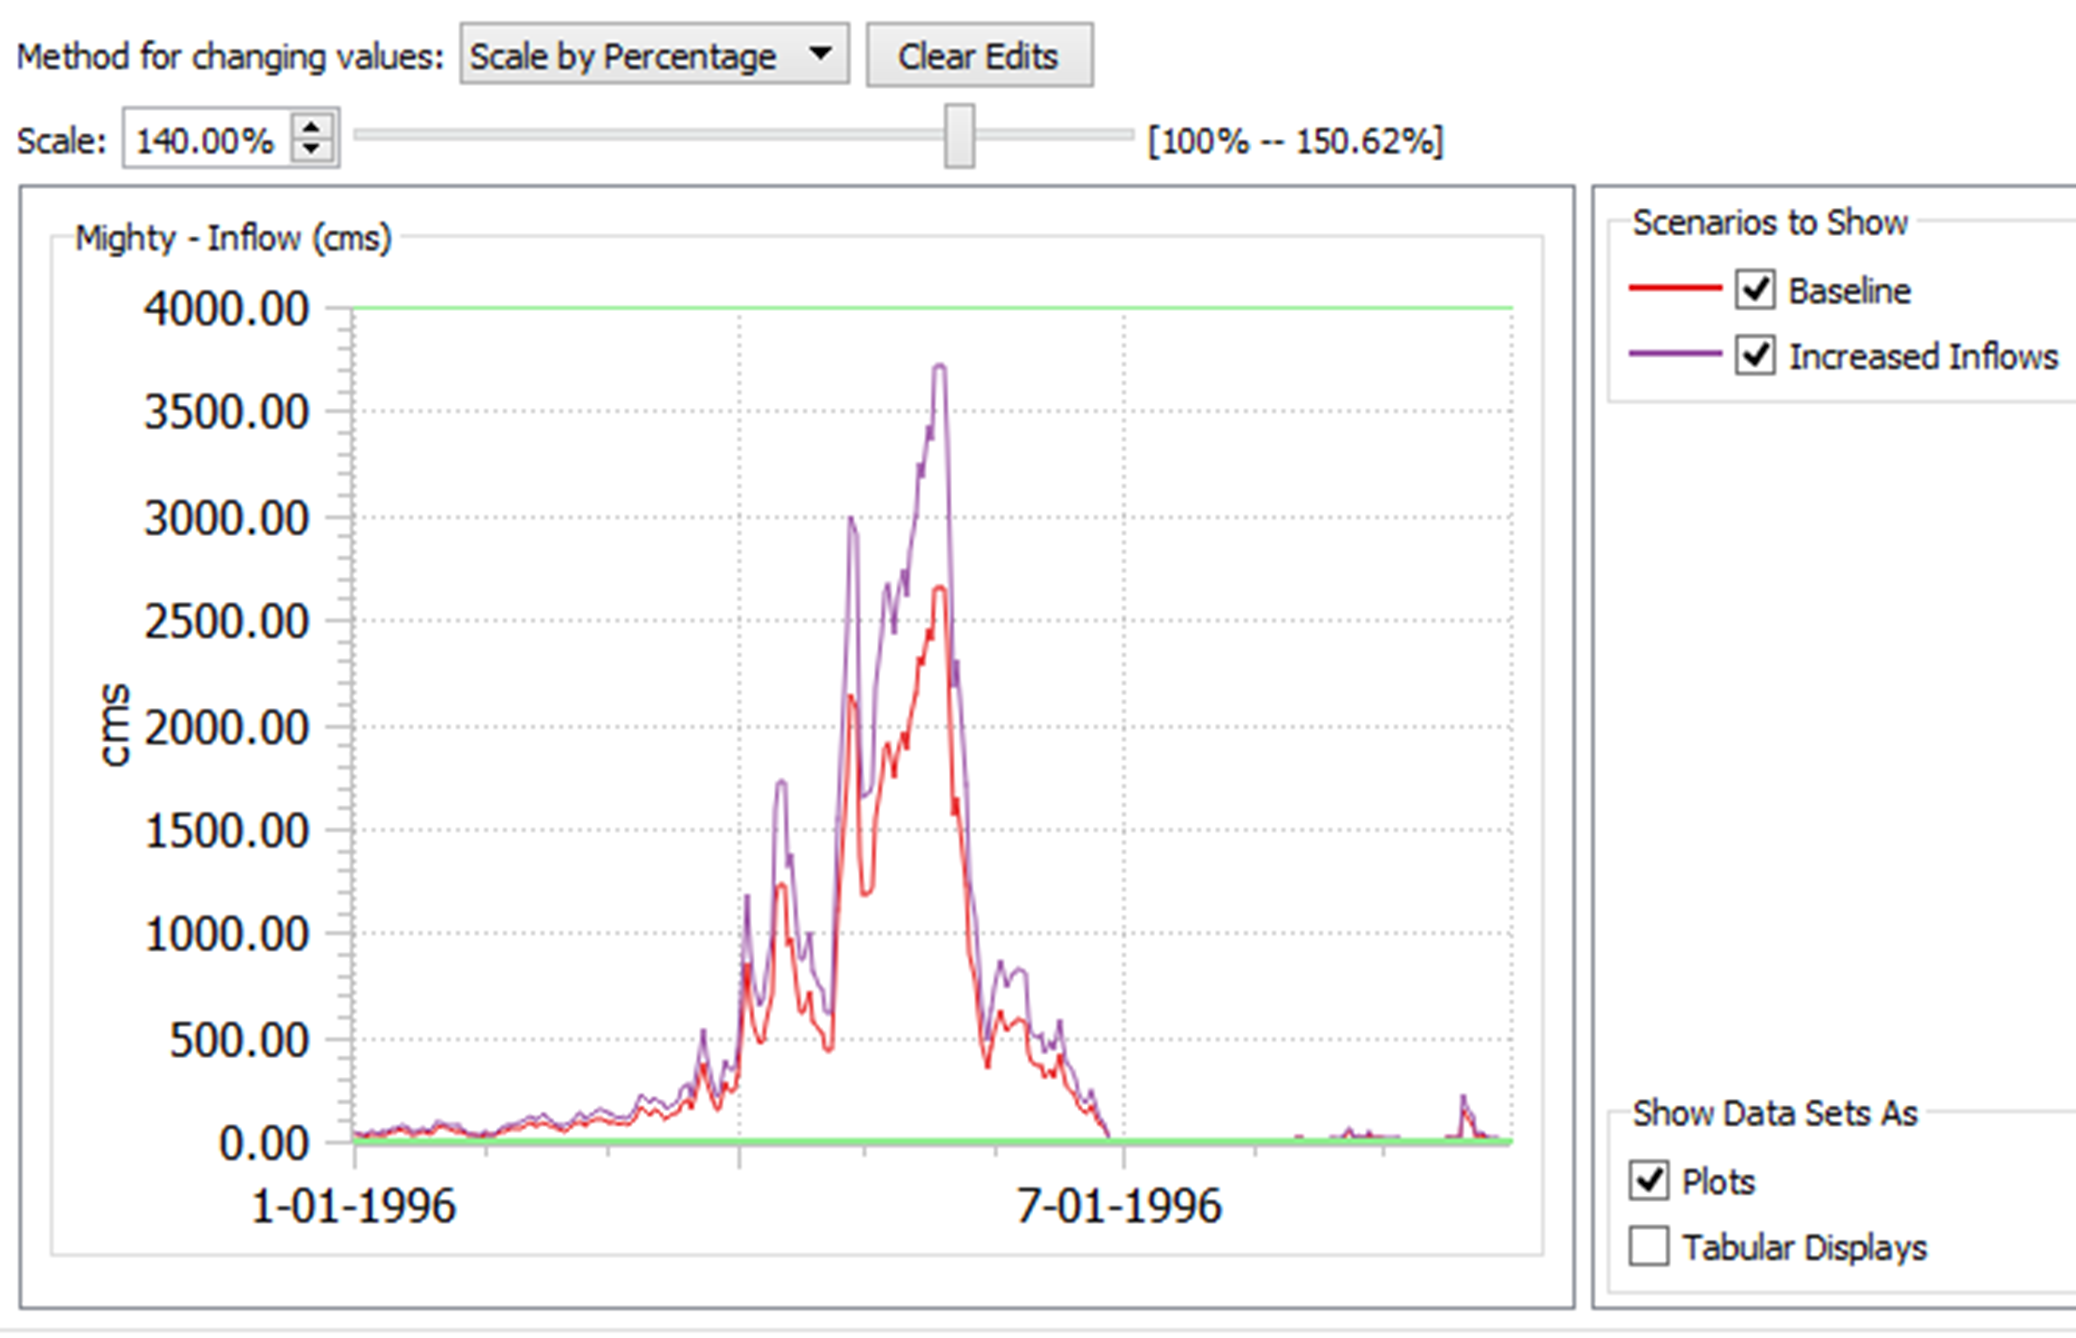
Note: The limits of the slider and the edit box use the Minimum and Maximum values for all data sets. Therefore, the maximum scale will be such that one data point reaches the maximum value at some point in the time series. Other data sets may not scale to the full range but you could specify their scale by editing them individually.
Add Offset
When in the Add Offset mode, you can type in an offset and/or move the slider to set the offset that will be added to all input values in the series data.
Figure 1.4 Screenshot showing a dataset that is offset by a value
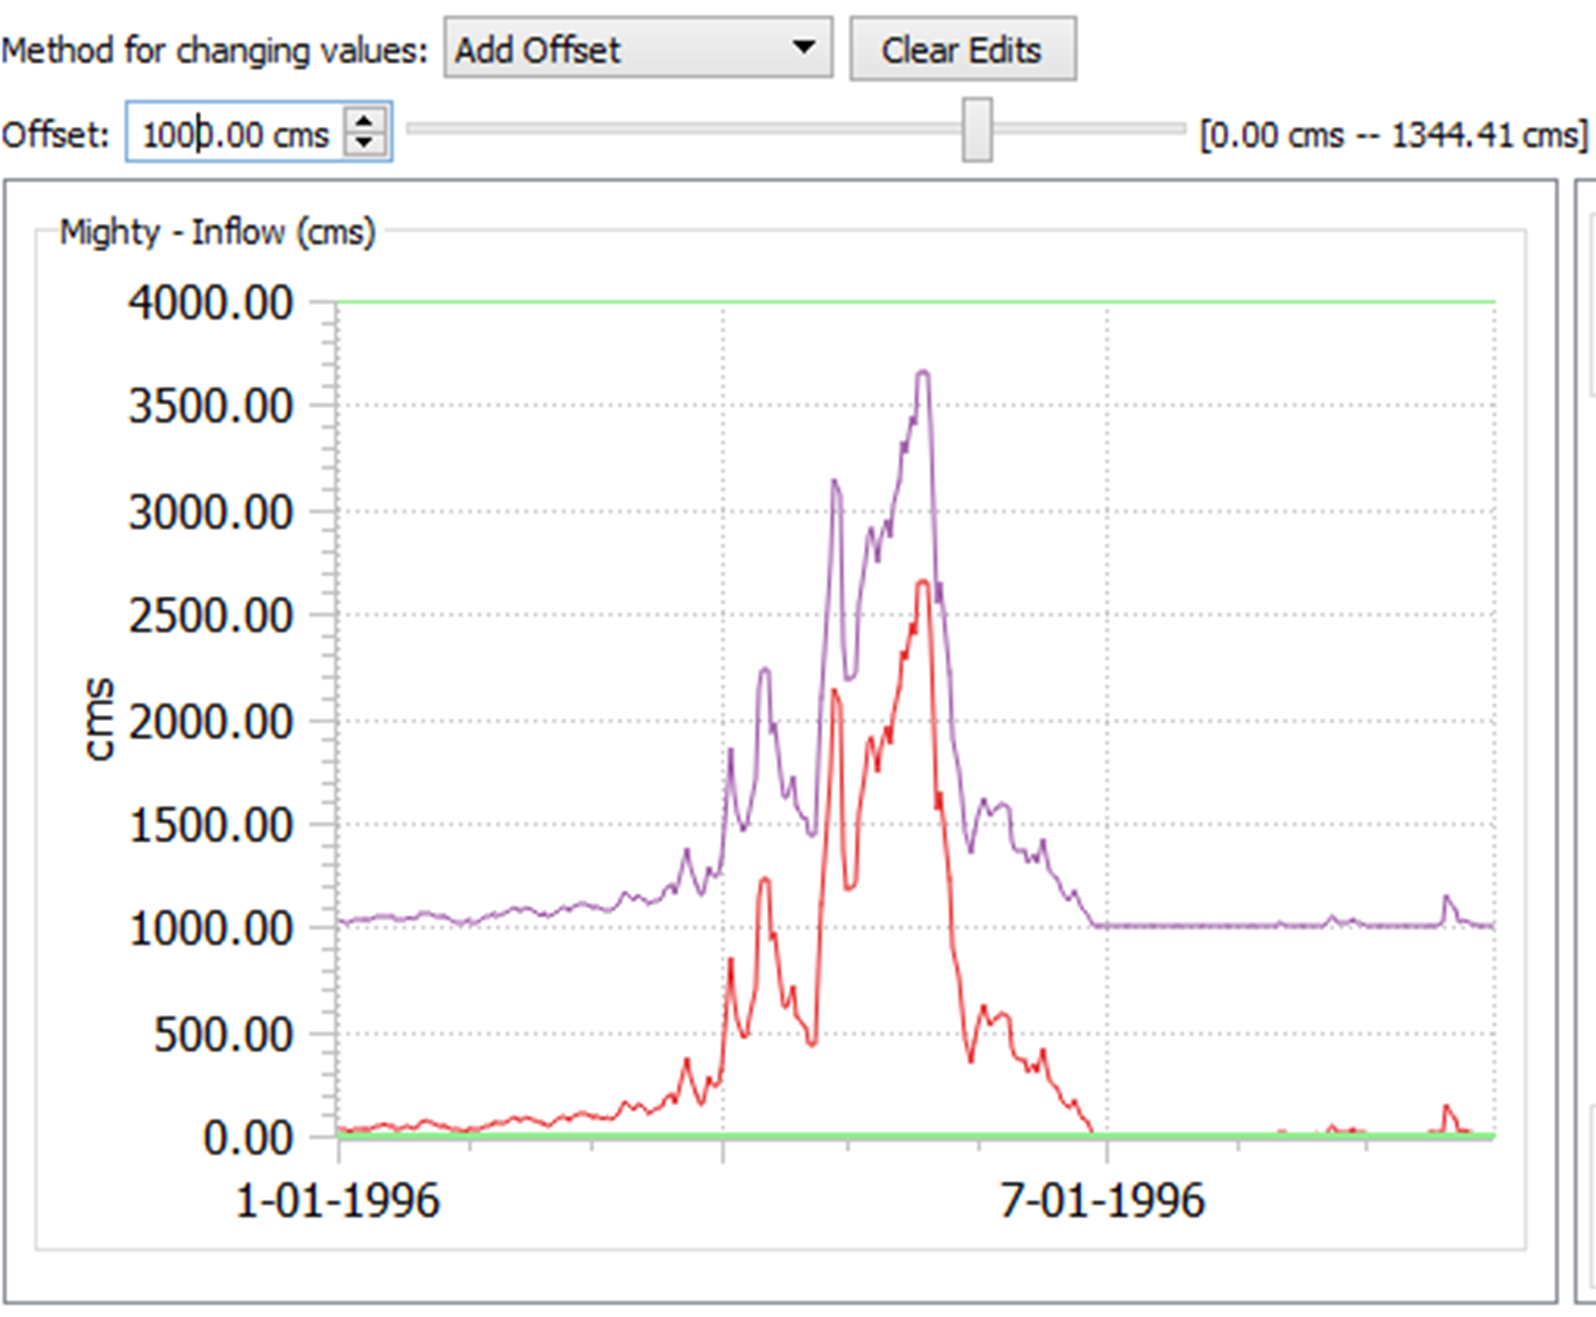
Note: The limits of the slider and the edit box are found by taking the minimum and maximum values for all data sets. Therefore, the maximum offset will be such that one data point reaches the maximum value at some point in the time series. Therefore, other data sets may not reach their maximum or minimum values.
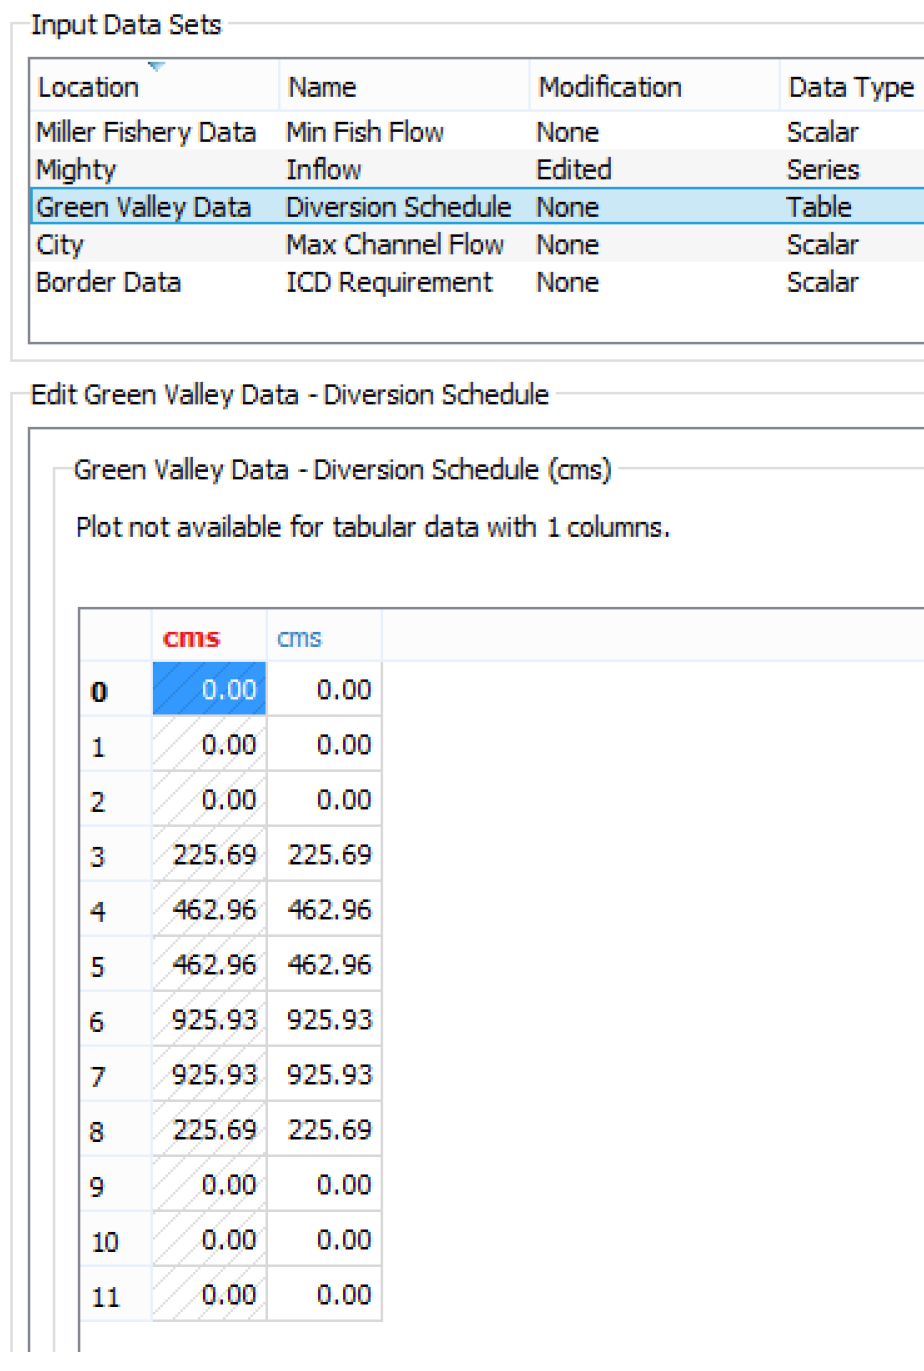
Modify Table Data
When a table data set is selected, the edit panel displays a table of values. The rows are indexed and may also have a text label. The color-coded columns, one for each scenario, show units and possibly a title. Only values in columns associated with the active scenario can be edited.
Note: Two-column tables also show a plot, when possible. Other tables only show only data.
See “Edit Operations and Copy To and From Excel” for instructions on how to change values in multiple cells, and how to copy and paste to and from other applications, such as Excel.
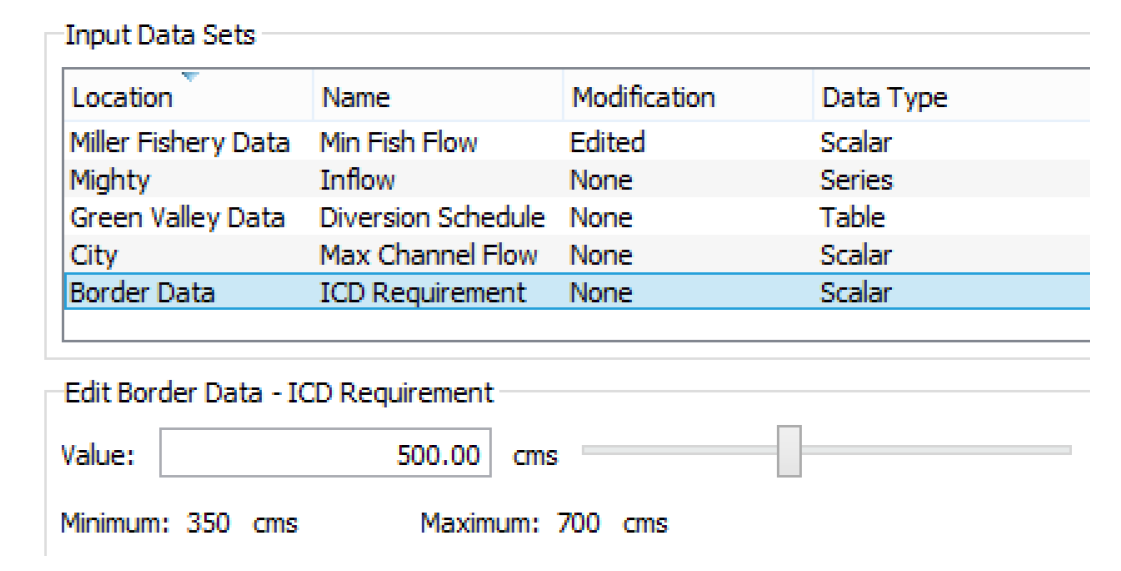
Modify a Scalar Data Set
When a scalar data set is selected, the edit panel displays an editable value and possibly a slider.
To change the value either enter a new value into the Value box or drag the slider to the desired value. The Minimum and Maximum values configured by the Model Developer are also shown. They define the limits of the slider.
Edit Operations and Copy To and From Excel
Values that are read-only are displayed with a light gray crosshatching.
Note: Only one tab supports editing of values, the Edit and Run Scenarios tab.
To enter a value into one or more cells of the table, first select the cells you would like to change, type in the number, and then press Enter. You can also select one or more cells and copy and paste from or to another application, such as Excel.
The following is a common workflow involving Excel.
1. Highlight a range of cells.
2. Right-click and select Copy.
3. In Excel, paste the data into a range of cells.
4. Edit the data in Excel using formulas and other techniques.
5. Copy the desired cells in Excel.
6. In the RiverWISE Edit and Run Scenarios tab, highlight a range of cells and right-click.
7. Select Paste to bring in the data.
Copy data to Excel or other application. To display or analyze simulation results in Excel or other tools, copy data from RiverWISE and paste it into another application.
Use the following steps in the RiverWISE Edit and Run Scenarios or View Results tab.
1. Highlight a range of cells or entire columns of data.
2. Right-click and select Copy.
3. In Excel or other application, paste the data into a range of cells.
Paste data from Excel or other application. To import data from other tools, copy the data and paste it into the Edit and Run Scenarios tab in RiverWISE.
1. In Excel, highlight a range of cells, such as a column of data.
2. Right-click and select Copy.
3. In the RiverWISE Edit and Run Scenarios tab, highlight the desired cells. Only the currently selected scenario is editable and will not have cross-hatching.
4. Right-click and select Paste.
Execute a Scenario
After modifying input values, execute the scenario to generate the new results. Select the Run button  at the bottom of the panel. The bar to the right indicates the progress of the simulation, and the Status label reports the state of the simulation.
at the bottom of the panel. The bar to the right indicates the progress of the simulation, and the Status label reports the state of the simulation.
Note: Scenario execution can vary from seconds to hours, depending on many factors including the size of the basin, the number of time steps in the simulation, and the machine on which RiverWISE is running.
To stop a simulation select the Stop button  . The simulation will be halted when it reaches a point that is the next valid stopping state.
. The simulation will be halted when it reaches a point that is the next valid stopping state.If a scenario execution quits unexpectedly, you can try changing the input data. Otherwise, contact the model developer with the data that resulted in the aborted run. RiverWISE is not intended for debugging errors or fixing modeling issues, only for conducting runs and showing comparison results. The model developer can analyze the issue and advise a solution, either modified data or generation of an entirely new WISE file.
As a Stakeholder, you can communicate the issue to the Model Developer using any of the following methods:
• Export the Log messages or entire text information. See “Log Diagnostic Messages” for details.
• Export the scenario that you created, using the File, then Export Scenarios. See “File Menu” for details.
You can then provide this file to the Model Developer for further debugging.
Model Developers can also export a RiverWare model file that represents the current state of the system.
View Results
The View Results tab presents the result data sets for selected scenarios in current list. Figure 1.5 identifies the main areas of the screen.
Checkboxes in the following groups provide display filters based on several attributes.
• Scenarios to Show. Select the checkboxes to show data for the desired scenarios. These controls also provide a color legend for plots and tables (column headers)
• Locations to Show. Select the checkboxes to select the desired basin locations.
• Data Sets to Show. Select the checkboxes to indicate which data sets will be shown. Only data sets associated with currently shown locations are shown.
• Show Data Sets as. Choose to show data as either tables or plots.
• Change Series Units. Choose to show series data contain flows as volumes or vice versa. See “Series Units” for more information.
By default the series results data are shown as plots and tables; either the plot or the table displays can be hidden by clearing the appropriate checkbox to the lower right of the panel. See “Plot Controls” for details on plotting.
Figure 1.5
Log Diagnostic Messages
The Log tab displays diagnostic messages generated by RiverWare. These messages are intended for trained RiverWare model developers, hence are generally not of direct interest to RiverWISE users. They often use different terminology from that employed by RiverWISE and reference internal simulation processes with which a RiverWISE user might not be familiar.
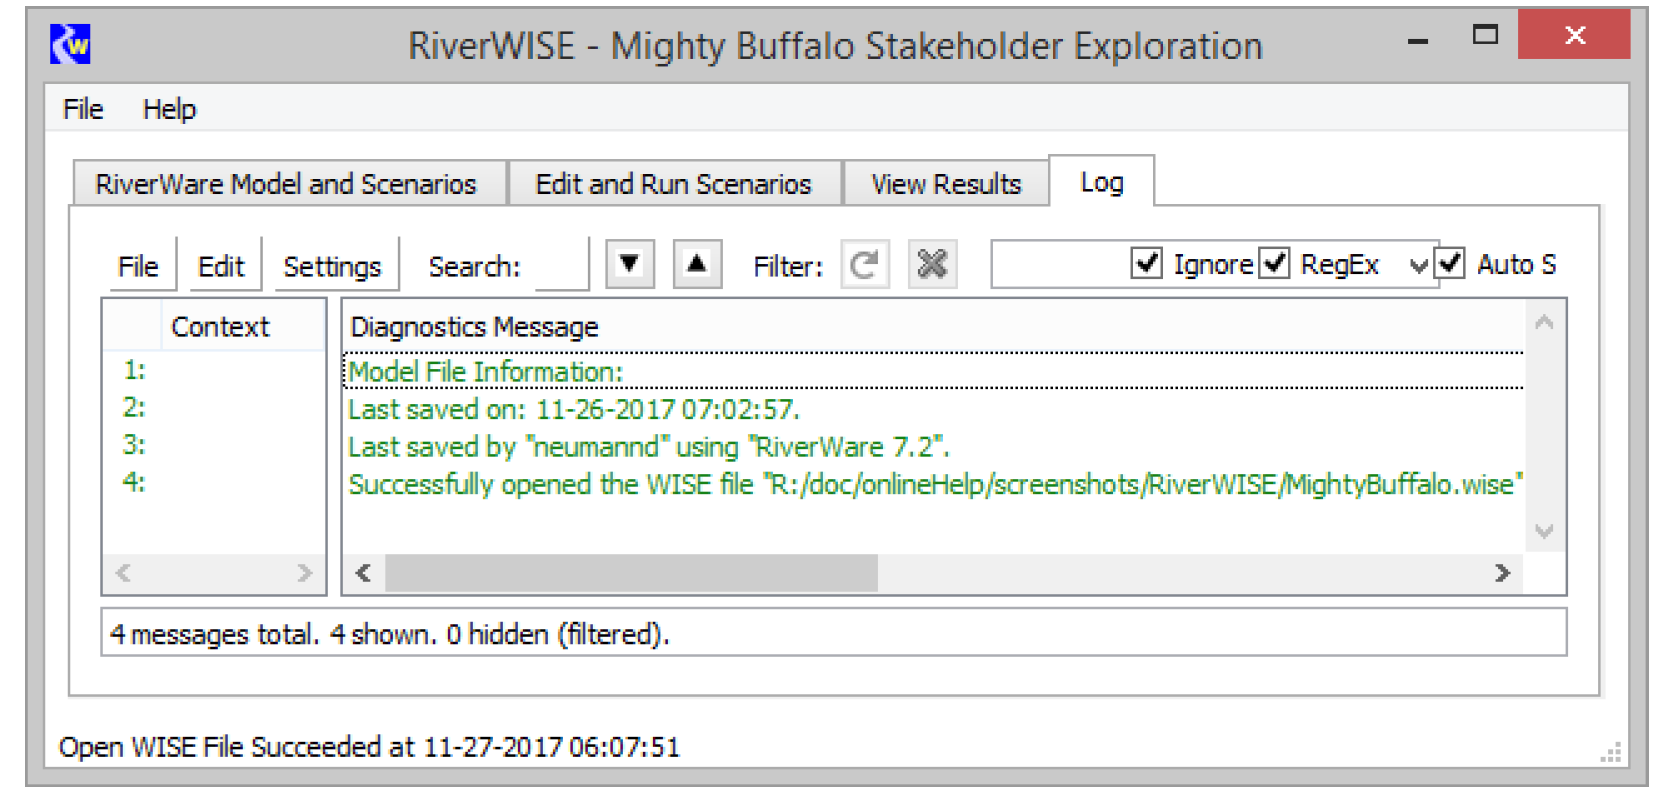
Following are some useful menu items if you have a problem and want to send the diagnostics to the Model Developer.
• File, then Save Diagnostic Messages to File. Save all diagnostics in the window to a text file which you could send to the model developer.
• Edit, then Copy Message Line. Copy a single line to the clipboard. You can then paste this in an email.
• Edit, then Copy Visible Message Lines. Copy visible lines to the clipboard.
• Edit, then Copy All Message Lines. Copy all the diagnostics to the clipboard.
• Edit, then Clear Messages. Clear the diagnostics from the dialog.
Save WISE File and Export Scenarios
Save the results of selected scenarios to a file to access those results later or to share them with others. Saved scenarios include changes to the input data sets as well as the results of executing that scenario. Once you have decided which scenarios you would like to save, you can choose a File operation that either bundles them together with the RiverWare model to which they apply or saves them completely separately:
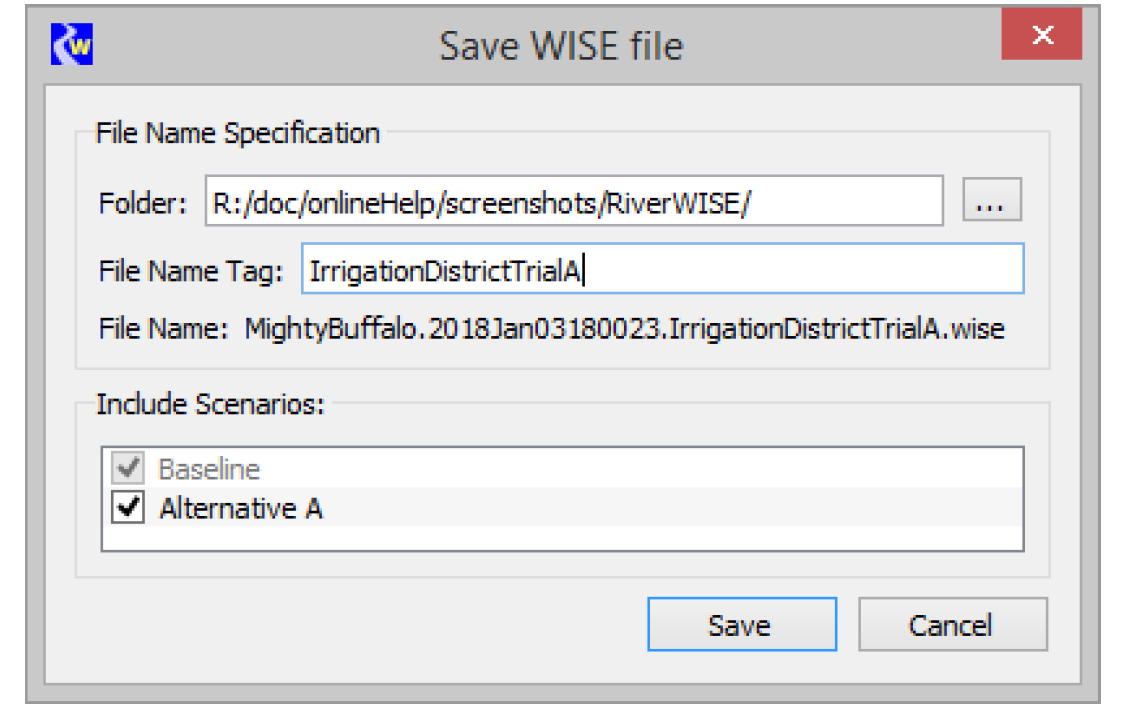
Save the WISE File
Creates a new WISE file with the RiverWare model and baseline scenario and additional scenarios you choose to add to it. From the File menu, select Save WISE File. You are prompted for the folder and a File Name Tag which are used to create a File Name. This File Name incorporates the original WISE File name, date (encoded timestamp), and your tag. You also select the scenarios to include. Figure 1.6 illustrates. Select Save to write the file.
Note: This file can be large because it contains the RiverWare model.
Figure 1.6
Export Scenarios
Creates a Scenario file (*.sce) to export selected scenarios. From the File menu, select Export Scenarios. You are prompted for the folder and a File Name Tag which is used to create a File Name. This File Name incorporates the original WISE File name, date, tag, and the extension sce. You also select the scenarios to include. Figure 1.7 illustrates. Select Save and the file is written.
Figure 1.7
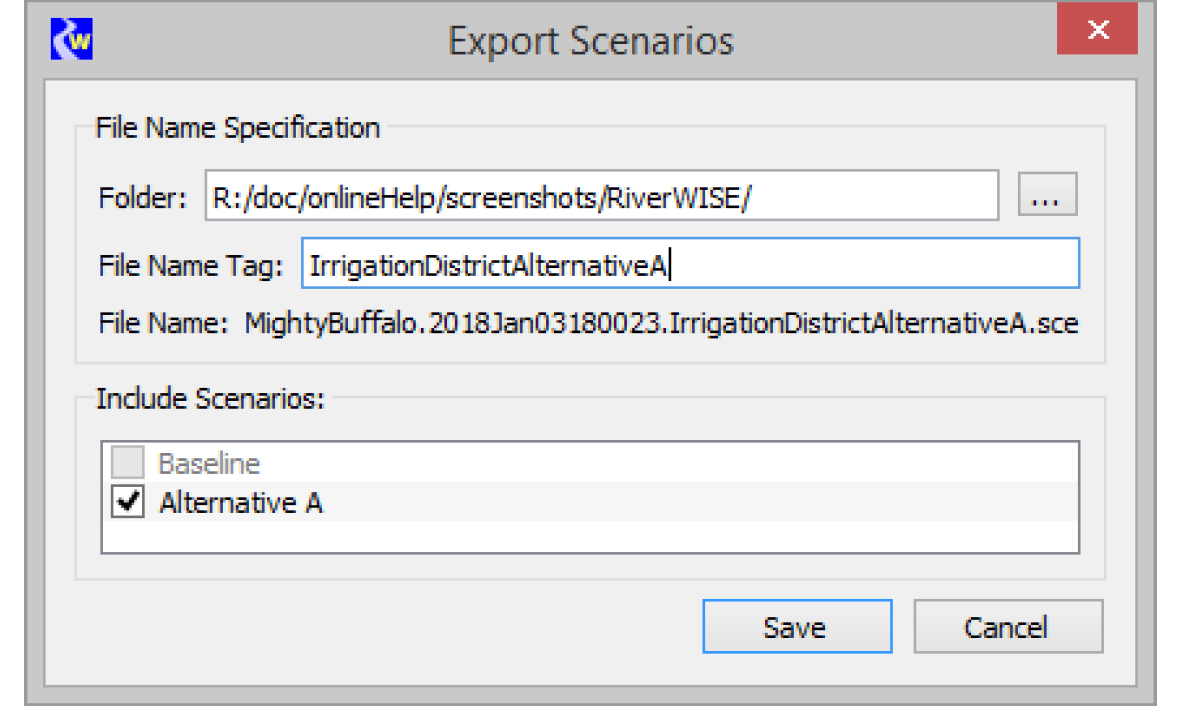
Note: Whereas WISE files are self-contained, Scenario files can only be imported into RiverWISE after the WISE file associated with the scenarios has been opened. The *.sce file is much smaller than the WISE file as it is strictly the scenario input and result data, and does not include the model.
Caution: A WISE file represents the state of a RiverWare model at the specific moment in when the file was generated by the developer. Each scenario applies to a specific original WISE file. It is not possible to import a scenario that was created in a different original WISE file. The naming convention used on *.wise and *.sce files will help you identify which scenarios can be imported into which WISE files. That is, the name and date in the file name, must match.
Plot Controls
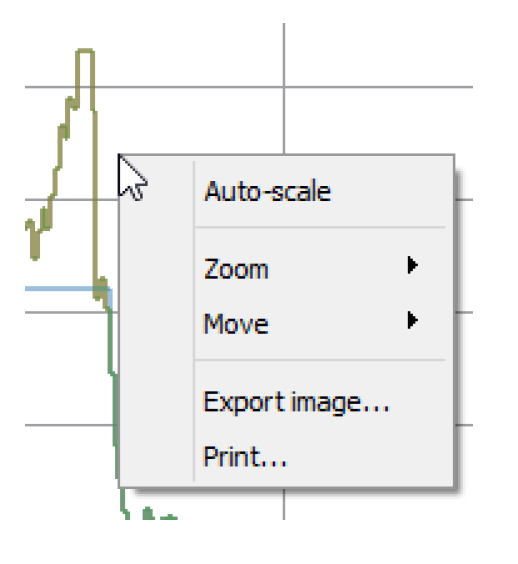
In any plot shown in RiverWISE, you can zoom in by drawing a rectangle. Right-click and select Auto-Scale to zoom to the full extent. The right-click context menu shows the following options:
• Auto-scale. Scale and translate the plot to include the entire range of data.
• Zoom. Zoom in, zoom out on either one or both axes.
• Move. Translate the plot Left, Right, Up, or Down.
• Export Image. Create an image file representing the plot. The resulting dialog allows you select the export image file extension, size, resolution, and destination. The available file type extensions are: *.bmp, *.jpeg, *.pbm, *.pgm, *.png, *.ppm, *.xbm or *.xpm.
Note: The image resolution affects only file formats that use compression. In general, you should use the highest resolution.
• Print. Send an image of the plot to an installed printer. You can create a PDF of the plot by printing to a PDF driver, if one is installed.
Series Units
RiverWISE supports a flow/volume display toggle for series data. Use the Change Series Units button, lower right corner of RiverWISE, to see the three possible values for flow or volume data sets:
1. Standard – Display flows and volumes without conversion. The native units of the data set is used.
2. Flow – Display volumes as flows (as appropriate). Show flows as flows and volumes as flows. Note, some volume data sets, like Storage, are not converted to a flow.
3. Volume – Display flows as volumes. Show flows as volume over the timestep. Show volumes as volumes
Selecting a new mode immediately changes all relevant displays of series data (tables, plots, and unit text), except messages in the Log tab. Data sets with other unit types are not affected.
Note: The button is not supported for WISE models whose timestep is variable-length; for these models, the controls are not shown.
Menu Operations
This section provides documentation of the RiverWISE menu operations.
File Menu
The File menu contains the following options for dealing with RiverWISE related files.
• Open WISE File. Closes the currently open WISE file, and opens a new one. You are prompted for the path of the WISE file to open, then it is opened.
• Save WISE File As. Saves the original model/run and baseline information along with any additional scenarios that you select. You are first prompted for the folder to which the new WISE file should be written, a custom tag, and to indicate which scenarios to include. Then the file is written. WISE files are written with the “.wise” suffix.
Note: WISE files always include the original baseline scenario, all other scenarios are optional.
• Export Scenarios. Writes a file containing selected scenarios. You are first prompted for the folder to which the new Scenario file should be written, a custom tag, and to indicate which scenarios to include, then the file is written.
Exported scenario information includes scenario description, input data and result data sets. Since baseline data sets are always included in their WISE file, they cannot be exported to Scenario files. Scenario files are written with the “*.sce” suffix.
• Import Scenarios. Reads a set of scenarios from a Scenario file and appends them to the list of current scenarios. You are first prompted for the path of the Scenario file to be imported, and then the import occurs.
Only scenarios that were exported from the currently open WISE file can be imported. Imported scenarios are renamed as necessary to ensure that all scenario names are unique in the currently open WISE file.
• Export RiverWare Model. Saves a RiverWare model file that corresponds to the last scenario execution. You are first prompted for the path of the file to which the model should be saved, then it is saved to that file.
The resulting model file can be provided to the original model developer, who can then load it into RiverWare and analyze differences aspects of the simulation that are not available in RiverWISE.
• Close WISE File. Clears all information associated with the current WISE file, losing any unsaved changes.
• Exit. Exits RiverWISE. Any unsaved changes are lost.
Help Menu
Following are the Help Menu options:
• Open Help. Opens the RiverWISE documentation (this document) in a separate application.
• About RiverWISE. Opens a window which displays information about the RiverWISE application, including version and copyright information.
Revised: 11/11/2019