
Tour of the Quick Plot
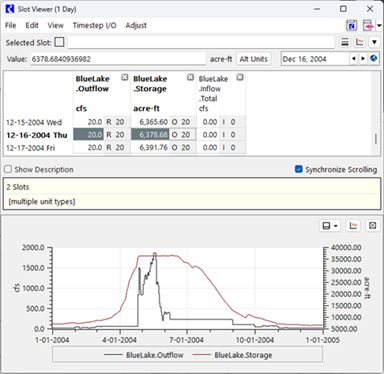
Figure 1.1 shows an example in which the Quick Plot panel is shown to the right within a Slot Viewer. Figure 1.2 shows the same view with the Quick Plot panel on the bottom. In both cases, the columns for two series slots are selected, so the data for those slots are displayed in the Quick Plot.
Figure 1.1 Slot Viewer (Series) with the Quick Plot panel shown to the Right.
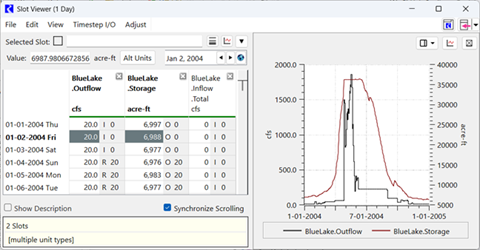
Figure 1.2 Slot Viewer (Series) with the Quick Plot panel shown on the Bottom.
Operations on the Quick Plot
The following annotated screen shot displays the operations on the Quick Plot:
Figure 1.3 Annotated image of the Quick Plot
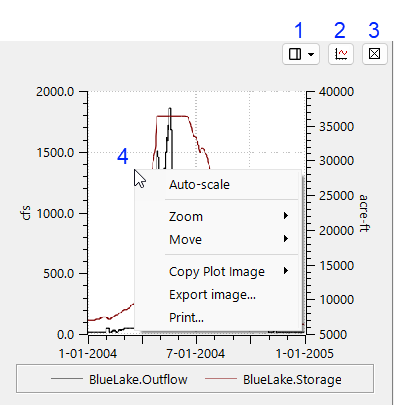
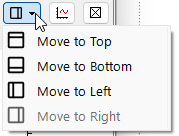
1. Move Position: reposition the plot to the top, bottom, left or right of the window.
2. Create Plot Page: create a new plot page based on the slot selection. It will then open the Plot Page Editor
3. Hide: hides the Quick Plot panel.
4. Right-click context menu: open many of the standard operations for scaling, zoom, pan, copy, export.
5. Click and drag to draw a rectangle to Zoom In (not shown)
6. Use the middle mouse button to pan. (Not shown)
Limitations
The following are limitations of the Quick Plot:
• Multiple slots can be plotted on one plot, but only two Unit Types can be shown on a single quick plot. Data for the third, fourth, and so on Unit Types are not plotted.
• The default plotting settings, configured in the Settings Manager are used for axis configuration, line types, range, and so on.
• Table Slot data can be shown, but only one table is shown at a time.
• The relative sizes of the window and panels are not saved and may need to be resized frequently. This may be improved in the future.
Revised: 05/30/2026