
Analysis and Output Tools
Once a run has been made, there is typically a large volume of data to analyze. This section provides an overview (and links to additional documentation) of some of the features available to view, analyze, an debug model results. This includes plotting, statistical slots, SCTs, expression slots, and the model run analysis tool. The model run analysis tool includes a special results section which includes information specific to USACE methods.
Plotting
The RiverWare plotting utility allows the user to plot series, tables, contours, parametric, and periodic curves; see Plotting in Output Utilities and Data Visualization for details on this utility. In the plot utility, you can quickly choose to plot either all the data in a slot  , only data in the run range
  , or only data in a specified range
  .
.
, only data in the run range , or only data in a specified range . Saved plots configurations can be moved amongst models by exporting the configuration from one model and then importing into another. See Exporting and Importing Output Devices in Output Utilities and Data Visualization for details on this utility.
Statistical Slots and Probability Plots
Statistical Table slots compute statistics on a series of data. The user creates the slots and then selects the series slot for which the analysis is to be performed. Then, the user selects the statistical function to use and applies data filters as necessary. (Make sure to configure the statistical slots to only analyze data from the run range, not data before the start timestep or after the finish timestep. To do this, in the filter, select the Run Range option) The result is a table of data that can be viewed, plotted, or exported. Statistical slots that result in data that is decimal or percent (i.e. an exceedence curve) can be plotted with a probability scale. This is similar to plotting the data on probability paper.
See Statistical Table Slots in User Interface for details on statistical slots.
SCT
Another useful tool for viewing data is the System Control Table (SCT). The SCT is a customizable, editable spreadsheet view of slots in a RiverWare model. The SCT presents series data in a scrollable grid of numeric values and lists other types of slots for easy access. The SCT is a view into the model and as such, the user can have more than one SCT for a given model. For example, the user may create (and save) an SCT that shows all reservoir Outflows or one for all reservoir Storages. Or, the user may configure an SCT to show all of the desired information about a single reservoir.
See SCT Overview in System Control Table (SCT) for details.
Expression Slots
Expression slots are computational expressions that can contain slot names and other variables. The user can either create a Series Slot with Expression or a Scalar Slot with Expression. They are used to calculate any quantity the user wishes to see. For example, the user may create slots that compute “combined Storage of all Reservoirs,” “weekly average Outflow of Reservoir 1,” “the ratio of Hydrologic Inflow to Control Point Inflow.” The logic for an expression slot is developed in the RiverWare Policy Language (RPL). Expression slots can be evaluated automatically at the beginning of run, beginning of timestep, end of timestep or end of run. They can also be evaluated outside of a run.
Therefore, there is a lot of flexibility with expression slots and are very useful for debugging, post processing data, and other analysis. See Series Slots With Expression in User Interface for details on expression slots.
Model Run Analysis—Special Results Details Dialog
The Model Run Analysis tool is a grid showing how each object solved on each timestep; see Rulebased Simulation in Debugging and Analysis for details on this utility. The Special Results Details dialog provides additional information for each object/timestep including information specific to USACE methods, as shown in Figure 6.1. This section provides more information on accessing and using the tool.
Figure 6.1
Accessing and Navigation
Access the Special Results Details dialog using the following methods.
• From the model run analysis tool
– Select the Details button and select Special Results. The details will be shown docked in the main Model Run Analysis dialog. Select the Detach button to use it as a separate dialog.

– On any cell in the Model Run Analysis dialog, right-click and select Show Special Results Details to show the details in a new window.
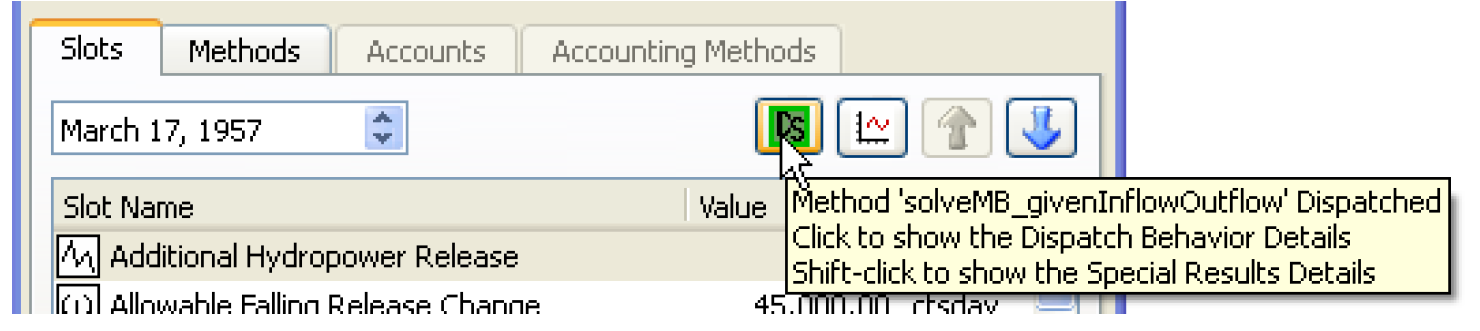
• From the Open Object dialog
– Select View, then Special Results Details menu to show the details in a new window.
– Shift-click the Dispatch button to show the details in a new window. The button's tooltip summarizes the dispatch behavior but also lists the behavior when the button is selected (open the Dispatch Behavior Details dialog) and when it is shift-clicked (open the Special Results Details dialog).
Figure 6.2
As with other model run details dialogs, Special Results Details dialogs can be undocked to display the information in a separate window. Because this dialog is naturally large due to the amount of information it displays, viewing it undocked is most likely preferred. Select the Detach button to undock and use it as a separate dialog. Use the File, then Dock in Model Run Analysis to redock it. When docked in the Model Run Analysis dialog, a splitter allows the dialog to be resized as necessary.
Layout and Overview
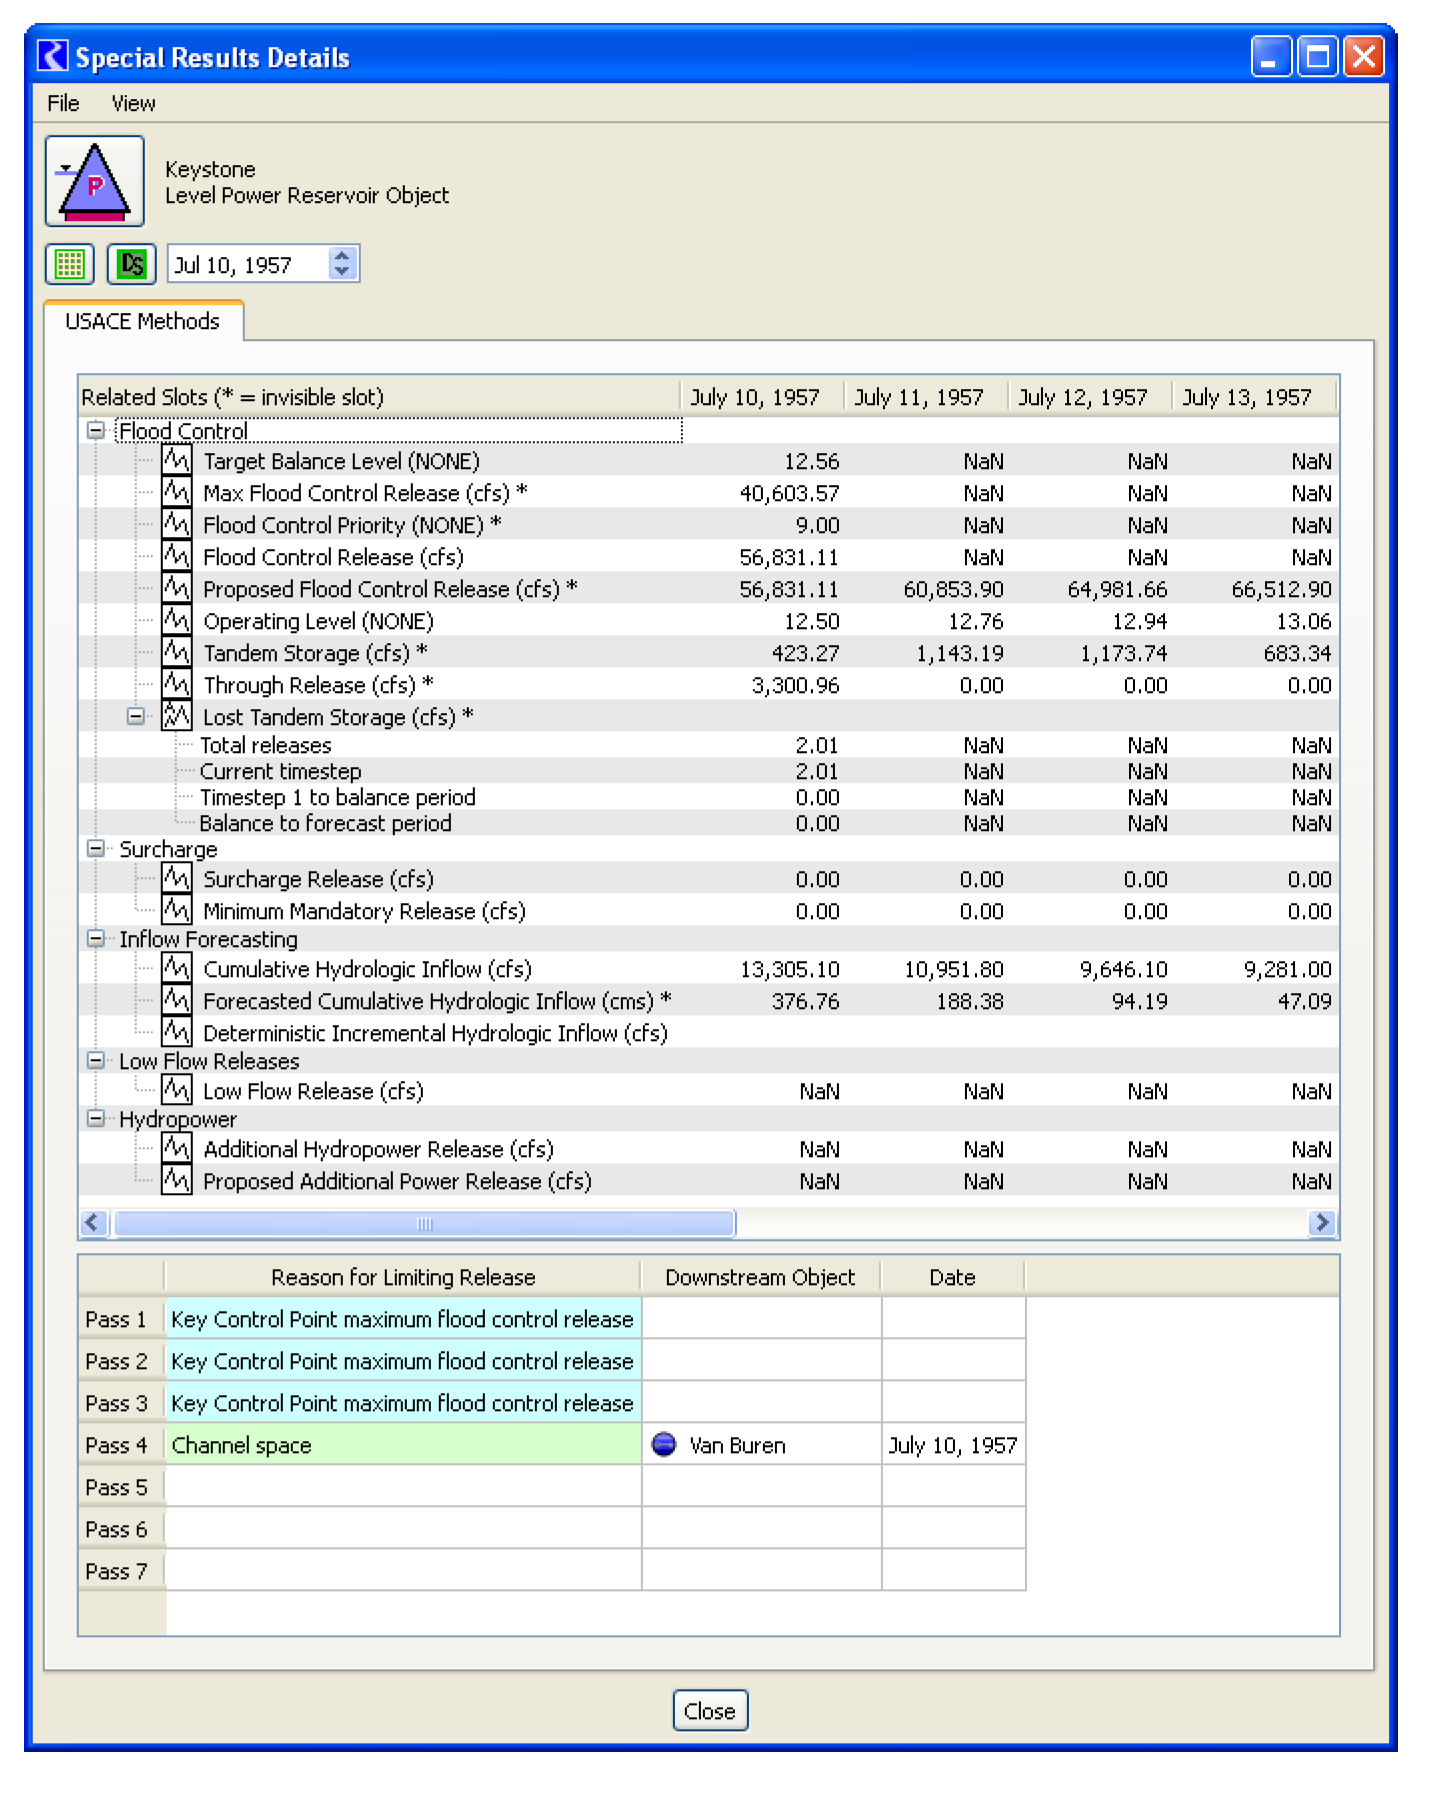
The Special Results Details dialog contains a tab labeled USACE Methods which presents information related to certain USACE methods described in this document. Only Reservoirs, Control Points, and Computational Subbasins have information that is presented by this dialog. Figure 6.3 shows the tool.
Figure 6.3
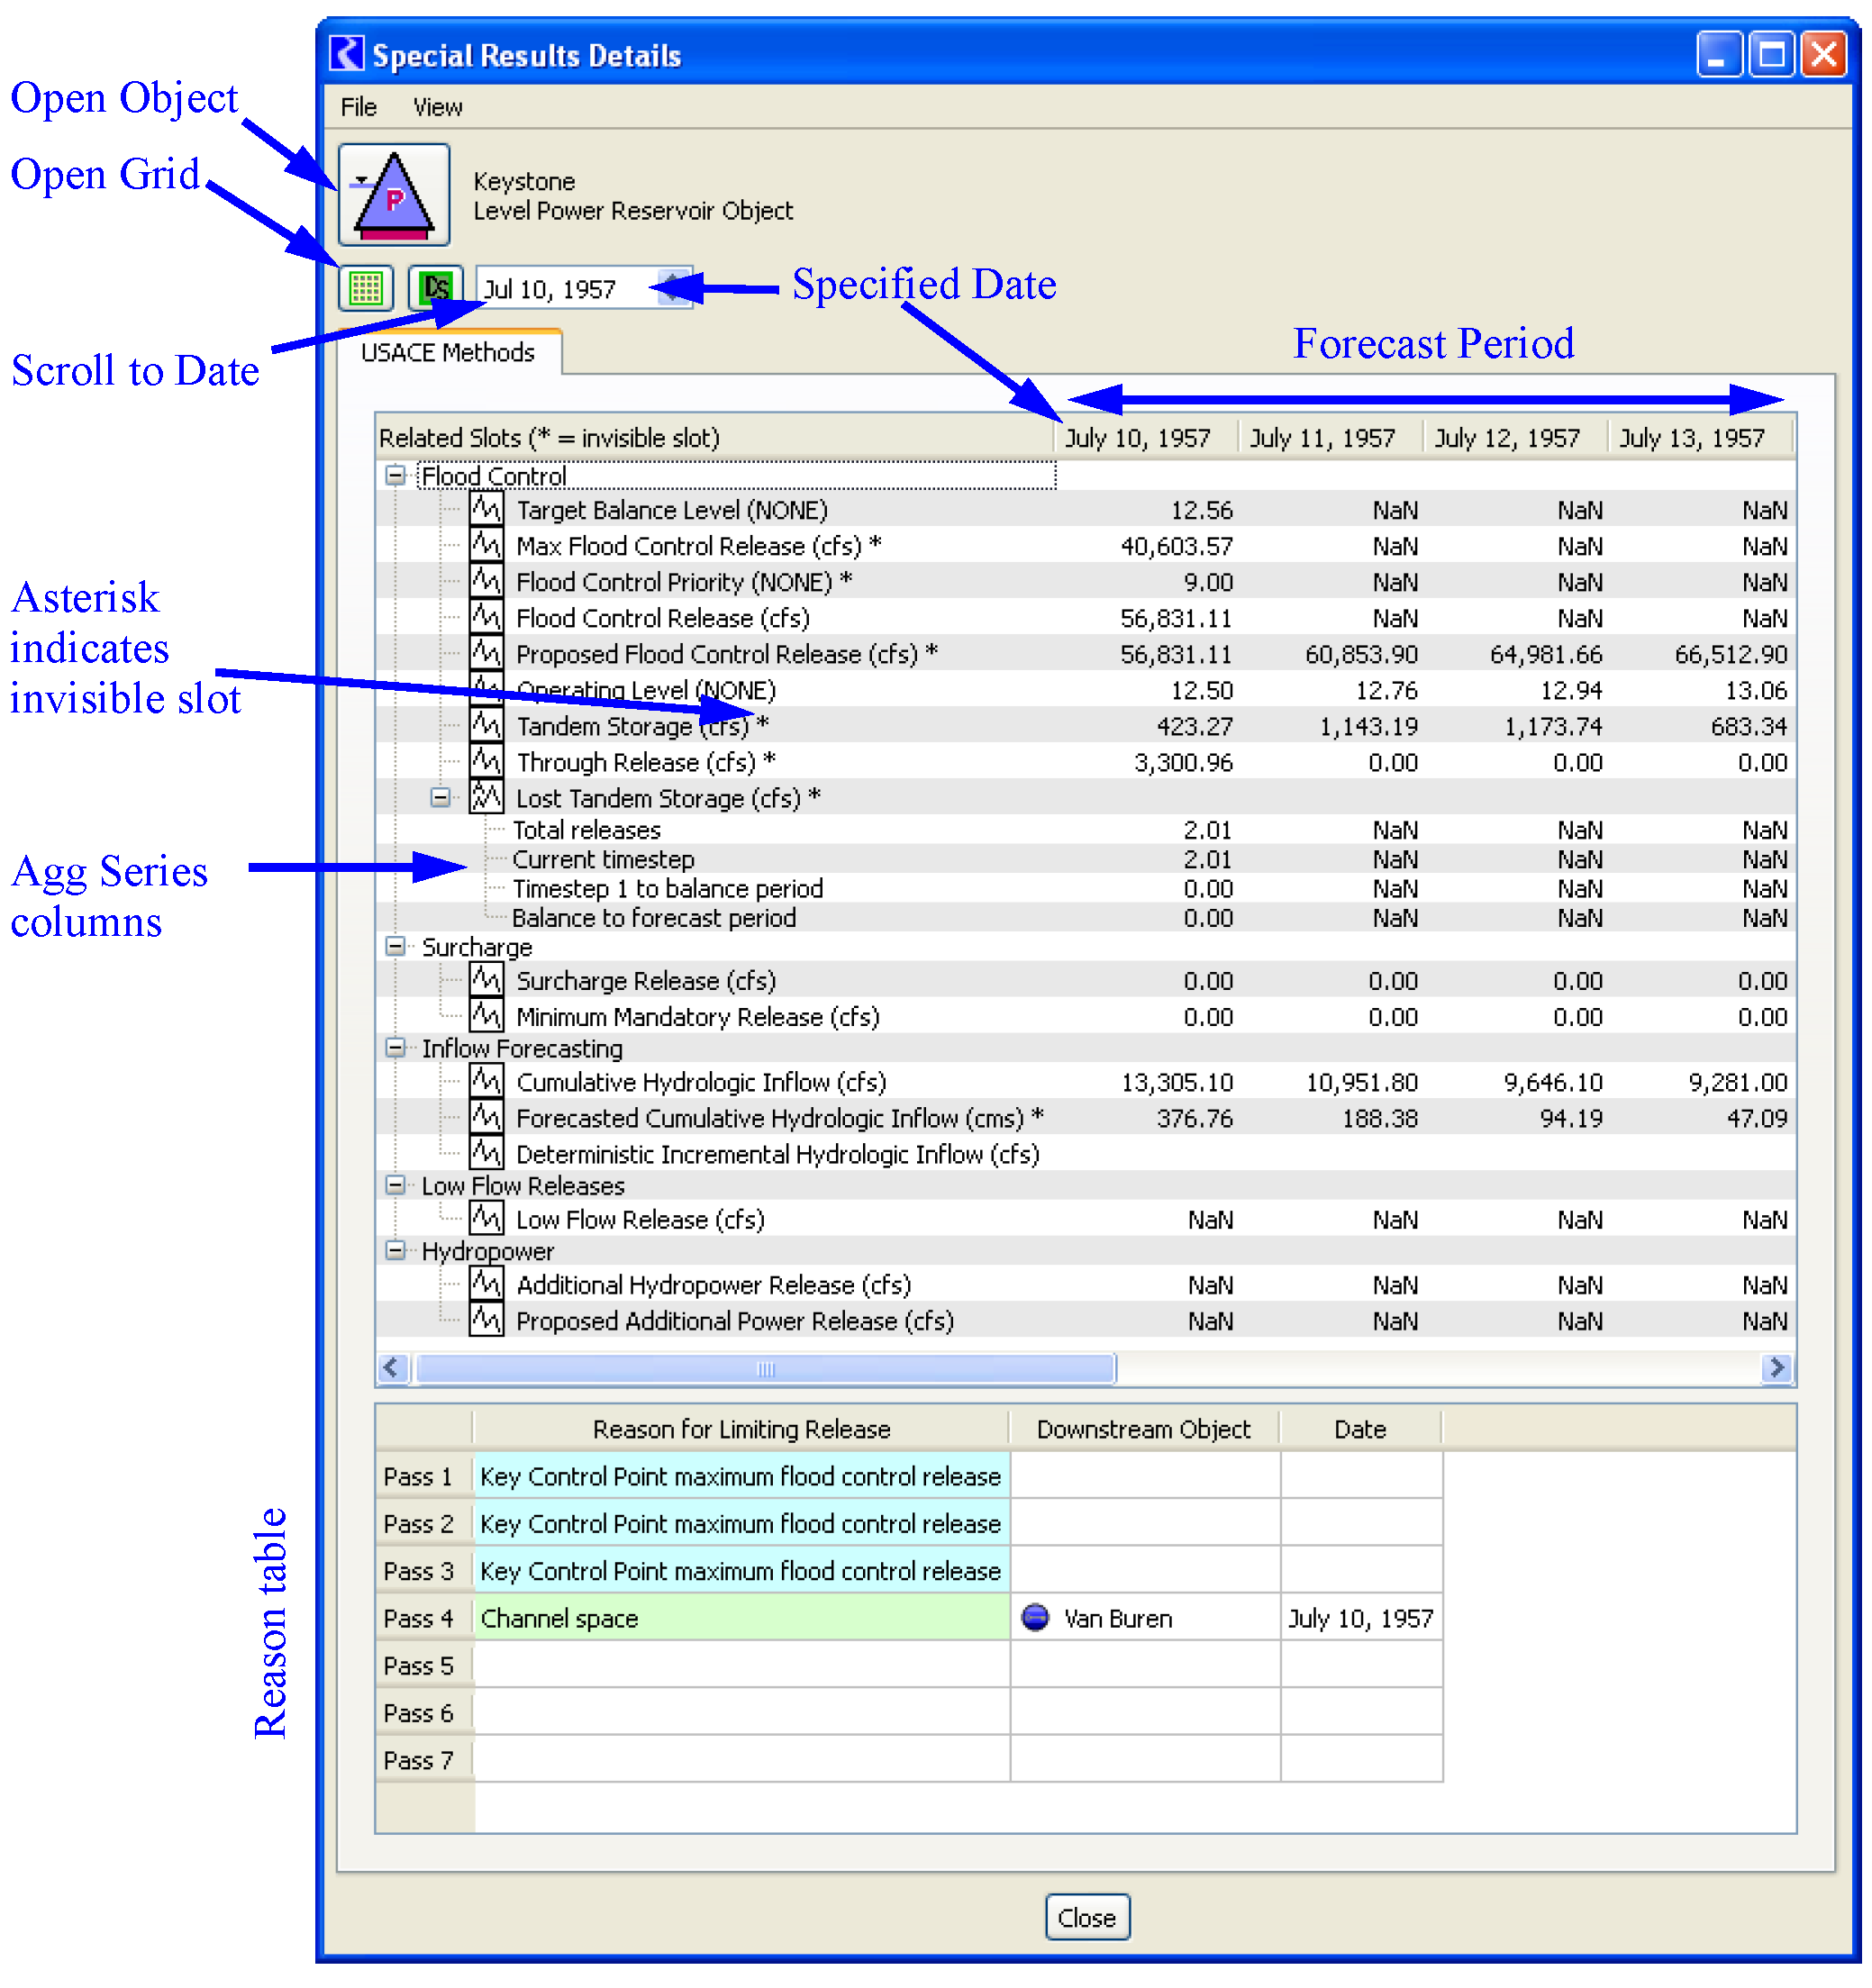
Related Slots
The USACE Methods tab displays results in two tables. The upper table displays the values of several series slots in the time range from the given timestep through the Forecast Period (the forecast period is taken from the computational subbasin which has a non-null Flood Control method selected, of which there should only be one).
The slots displayed are ordered into functionality groups: Flood Control, Surcharge, Inflow Forecasting, Low-flow Releases, and Hydropower. The displayed slots are those likely to be helpful in understanding the behavior of the various related USACE methods. This list of slots is based on the method selections and includes both intermediate results that are not normally visible to the user as well as regular slots that are closely related to the flood control algorithm. The slots are shown in a tree-view so you can control the display by selecting the + and - operations.
Note: Invisible slots are shown with an asterisk. This indicate they are not visible or accessible in other dialogs but are saved in the model file. These are slots that were temporary prior to RiverWare 6.1. This dialog is the only place to access these invisible slots. Display units are configured on the Unit Scheme. Also, you can create an exception to the scheme for this slot by opening the slot, then modify using the View, then Configure menu.
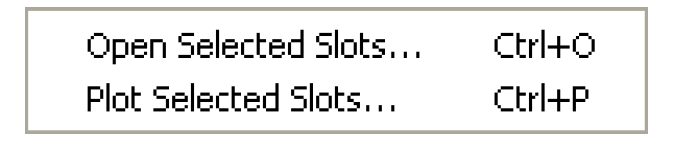
Any slot listed in this dialog (including the invisible ones) can be opened or plotted using right-click context menus.
Reason For Limiting Release Table
Table 6.1 provides diagnostic information on why the Flood Control release was limited. This table is only displayed on Reservoirs and is only populated when Operating Level Balancing is selected.
Note: Table 6.1 displays information that, prior to RiverWare 6.1, was encoded on the “Temp Reason” and “Temp Limiting Control Point” slots. Each row represents a pass of the flood control algorithm. Each time the flood control release is reduced by a constraint, the reason for the last reduction is written. On dates that have few or no passes, some rows will not have values. While diagnostics might refer to other forecast timestep, only the first forecast timestep’s reason (i.e. current timestep) is saved here. The Downstream Object and Date columns will have values if the reason is “Channel Space”. Otherwise they will be blank.
Diagnostic String | Discussion |
|---|---|
Spillway constraint | The spillway cannot accommodate any more outflow. This constraint applies to all outflows, including surcharge releases, through releases, and this object’s flood control release. |
Stepped hydrograph smoothing | The release was limited by the first release in a stepped-down hydrograph that releases the entire proposed flood pool volume over the rest of the forecast period with an Allowable Falling Release Change reduction at each timestep. This constraint is applied once, to the first timestep only. |
Channel space | Channel space at a downstream control point limited the release. The value in the Downstream Object column indicates which downstream control point is the cause and at which forecast Date. This information indicates which downstream control point is lacking in adequate channel space and limited a flood control release on each pass of the flood control algorithm. |
No increase after timestep 0 | On its last pass, the algorithm does not allow an increase in release over the prior pass’s proposed release for any timestep after the first timestep in the release hydrograph. This string will show up in diagnostics, but not in the slot, since the slot contains only those reasons that apply to the first timestep of the forecast period. |
Key Control Point maximum flood control release | The Maximum Flood Control Release slot value (computed by a key control point) limited the release. |
Volume above key Control Point balance level | The volume intended to be released is that found to be above the balance level assigned by a key control point at the end of the balance period. This volume is reduced by each scheduled release in the forecast period, and the remaining amount limits subsequent scheduled releases. |
Volume in flood pool | The flood control release was limited by the total volume forecast to be in the flood pool at the time this reservoir is trying to make a release (this takes into account tandem storages and forecast flood control releases). |
Allowable falling release change | The release was limited by the first release in a stepped-down hydrograph that releases the remaining proposed flood pool volume over the rest of the forecast period with an Allowable Falling Release Change reduction at each timestep. This constraint is applied to each timestep in the forecast period. |
Allowable rising release change | The release was limited by the Allowable Rising Release Change added to the prior timestep’s release. |
Comparing to SUPER
It is recommended that the user test the model at each stage of development. For example, the surcharge release results should be verified before moving on to flood control. The following testing strategies explain how to compare RiverWare results with results from the SUPER model. However, a similar testing strategy may be devised to compare RiverWare with results from another model or historical data.
Set Storage Rules
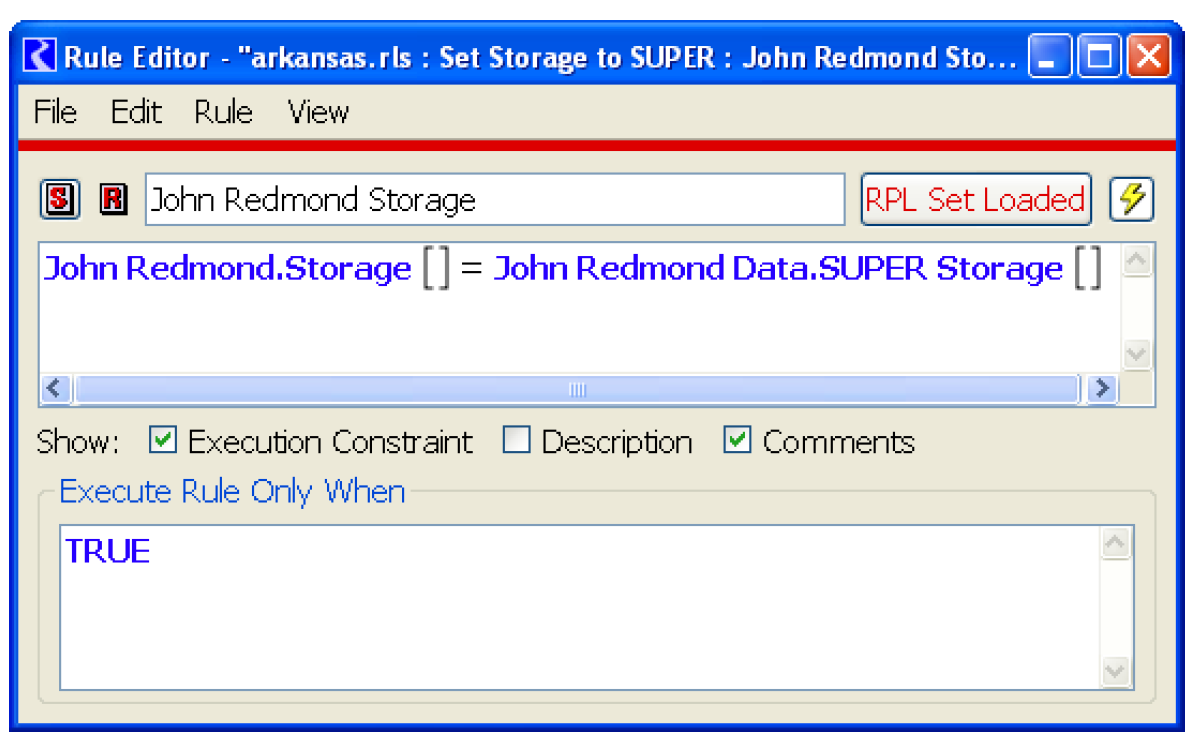
For testing purposes, it may be useful to create rules that set the storage slot on each reservoir to the final, known storage value taken from another model or from historical data. These rules can be used to incrementally test portions of the model. Since these rules need to overwrite the values computed by the surcharge release and flood control rules, they must be higher priority. Add a policy group above the flood control policy group and add a rule for each reservoir in the model. The rules should be ordered such that the upstream reservoirs execute first and the downstream reservoirs execute last (same order as the surcharge release rules). Each rule should set the reservoir storage slot equal to the final, known storage value (either taken from historical data or another model run). These values should be stored in a custom slot in RiverWare. Figure 6.4 shows a sample rule. These rules should be used for testing purposes only and would not be a part of the final flood control model.
When these storage rules are active, they will overwrite the results of the policy. Each rule will reset the reservoir storage to the known values (stored in a custom slot). This will trigger each reservoir to redispatch with the Solve given Inflow, Storage method. Each reservoir will compute a new outflow which will be routed downstream.
Figure 6.4
Testing Strategies
The set storage rules, discussed above, are required to accomplish this incremental testing. These rules allow the RiverWare model to be reset, at the end of each timestep, to a state equivalent to the SUPER model at that timestep. This ensures that the RiverWare model begins the next timestep in the same state as the SUPER model. As discussed above, the set storage rules should be the highest priority rules and will reset the reservoir storage to the SUPER storage value for that timestep. The SUPER storage values need to be obtained from a SUPER run that only has the desired calculations enabled. Store these values in RiverWare on custom slots.
Testing Surcharge Release
In order to test the surcharge release results, the surcharge release rules and set storage rules need to be active. The regulation discharge and flood control policy groups should be turned off. The goal of this testing is to compare the surcharge releases computed in RiverWare with the surcharge releases computed in SUPER. Both models should produce the same results, within some accepted tolerance. The set storage rules are necessary because, without them, the reservoirs in RiverWare will fill up to the top of the flood pool and stay there (because only the surcharge release rule would be active). The user may be wondering why the flood control rules couldn’t be used instead of the set storage rules. The reason is that it would defeat the purpose of incremental testing. If the RiverWare flood control results deviate from SUPER, then the models have deviated and it would be meaningless to compare surcharge release results.
When the RiverWare model is run with the surcharge release and set storage rules, the model will compute the surcharge releases at each timestep. Then the set storage rules will reset the reservoir storages to the known SUPER storage values. The final surcharge release values can then be compared to the final SUPER surcharge release values. If the values do not compare, debug the problem. When these values match up, proceed to the next level of testing.
Testing Regulation Discharge
To test the regulation discharge results, the surcharge release, regulation discharge, and set storage rules should be active. The regulation discharge and empty space results computed by RiverWare should compare with the SUPER results.
Testing Flood Control Results
Once the surcharge release and regulation discharge calculations have been verified, the flood control calculations can be tested. To test these, the surcharge release, regulation discharge, and flood control rules should be active. The set storage rules should not be active because they would overwrite the flood control results (although some types of specific testing may need to make use of the set storage rules).
Testing of Low-flow Releases, Reservoir Diversions, and Hydropower Releases
Follow a similar approach as described above to test these three policies. The user should make a determination on a case-by-case basis as to whether the set storage rules should be enabled.
Revised: 01/11/2023