
Time Series Data
This section includes details about displaying and manipulating values on series slots.
Topics
Timestep size
By default, the SCT uses the same timestep size as the model. Optionally, you can configure the SCT to use any timestep size supported in RiverWare. Each SCT can display only one timestep size for all series slot sheets; however, you can create and view multiple SCTs that show different timestep sizes. When an SCT is shown for a different timestep than the model, the timestep size is added to the title bar of the SCT.
Related topics
Time range
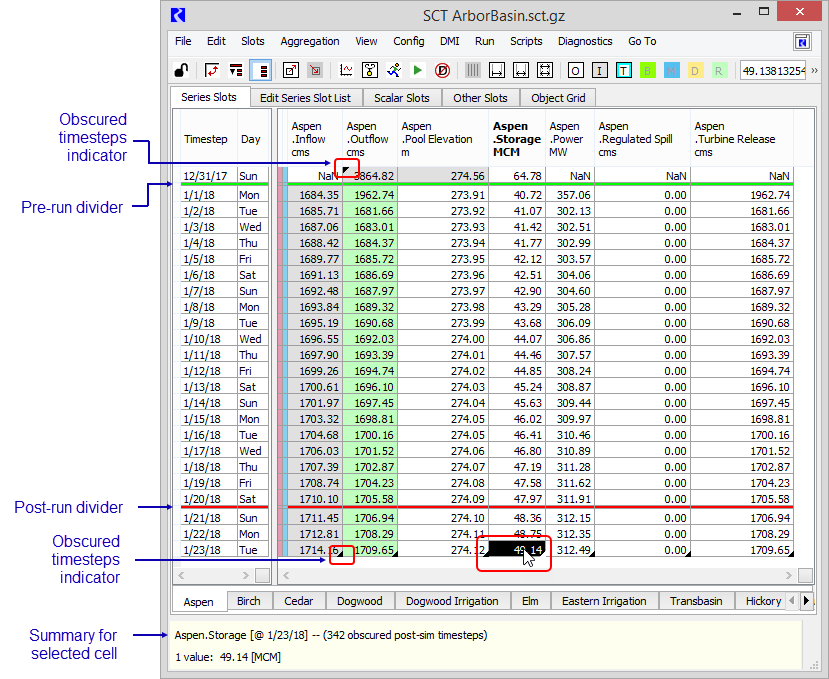
By default, the SCT uses the same time range as the model run control. Optionally, you can add pre-simulation and post-simulation timesteps to the SCT.
When data at pre-simulation or post simulation timesteps are obscured, a small corner triangle is displayed in the first or last cell in that slot. If you select the detail cell, the number of obscured timesteps is displayed in the SCT Status area. To display obscured timesteps for a slot, extend the time range of the SCT for pre or post-simulation timesteps to cover the full time range of the slot. SCT cells that correspond to a timestep that is out of the defined range for a slot display as shaded / inactive. Figure 2.8 illustrates.
Figure 2.8 Time range indicators
Related topics
Timestep orientation
The Series Slots tab offers two timestep orientations, and you can easily switch between them.
• In vertical timestep orientation, timesteps run down the page, from top to bottom, and each slot is a separate column.
• In horizontal timestep orientation, timesteps run across the page, from left to right, and each slot is a separate row.
One orientation may be preferable to the other, depending on the tasks you are performing and the number of slots and timesteps included in the SCT. You can display either orientation in aggregated or non-aggregated view.
Vertical timestep orientation
In this orientation, timesteps are displayed vertically, running from top to bottom. Column headers are slot names, and row headers are one of the following:
• Timesteps
• Timestep aggregate summaries
• Custom summary rows
This orientation provides a view similar to the Slot Viewer and Slot Editor. Long slot names can get obscured because of limited column width.
Each summary row corresponds to one timestep aggregation. The details rows represent the individual timesteps within each aggregation interval. Details for a single summary row correspond to one timestep aggregation across all slots.
Horizontal timestep orientation
In this orientation, timesteps are displayed across the page, running from left to right. Row headers are slot names, and column headers are one of the following:
• Timesteps
• Timestep aggregate summaries
Each summary row corresponds to a slot. Therefore, showing or hiding the details for a summary row displays or hides the details for that slot.
Related Topics
Editing Slot Values
The SCT is a window into the model that not only displays the model data, but allows you to edit slot values directly. Following are general guidelines for editing slot values through the SCT. See Manipulating Slot Values for details.
• You do not need to unlock the SCT. The SCT lock mechanism only locks the SCT configuration, not the data values. See SCT Configuration for details.
• All values are stored in the model itself; you must save the model to preserve the new values.
• Enter values manually using the following approaches.
– Enter numbers directly in one or more selected cells. When multiple cells are selected, the entered value is applied to all of them.
– Copy and paste values from one or more cells in the SCT to other cells in the SCT.
– Import Paste data that was copied to the Windows system clipboard from external applications.
– Use utilities to Adjust Values or Interpolate over a time range, as in other slot editing dialogs.
• Export Copy data out of RiverWare to the Windows system clipboard, making the data available for pasting to external applications.
• All timestep values are assigned a flag. Display this flag as a cell background color, a flag letter, or both.
• Clear values and flags to get rid of unwanted data.
• Set or change flags using menu options, toolbar buttons, or right-click context menus.
• You cannot edit certain types of slots, including expression slots and certain accounting system slots. Values for these slots are read only, which is indicated by crosshatching in a user-defined Read-only color.
• Undo and Redo of data edits using the Edit menu or Ctrl+Z and Ctrl+Shift+Z keyboard shortcuts.
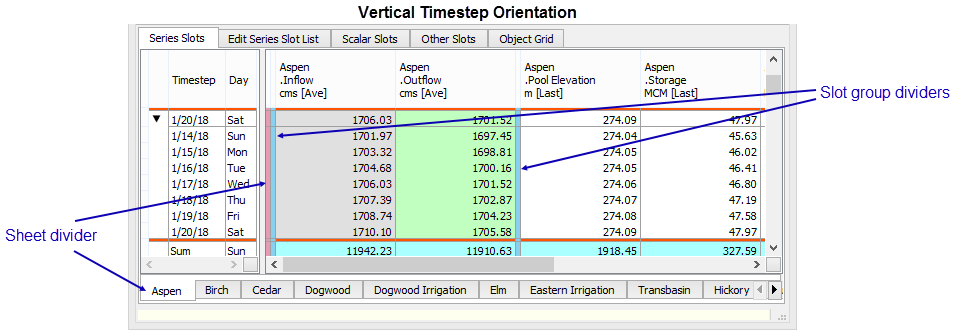
Sheet dividers and slot dividers
You can use slot dividers and sheet dividers to organize the Series Slot display to meet your needs. Slot group dividers identify the start of a logical grouping of slots on a sheet. Sheet dividers identify the start of a new series slot sheet; each sheet appears as a tab at the bottom of the series slot display.
By default, slot dividers are blue, and sheet dividers are pink. You can optionally define a custom color for each.
In the vertical timestep orientation, dividers display as columns, and they are drawn as thick lines. In this orientation, you cannot enter text in the slot divider.
In the horizontal timestep orientation, dividers display as rows that are tall enough for a line of text. In this orientation, you can enter text in the Slot Label field of the slot divider.
Figure 2.9 Sheet and slot group dividers in horizontal timestep orientation
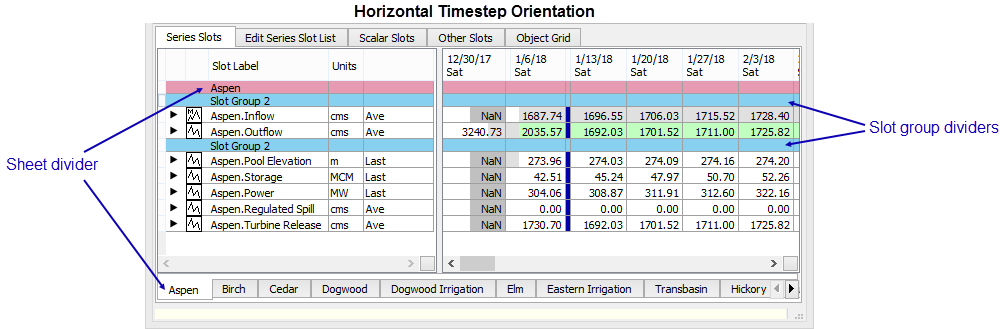
Figure 2.10 Sheet and slot dividers in vertical timestep orientation
Related topics
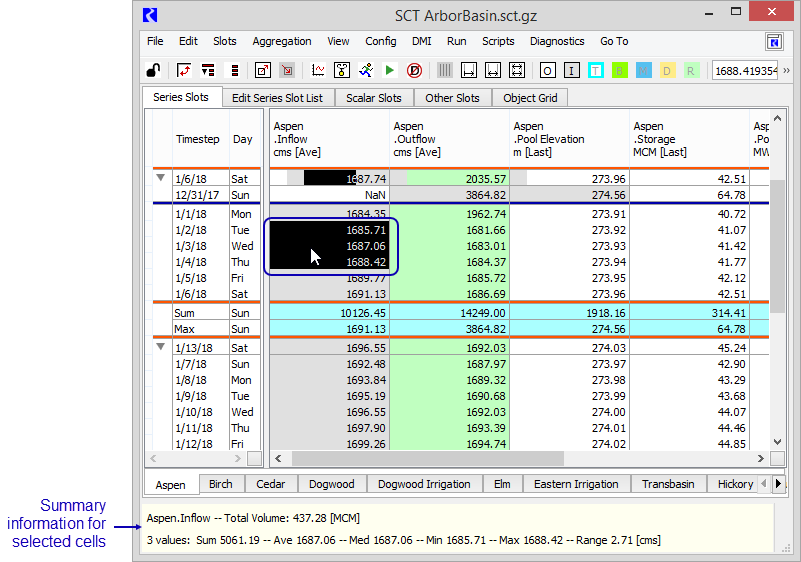
Summary statistics
The Status Area at the bottom of the Series Slots tab displays summary information on selected cells. This includes the name or number of the slots selected and summary statistics. Statistics include Sum, Average, Median, Min, Max, Range, and Difference. All, some, or none of these values may be shown depending on the number of cells selected and the units of the cells.
Aggregation
For display and some data export purposes, you can aggregate timesteps within each series slot according to user-selected summary functions. Timestep data is aggregated into an aggregation interval size larger than the timestep interval size. You can aggregate a fixed number of timesteps per summary (for example, aggregate three timesteps per summary), or you can aggregate timesteps into a regular interval (for example, aggregate one-hour timesteps into daily summaries). See Timestep size for details.
Aggregated and non-aggregated views
You can choose to display series data with aggregations enabled or disabled.
The No Aggregation view displays timestep detail only, and summaries are not available. Figure 2.11 illustrates.
Figure 2.11 No Aggregation view
The Hide All Details view displays summary values only, and details are not available. Figure 2.12 illustrates.
Figure 2.12 Hide All Details view
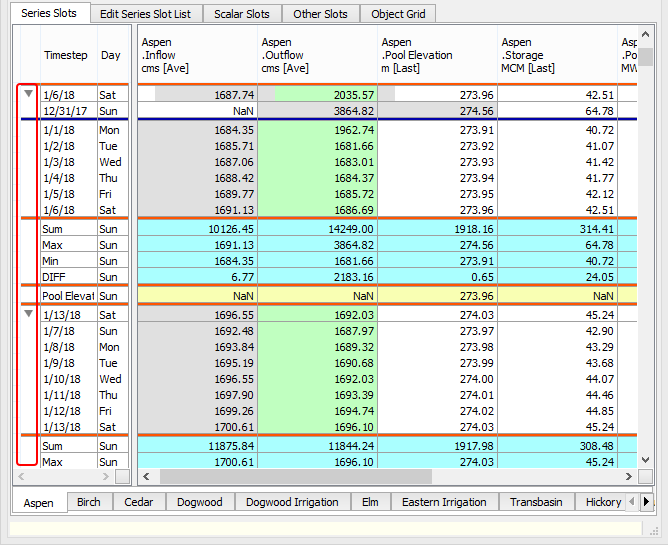
The Show All Details view displays all summary and detail values. Figure 2.13 illustrates.
Figure 2.13 Show All Details view
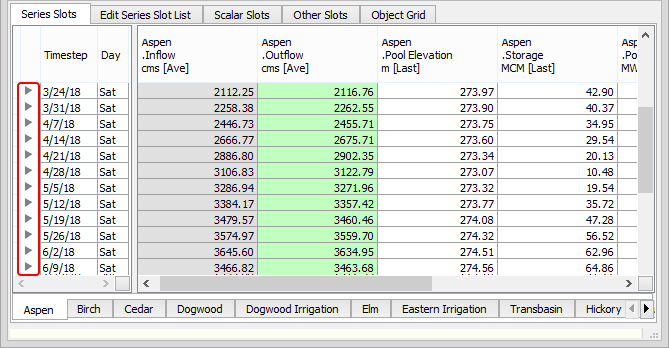
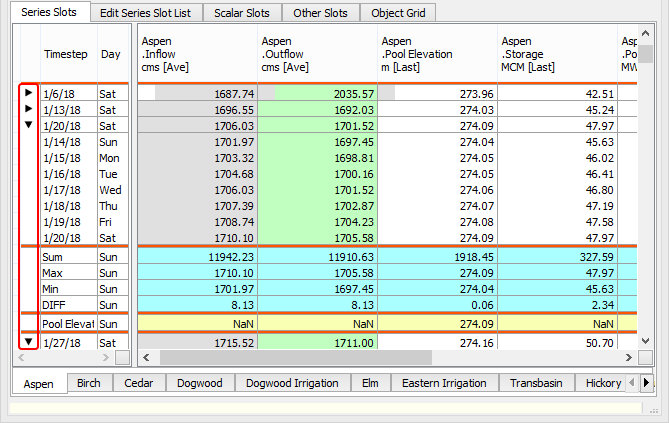
The Show/Hide Details view displays summary and detail values in a dynamic expand/collapse format. Figure 2.14 illustrates.
Figure 2.14 Show/Hide Details view
To customize the display according to your needs, you can assign summary functions in any combination of the following ways:
• Globally by unit type. For example all slots with the flow type could use average, and all slots with the area type could use maximum.
• Globally by slot name. For example, all Input slots could use average, and all Spill slots could use maximum.
• Individually by slot. For example, most Input slots could use average, but the Input slot in Aspen reservoir could use minimum and the Input slot in Birch reservoir could use maximum.
Related topics
Custom summary rows
For aggregated, vertical timestep view, you can specify any number of custom summary rows at the end of each time aggregation. Each custom summary row can be configured to display the value of a simple arithmetic function or the value of a referenced series or scalar slot. Optionally, you can assign a user-defined background color to each custom summary row.
Custom summary row values are automatically updated whenever any detail values are changed. Custom summary row values for simple functions are read only, but the read-only crosshatch is not displayed.
In the case of referenced slots, summary values are displayed only for aggregated slots with the same unit type as the referenced slot. Also, you can designate whether referenced slot values can be edited directly from the summary cell.
Figure 2.15 Sample custom summary rows definition
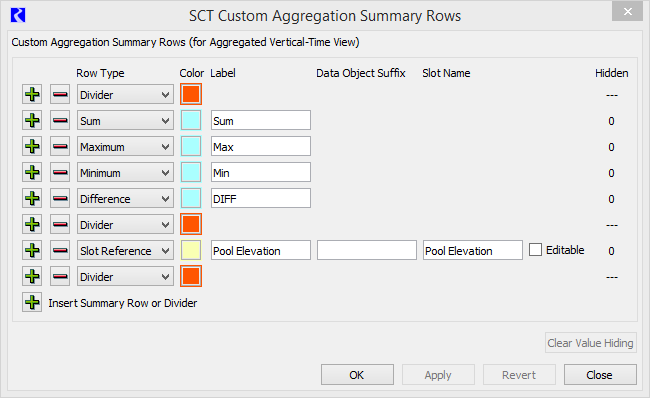
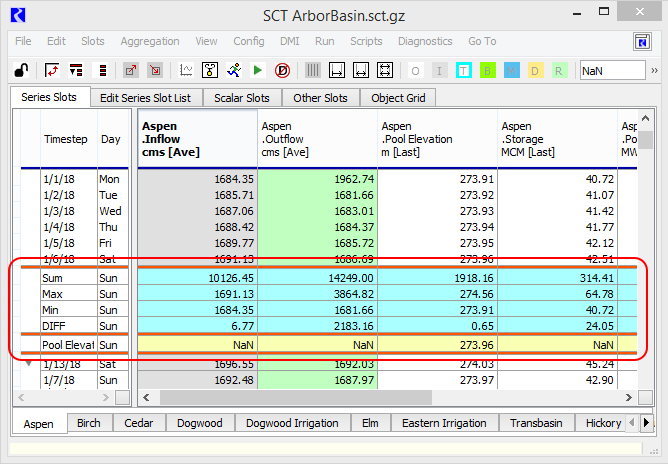
Figure 2.16 Sample custom summary rows display
Related topics
Display units
Numeric time series slot values are stored internally as double-precision floating point numbers. Cell values are displayed in the SCT, as with the rest of the RiverWare user interface, in a user-defined display precision. Display precision specifies the number of fractional decimal digits to which the internal value is rounded. The SCT uses the display precision for each slot as defined in the active unit scheme; see Unit Schemes in User Interface for details.
When you select a single cell, the value is also displayed with model precision in the Value field in the SCT toolbar.
Note: Model precision is not necessarily the full precision of the internal value which is represented in internal units.
If the Display “NaN” setting is enabled in the SCT configuration, the SCT displays all undefined values as “NaN” (Not a Number). If this setting is disabled, undefined values are displayed as blanks.
If the global Show Commas in Numbers setting is enabled on the workspace, the SCT uses the comma as the thousands separator for all cell values. If this setting is disabled, the SCT does not display a thousands separator.
Related topics
Flags and priorities
The SCT provides options for displaying slot value flags and rule priority numbers. Priority numbers are relevant when using rulebased simulation. See Flags on the Timestep I/O Menu in User Interface for details about flags on series slots. See Slot Priorities and Flags in Solution Approaches for details about slot value priorities.
Flags and cell colors
By default, each series slot cell is displayed with a background color that indicates the value flag, such as Input (I), Output (O), Rules (R), and so on. The background color provides a visual cue to help you interpret series slot data. Optionally, you can also choose to display the one-letter flag indicator.
Each value type flag has a default color. Optionally, you can define custom colors for any or all of the flags.
Optionally, you can configure whether flag colors are displayed when aggregated view is enabled.
Flag letters and priority numbers
Optionally display the flag letter for each slot value. This is useful if custom highlighting or threshold alerts have overridden the flag colors. In addition, if you are using rulebased simulation, you can optionally display the priority number for each slot value. See Display flag letters and priority numbers for details.
Tooltips
When you hover over an area on the SCT, a context-sensitive tooltip is displayed.
The tooltip for a slot name or label displays the full slot name and any description defined on that slot.
The tooltip for a cell value indicates which rule or Data Management Interface (DMI) was responsible for the value, where applicable.
Related topics
Custom slot labels
RiverWare slots are identified with a fully qualified name, which includes the name of the simulation object, account, or other entity the slot is on. SCT slots for which a match cannot be found on the workspace are indicated as disabled—no data is shown, and you cannot provide data for such slots.
Slot names
RiverWare uses slot names to refer to a particular slot. Generally, the slot name includes the simulation object or account that the slot is on. You cannot change a slot name from the SCT.
Slot labels
Slot labels are text strings that you can use to label a slot within a particular SCT. Slot labels are always displayed in the SCT as either row or column headers.
Each slot can have two separate slot labels, as follows:
• A single-line text string for use in the horizontal timestep orientation
• A multiple-line text string for use in the vertical timestep orientation
The slot label is also displayed in the SCT Status area when a single slot is selected.
Related topics
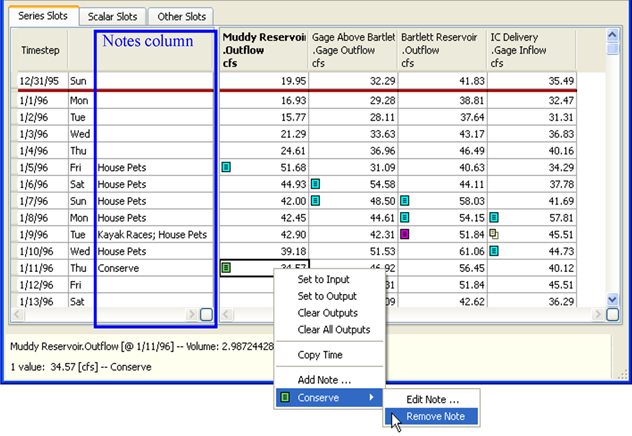
Notes on series slots
The SCT displays timestep annotations on the Series Slots tab.See Notes on Series Slots in User Interface for more information on Series Slot Notes.
If a single SCT cell is selected, the note text associated with that cell is displayed in the SCT selection status bar, at the bottom of the SCT. As with the series data values displayed in the SCT, series slot notes are saved with the slots themselves, not with the SCT configuration.
When the SCT is in the non-aggregated vertical timestep orientation, the text for all notes in each timestep row are displayed in a row header column, depending on whether the Show Column: Notes setting is enabled. See Vert Time tab for details.
Related topics
Revised: 01/11/2023