
Output
This section describes changes to Output Devices and other output tools.
Plotting
The following sections describe changes to plotting including allow slot values in plot markers and using RPL functions in Y-axis bounds.
Plot Markers reference Slot Values
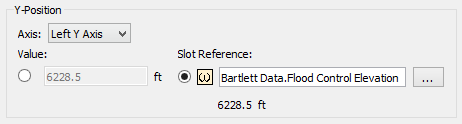
Plotting has been enhanced to provide a new option for associating a plot marker with a slot, for both X and Y-axis marker configurations to provide dynamic marker placement. Figure 6.2 shows the configuration. For more information, see Marker Configuration in Output Utilities and Data Visualization
Figure 6.2 Screenshot of the Marker configuration showing a reference to a slot value
Y Axis can reference RPL functions
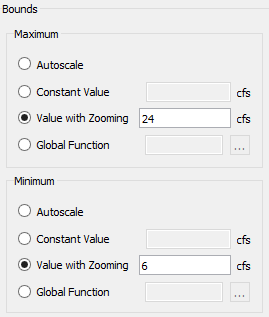
Plotting has been enhanced to provide new options for configuring the bounds of numeric axes on plots. Now the plot configuration allows the minimum and/or maximum bound, particularly on the Y axis to refer to a global RPL function, static value, value with zooming or to be autoscaled. Figure 6.3 shows the configuration.
Figure 6.3 Screenshot of the numeric axis Bounds configuration
See Axis bound configuration in Output Utilities and Data Visualization for more information.
RDF Viewer
See RDF Viewer for more information on the new RDF Viewer to look at the RDF results of MRM runs.
Tabular Series Slot Reports
Within the Tabular Series Slot Report output device, the following enhancements were made:
• When showing series notes as footnotes, you can now select which note groups to include in the report. This allows you to create Note groups that are included in the report, maybe for public release, and other groups that are not included, perhaps for internal usage only.
• You can now select to display NaN values as 0.0 in the report.
Both options can be set up on the Settings tab of the report configuration dialog. See Settings Tab in Output Utilities and Data Visualization for more information.
Revised: 01/11/2023