
Instructions for Creating a Flow Line Diagram
1. Create a new Output Canvas. See Step 1. and Step 2. in Instructions for Creating a Teacup Diagram for instructions.
Note: You can add flow lines to an existing canvas that also shows teacups, object icons, or other items.
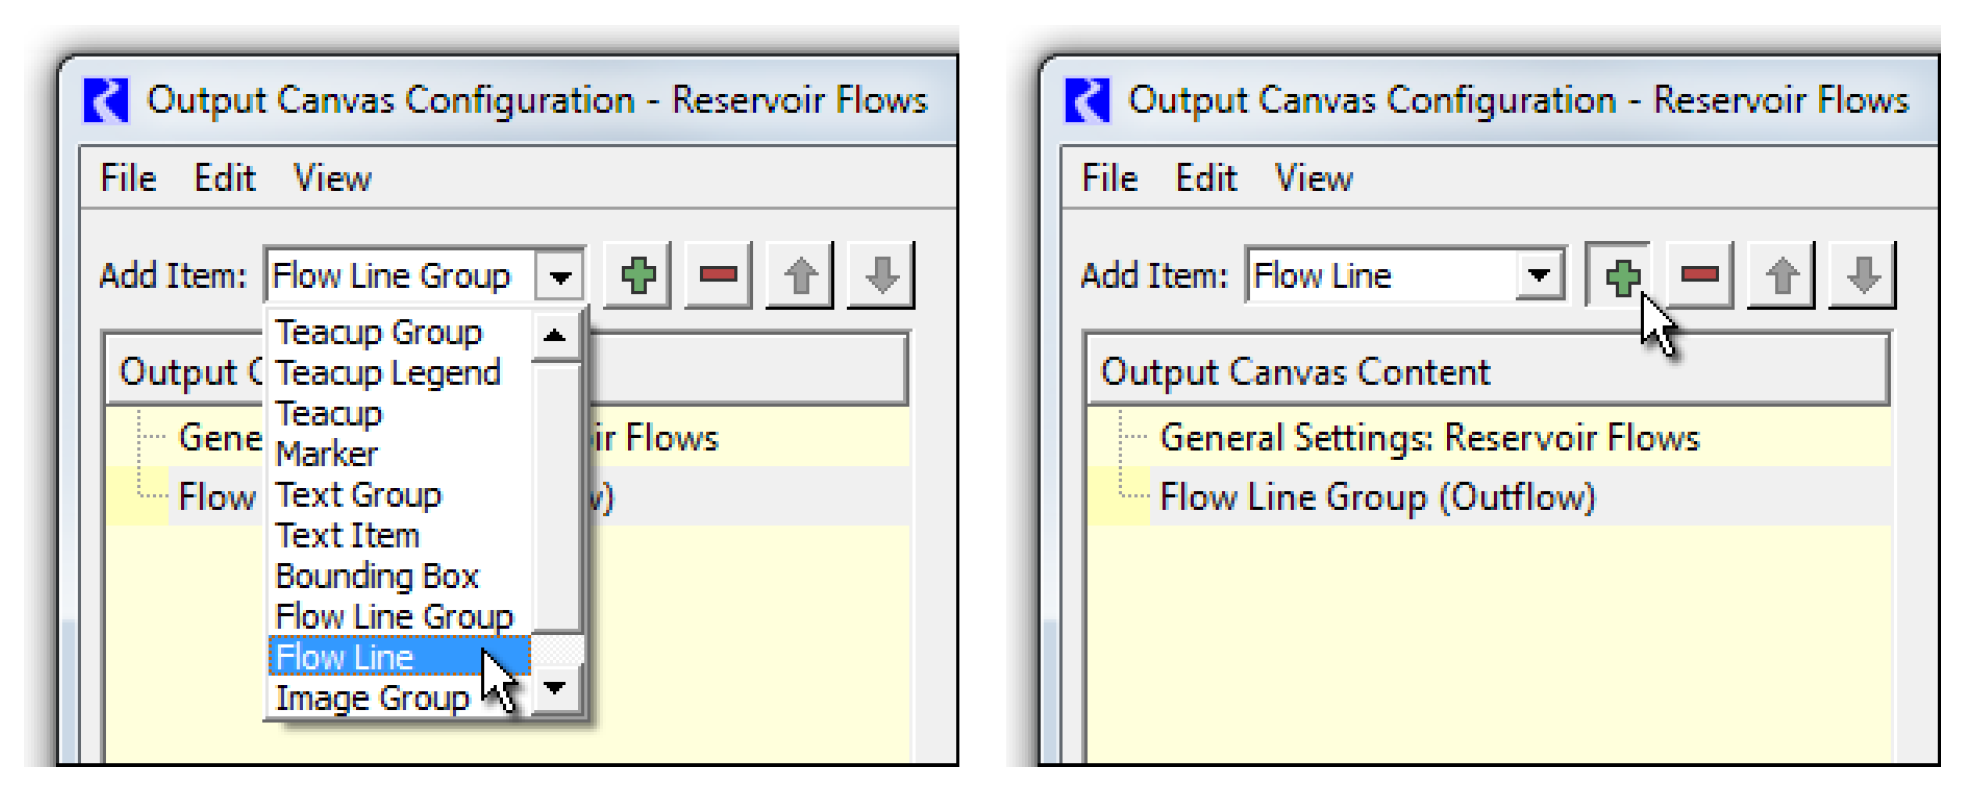
2. With the Flow Line Group item selected, select Plus (+).
3. The slots associated with the flow lines within a flow line group must have the same unit type. Double-click the Unit Type value to show a unit type menu. Select the desired unit type; generally Flow will be appropriate (the default).
4. With the context menu on a Flow Line Group tree item: Add Item, then Flow Line.
5. Using the selector, select the slots representing the flow lines. Multiple slots can be selected at once and a flow line item will be created for each. They will place on the canvas at a heuristically devised location based on their location within the simulation view.
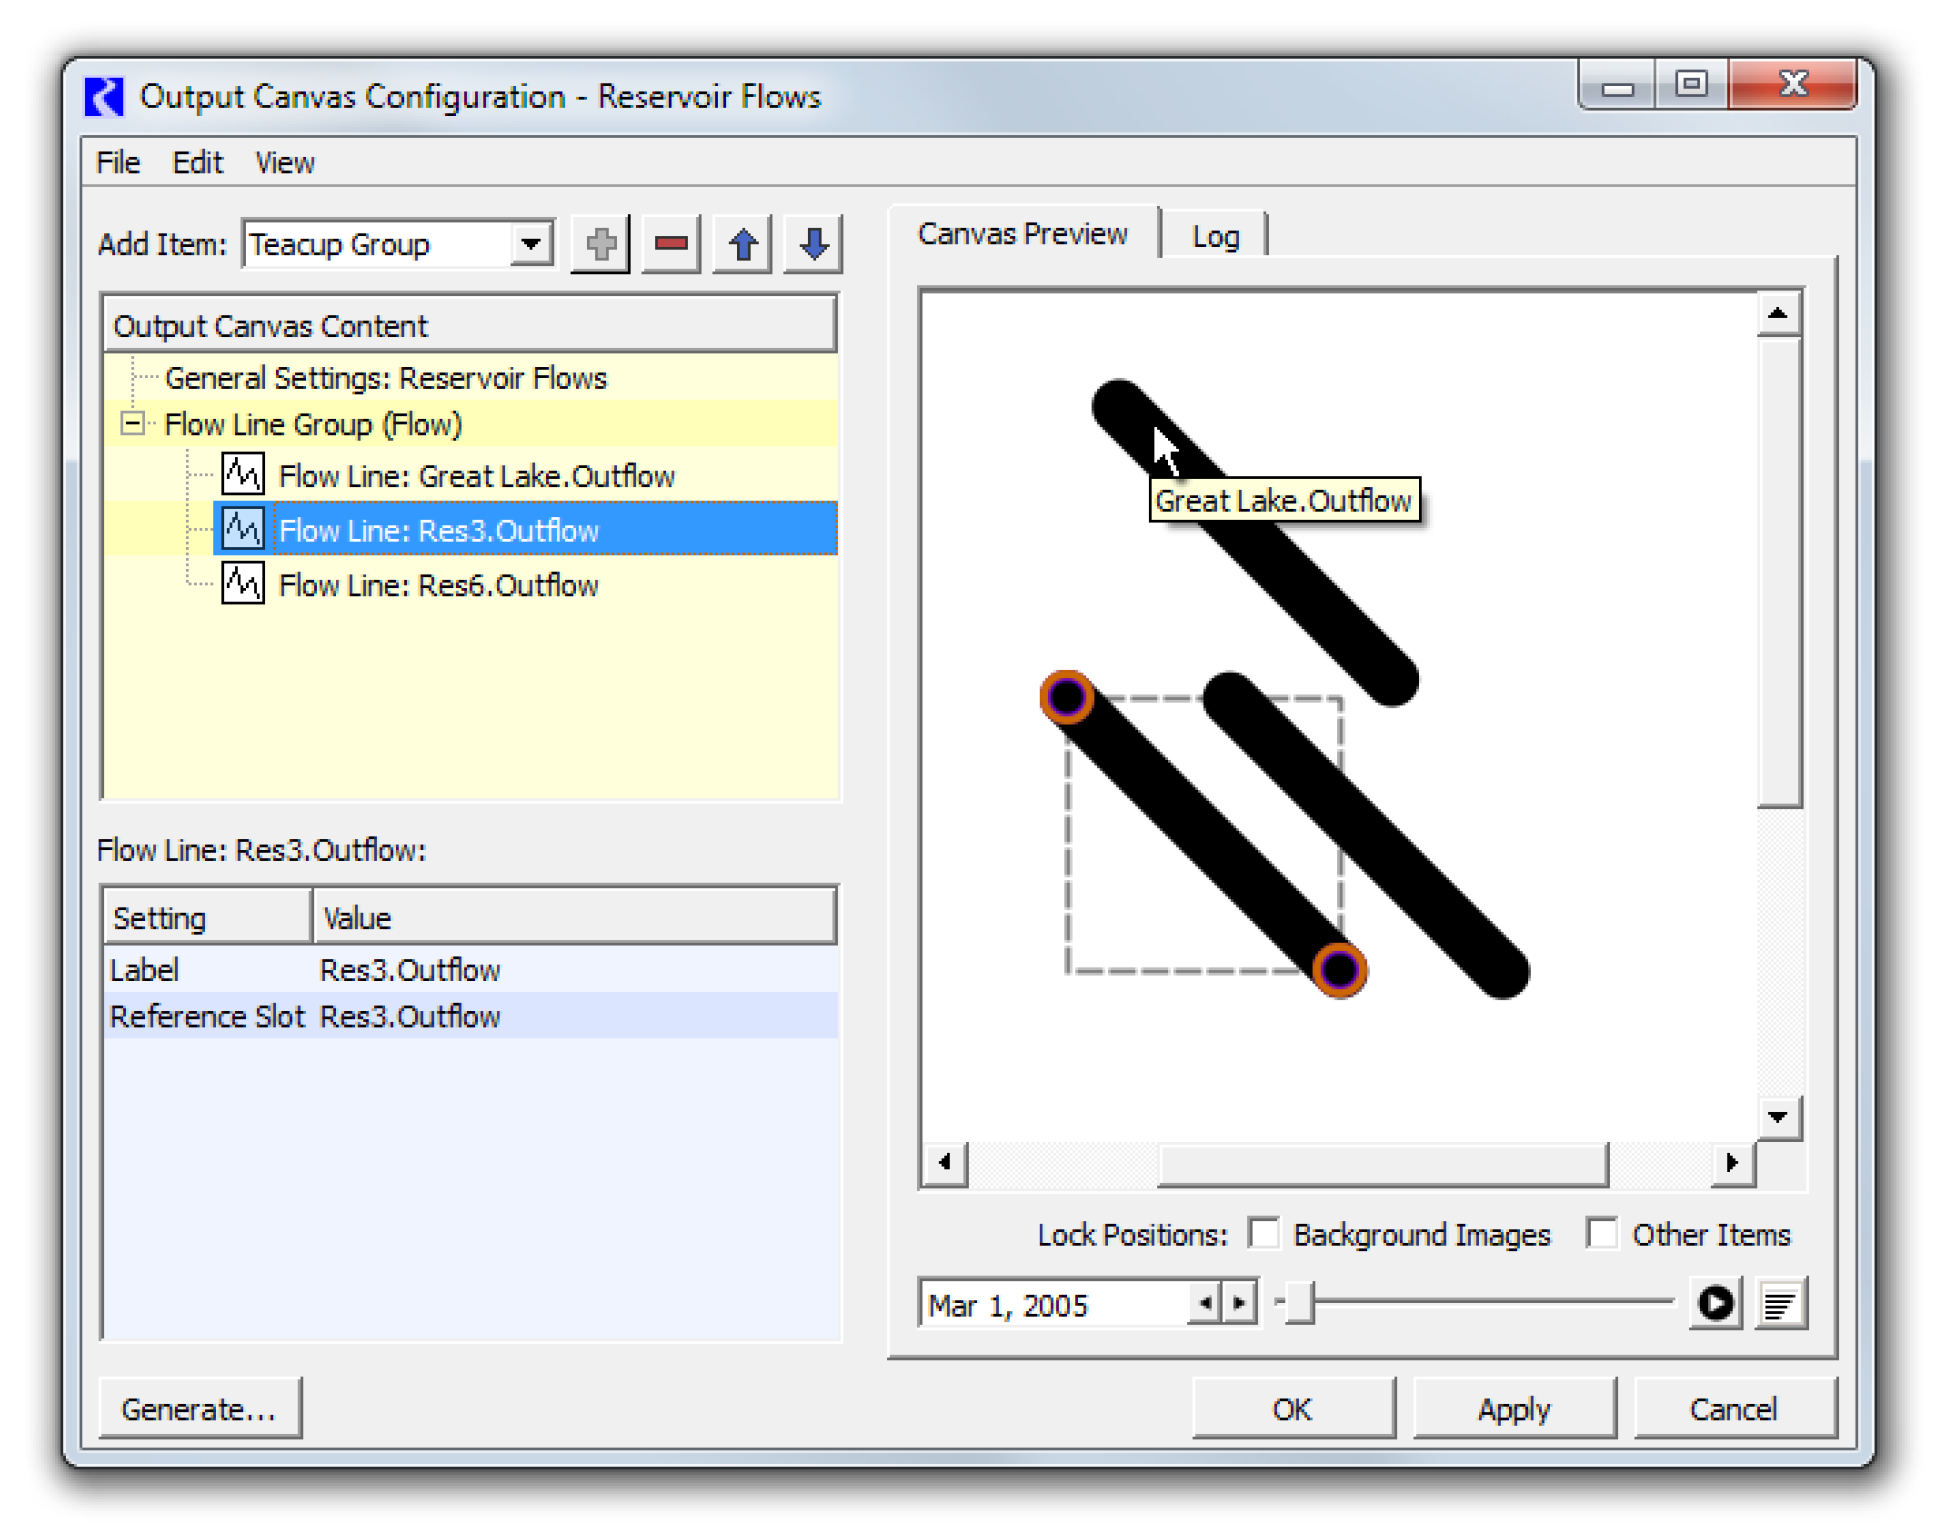
6. Select a flow line either in the Output Canvas Content tree or within the canvas preview to see the flow line's anchor points. The flow line may be repositioned by dragging the anchor points or the flow line itself. Additional flow line points can be created, and existing points can be deleted, with right-click context menu operations on the flow line and flow line anchor points.
7. Select the Flow Line Group in the Content panel. In the settings panel, define the Minimum and Maximum Thickness and Minimum and Maximum Value.
9. Select each Flow Line in the group and provide a value for each Threshold. Remember Threshold 1 is the lowest flow. Threshold 8 is the highest flow.
10. Optionally, add a Flow Line Legend to provide a key to the intervals and line thicknesses. See Flow Line Legend for details.
11. Optionally add an Image (like a map) as a background or as supporting images.
12. Optionally add Object Icons and/or Teacups to provide context for your flow lines. Creating Object Icon Groups and then adding icons to it is analogous to creating Teacup Groups and adding teacups to it, but there is less configuration involved as Object Icons don’t change over the run. This is described in the steps above.
13. Reposition any item as desired.
14. Add Text groups and text to annotate or label your flow lines, provide the timestep, and a title to your canvas. See Step 18. and Step 19. in Instructions for Creating a Teacup Diagram for instructions.
15. Select OK to save the canvas and then generate the device from the Output Manager. Use the animation controls to watch the flow lines change through time. Figure 6.30 and Figure 6.31 show completed sample flow line diagrams.
Figure 6.30
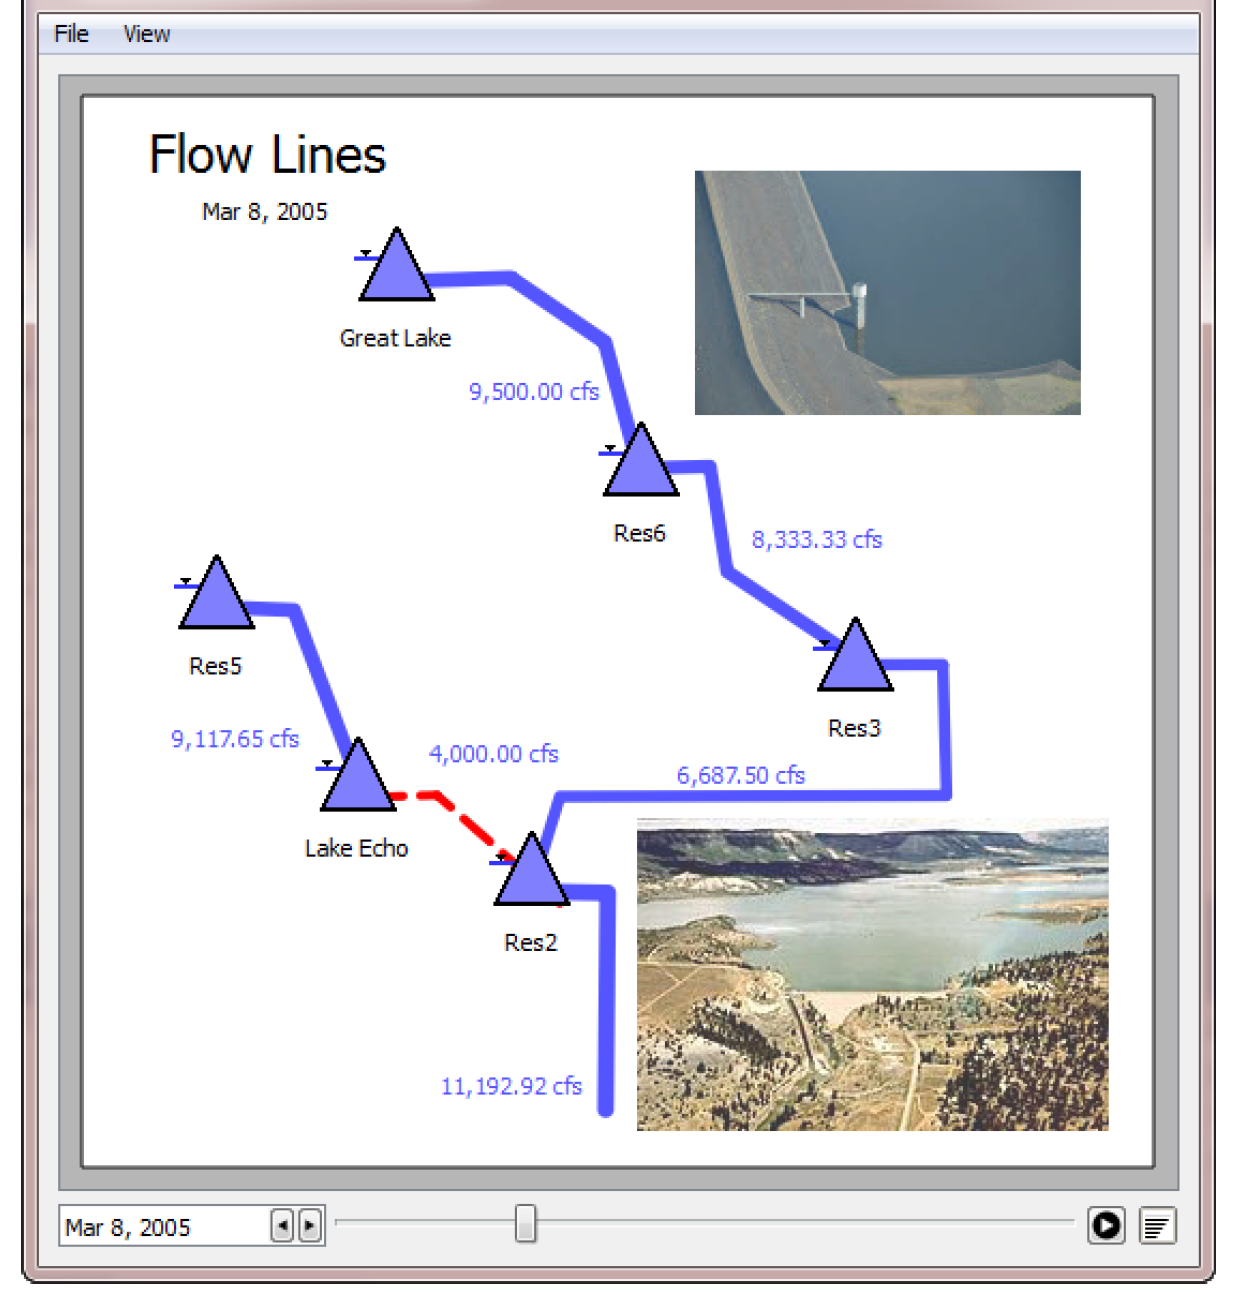
Figure 6.31

Revised: 01/11/2023