
About Teacups and Flow Lines
Create Teacups to show the value (often storage) against some full value for that object (full reservoir). Show multiple teacups in a group to display the relative fullness of many different items. Teacups can be rectangles or trapezoids. See Figure 6.1.
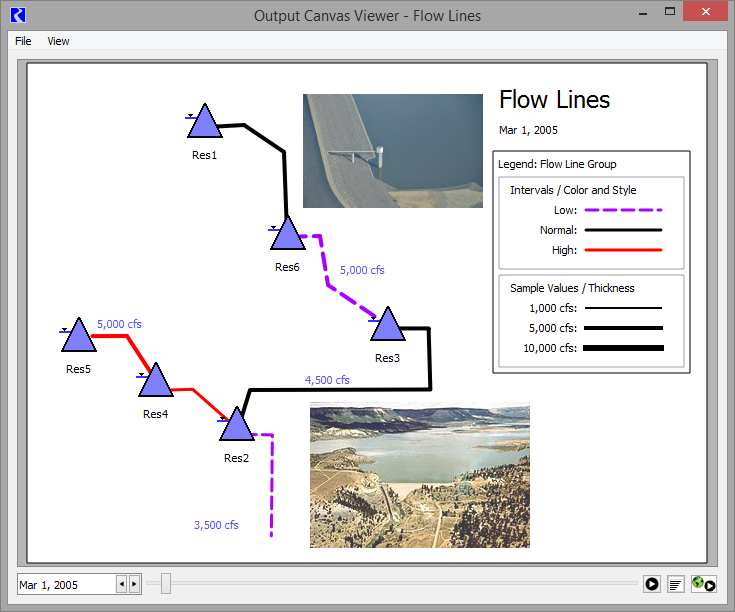
Also, create Flow Lines, which often represent the flow of water in a river network. Configure the flow lines to change thickness based on the flow compared to other values in a group, and change color and line type as the flow crosses thresholds defined for each particular flow line or on each object. See Figure 6.2.
Figure 6.1 Output Canvas showing Teacups and a Chart
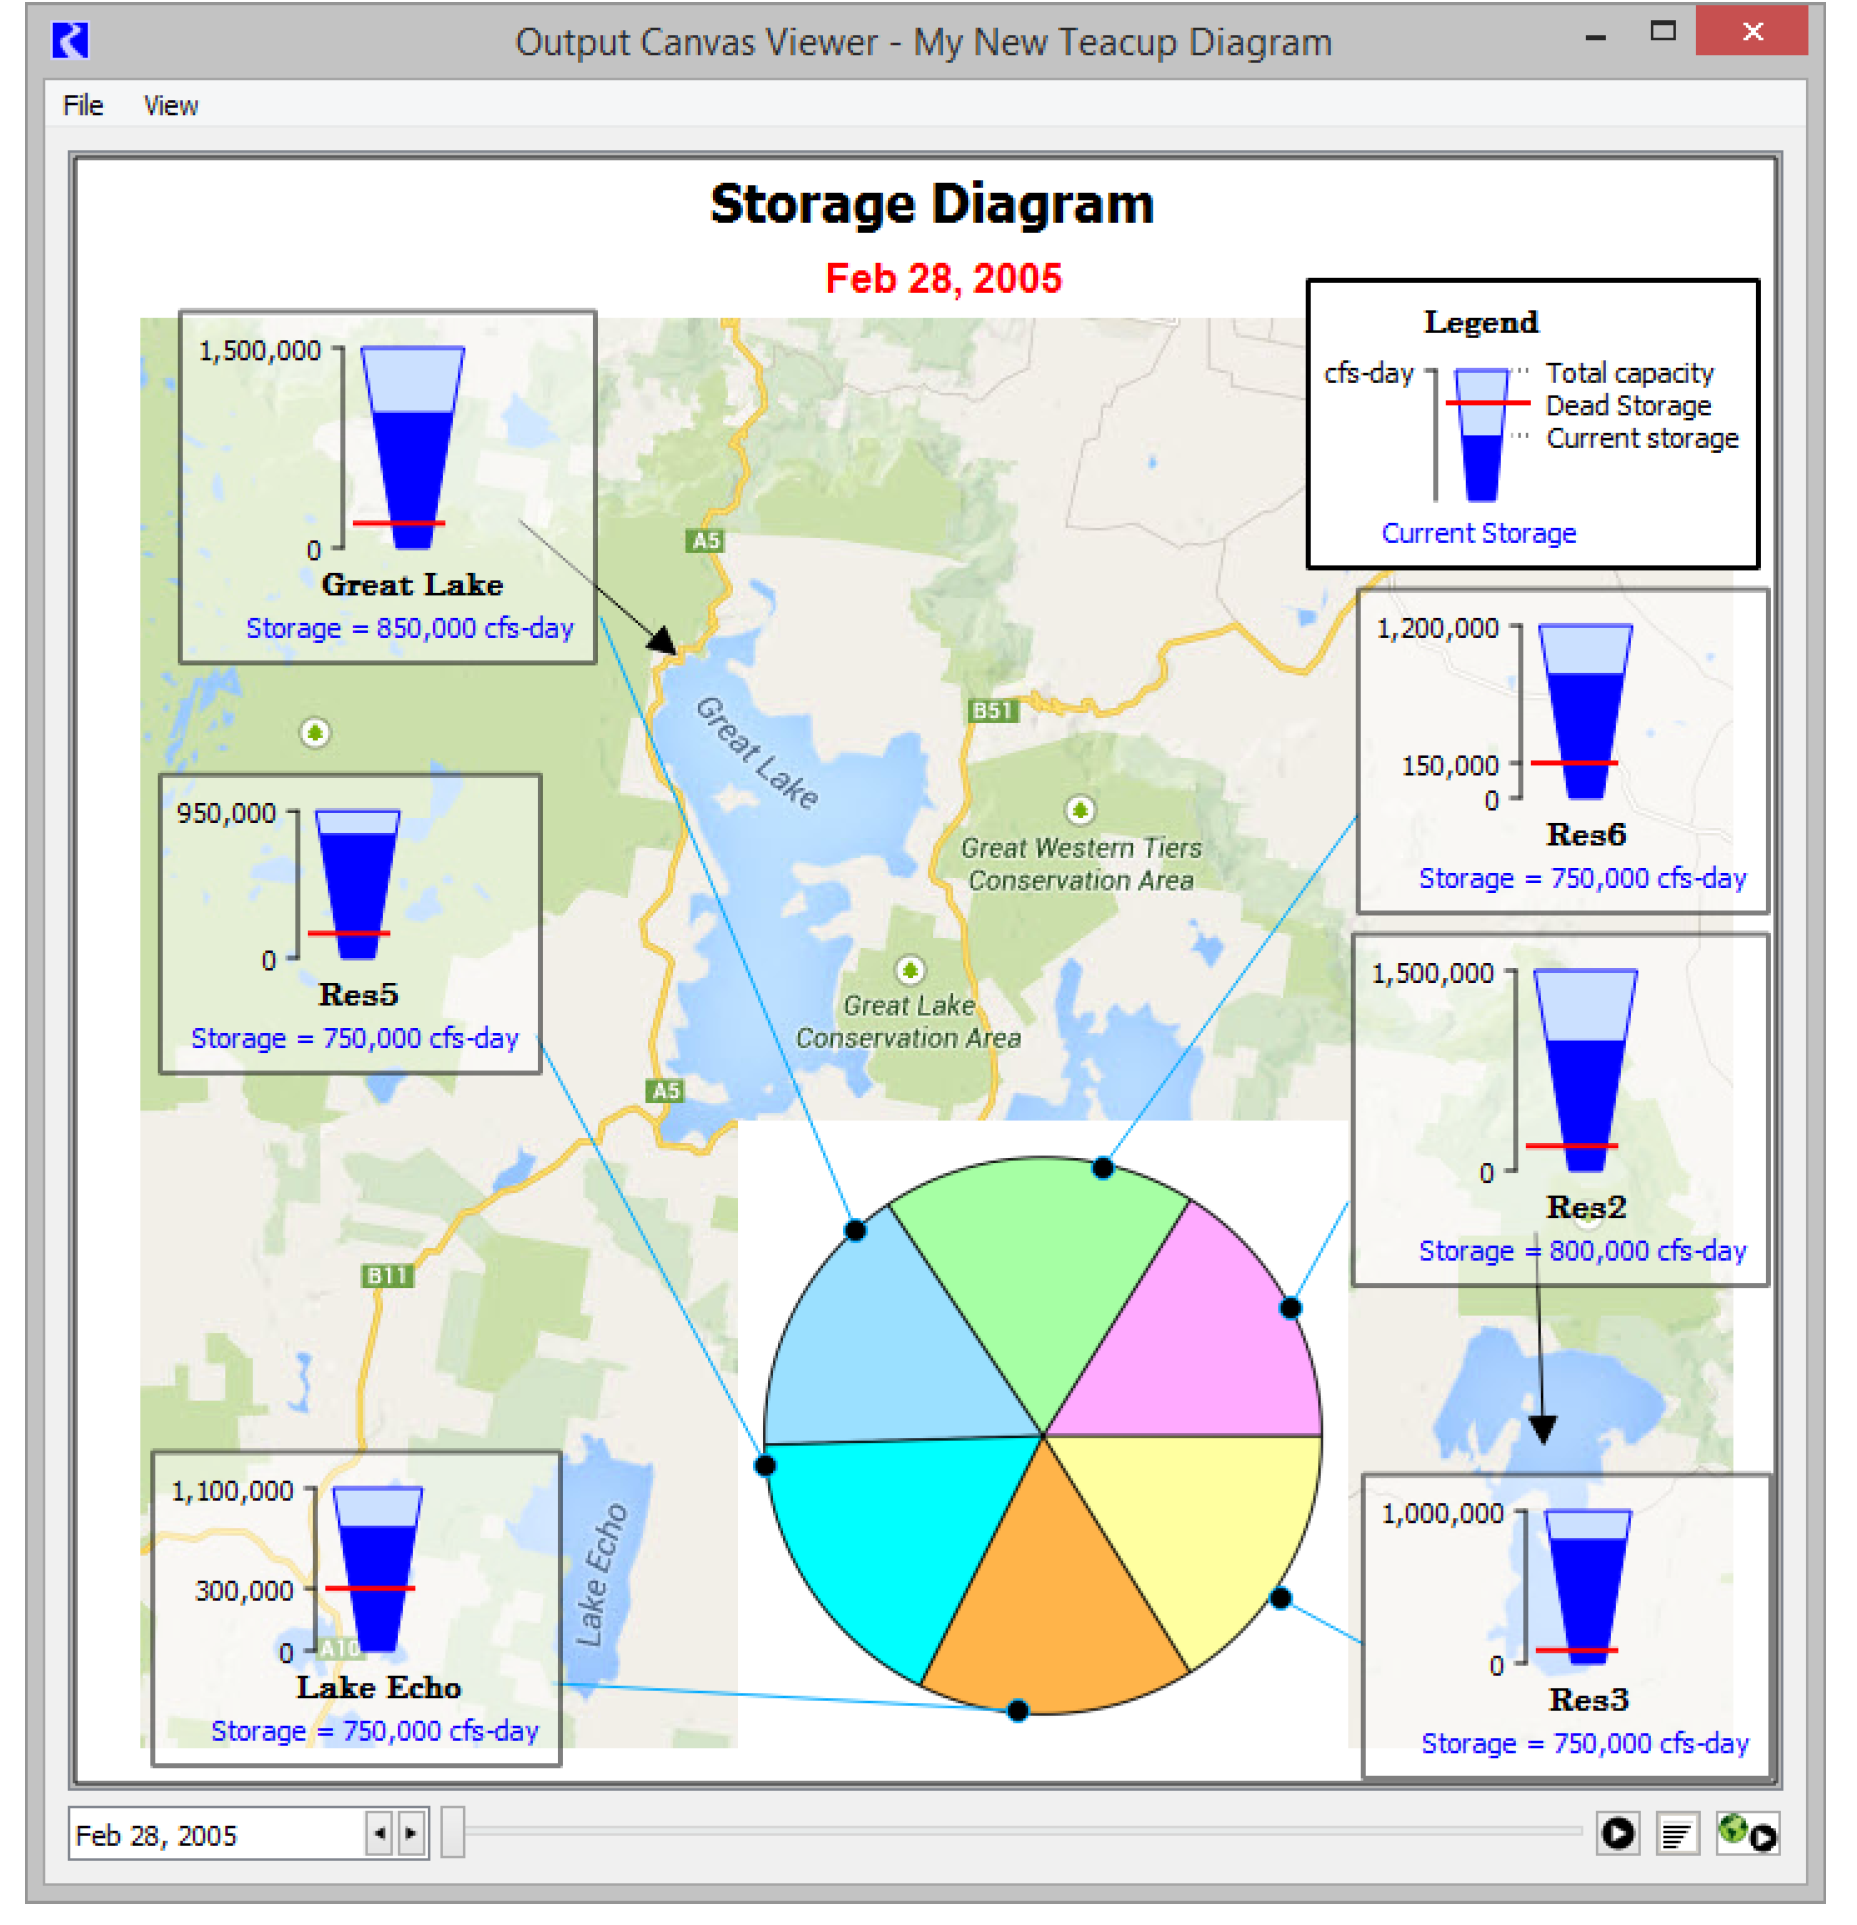
Figure 6.2 Output Canvas showing flow lines and Object Icons
Revised: 01/11/2023