
Bisection Method Example
The following example describes how the bisection method is implemented in the function getMaxOutflowGivenInflow. The mass balance functions and getMinSpillGivenInflowRelease use the identical procedure
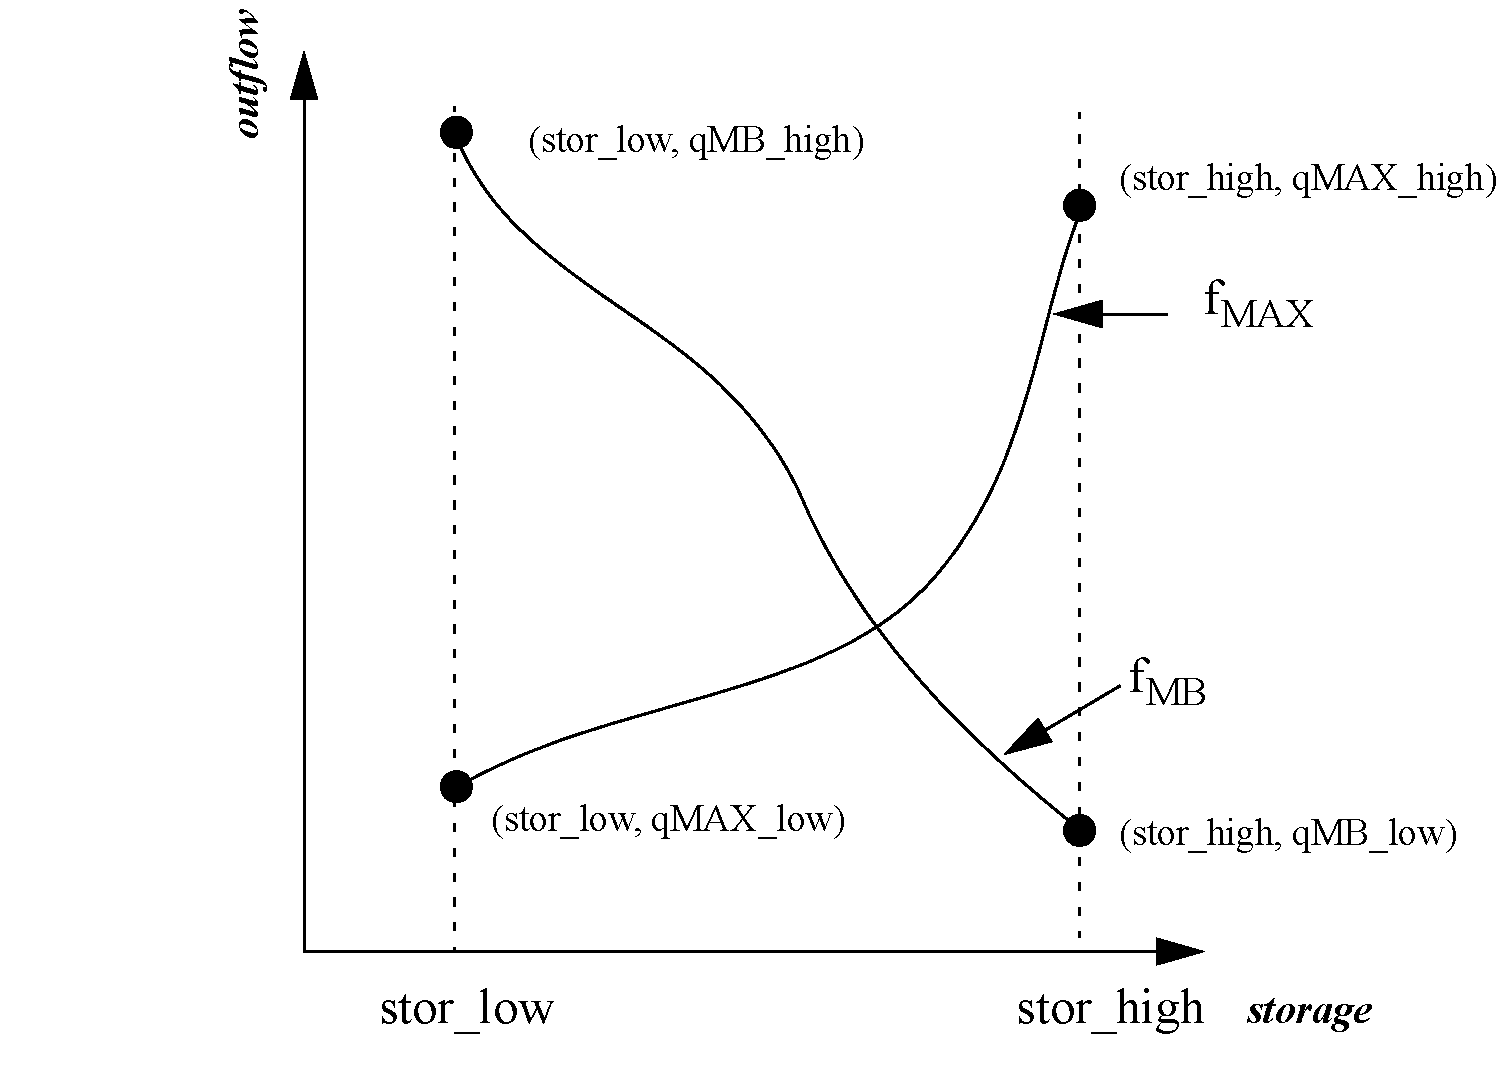
Given the total inflow over the timestep, getMaxOutflowGivenInflow returns the maximum outflow. This function is either called by a rule or executed as a result of a max capacity flag being set on an outflow slot. The maximum outflow is a combination of the maximum release (turbine release if the object is a Level Power Reservoir or a Slope Power Reservoir), the maximum regulated and unregulated spill, and the maximum bypass. In the event that the first iterative routine fails, the bisection routine is started with six final values that were determined during the final two iterations of the first routine. These six values can be combined to form four pairs of Cartesian coordinates where storage is on the x-axis and outflow is on the y-axis.
For the purpose of this example, these values are denoted as follows:
• stor_high = the largest storage value returned from the mass balance function
• stor_low = the smallest storage value returned from the mass balance function
• qMB_high = the outflow corresponding to stor_high determined by mass balance
• qMB_low = the outflow corresponding to stor_low determined by mass balance
• qMAX_high = the outflow corresponding to stor_high determined by the max outflow function
• qMAX_low = the outflow corresponding to stor_low determined by the max outflow function
Figure A.1 depicts these coordinates graphically. The functions fMB and fMAX denote the mass balance and the max outflow functions, respectively.
Figure A.1
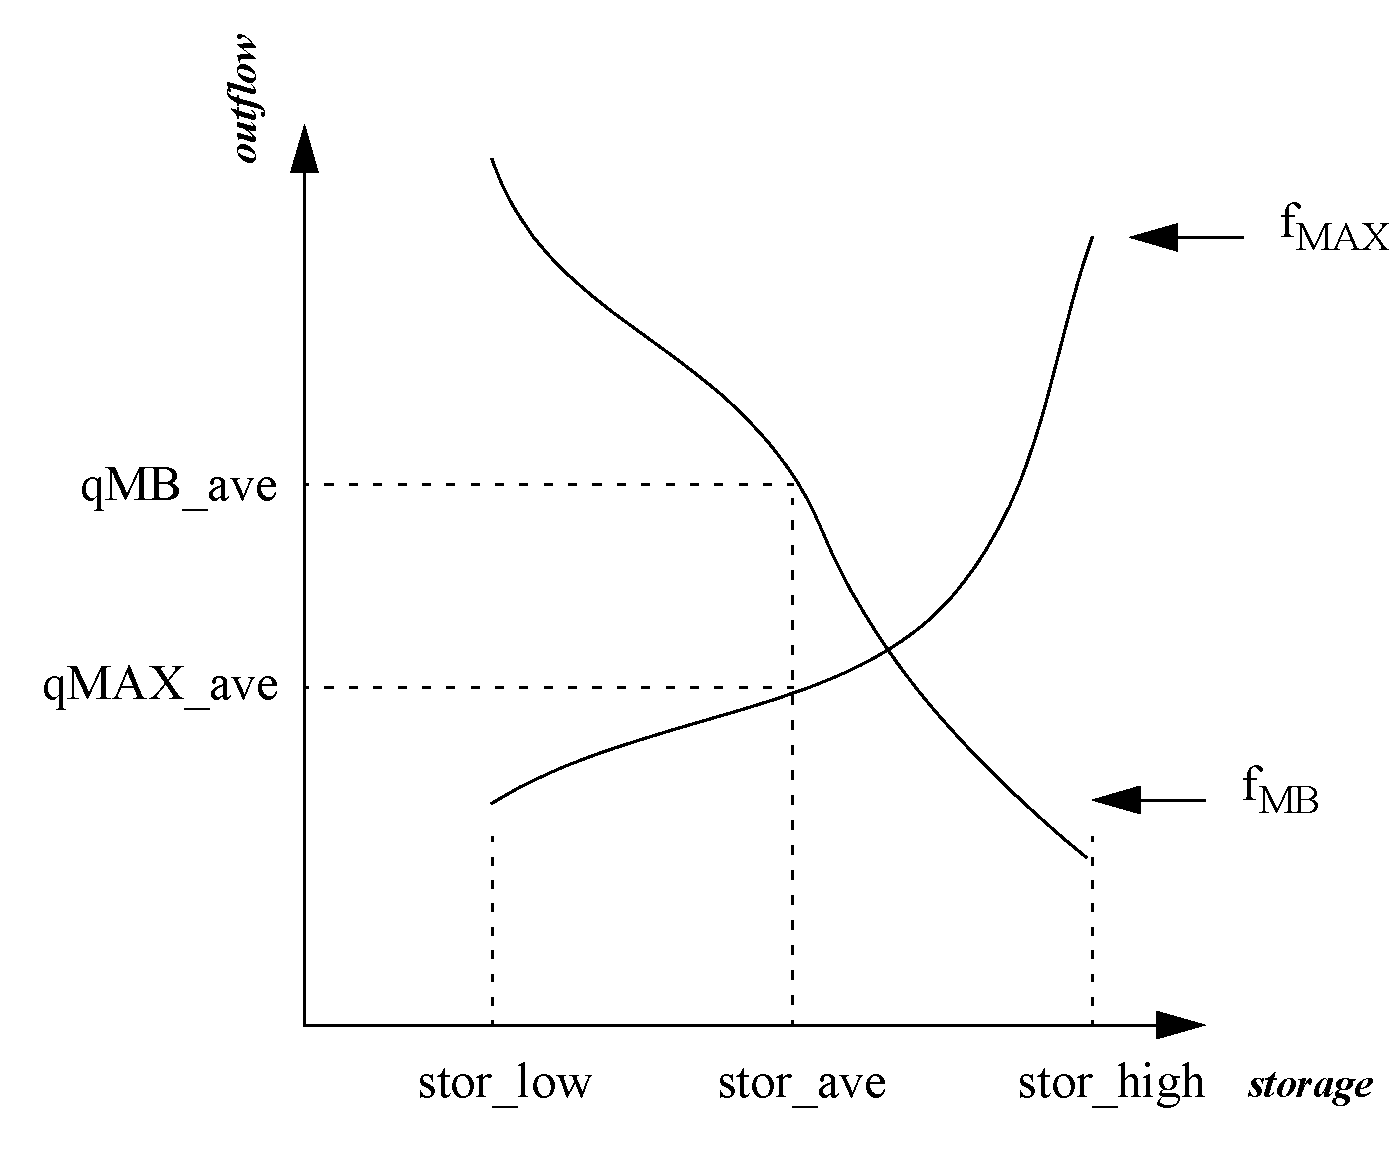
The root of the mass balance and max outflow functions is the intersection of the two curves. To begin the search for this intersection, the routine finds the average of stor_high and stor_low, denoted as stor_ave, and then calculates the corresponding outflows, denoted as qMB_ave and qMAX_ave. Figure A.2 is an illustration.
Figure A.2
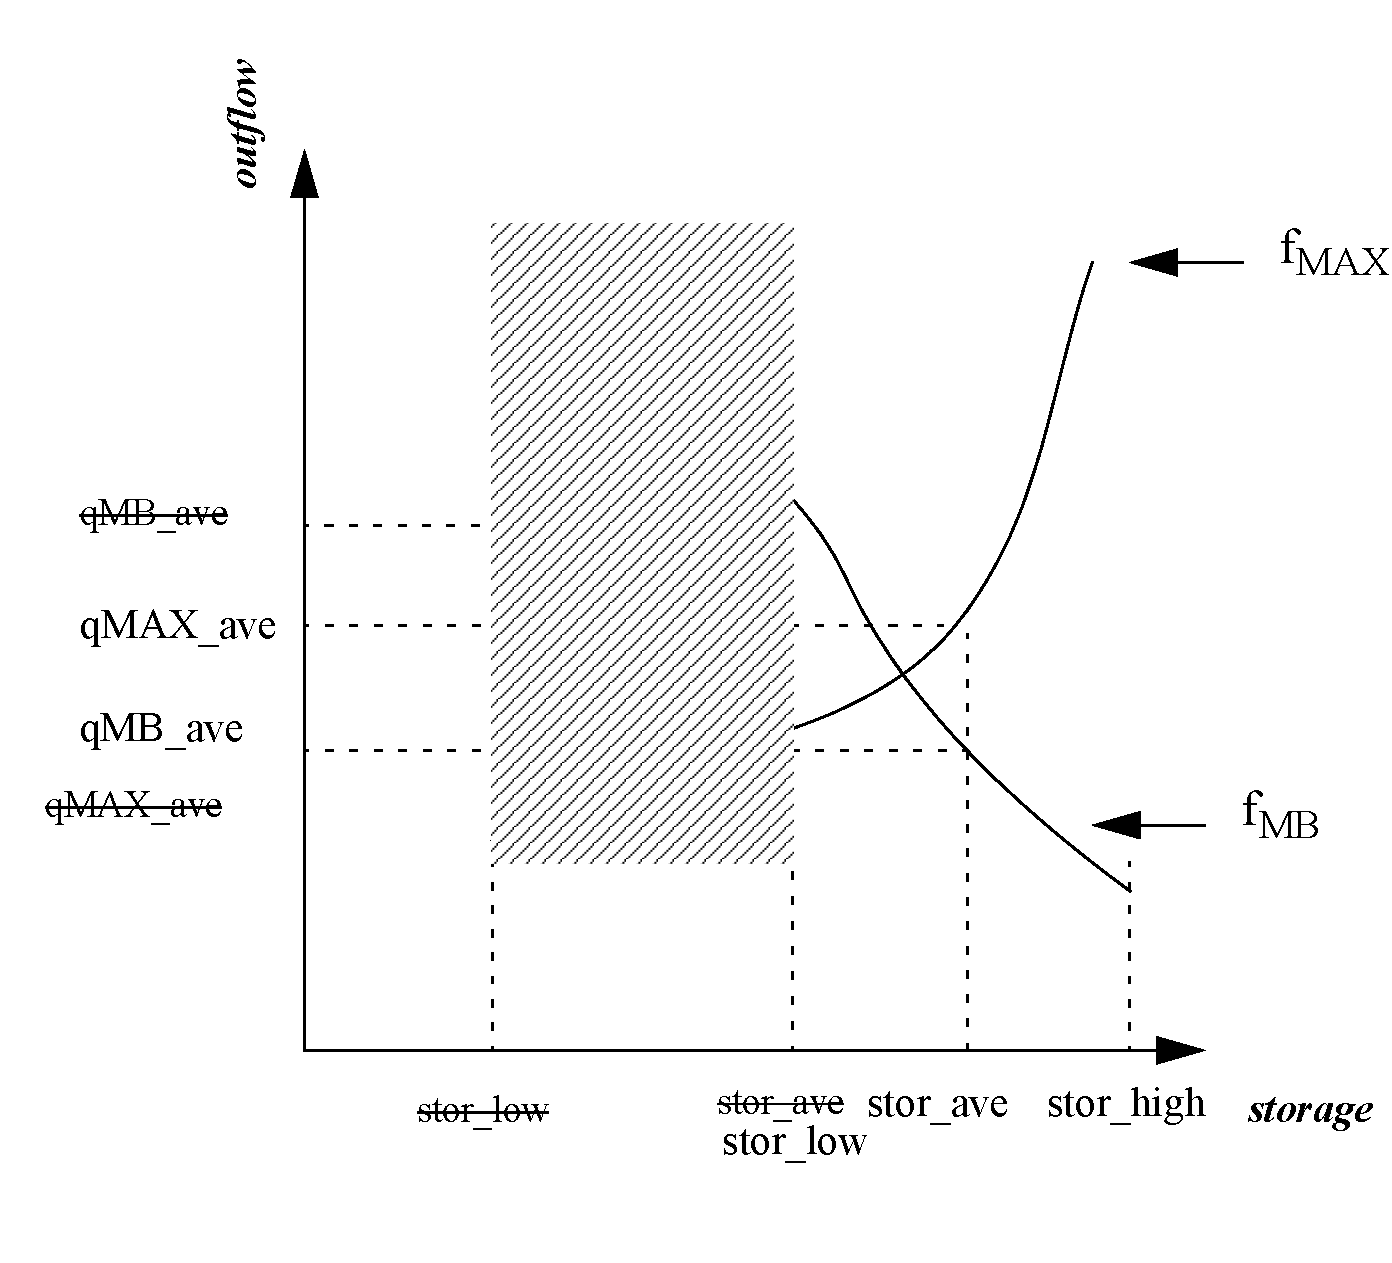
Thus, two intervals have been created. The upper interval is between stor_ave and stor_high, the lower interval is between stor_low and stor_ave. Visually it is apparent that the solution lies in the upper interval. The algorithm determines the interval in which the solution lies using an if-statement. Generally, the if-statements compare qMB_ave to qMAX_ave. If qMB_ave > qMAX_ave, the solution lies in the upper interval. Conversely, if qMB_ave < qMAX_ave, the solution lies in the lower interval. In this example, qMB_ave > qMAX_ave, thus, the solution lies in the upper interval and stor_ave becomes the lower bound by setting stor_low equal to stor_ave. The first step of the second iteration is to calculate a new stor_ave to determine the midpoint of the new interval. Figure A.3 illustrates the results of the second iteration.
Figure A.3
The search area has decreased because the lower interval was eliminated in the first iteration. The outflows were evaluated using stor_ave resulting in qMB_ave < qMAX_ave. Thus, the solution lies in the lower interval; stor_high is set equal to stor_ave and the third iteration is begun. The first step of the third iteration is again to calculate the midpoint of the new interval. The same process is repeated until the values of qMB_ave and qMAX_ave are within convergence. At this point the algorithm is exited and stor_ave and the minimum value of qMAX_ave and qMB_ave are returned as the solution.
The getMinSpillGivenInflowRelease and the mass balance functions evaluate the variables using different curves, but follow the identical procedure as described above. For example, in getMinSpillGivenInflowRelease fmax would be replaced by fmin which describes the behavior of the spill curve.
Revised: 01/11/2023