
Ensemble Data Tool
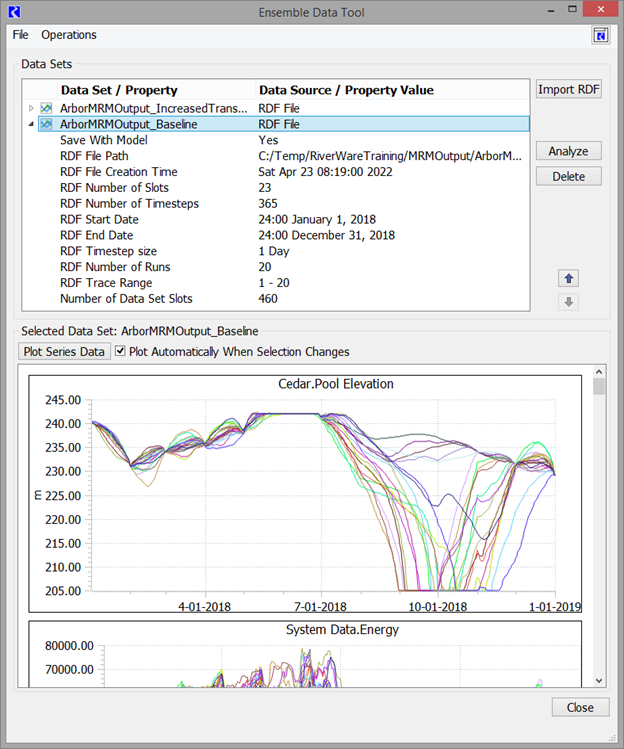
The Ensemble Data Tool (EDT) is used to visualize and analyze the RDF results of an MRM run within RiverWare. A screenshot is shown in Figure 3.12 for a sample Ensemble Data Set with over-plotted lines for each trace. This section describes the Ensemble Data Tool and how to use it.
Figure 3.12 Screenshot of the Ensemble Data Tool
Ensemble Data Tool Sequence
To use the ensemble data tool you must have RDF output from an MRM run. An example Ensemble Data Tool use-case is described by the following sequence. Remember that many of these can be automated using scripts as described in Script Actions for Opening and Analyzing Ensemble Data Sets.
1. Run the model using concurrent MRM (Concurrent Runs) to produce an RDF output file (see Output). This could be a regular or distributed run (seeDistributed Concurrent Runs).
2. Within the same model, open the EDT as described in Accessing the Ensemble Data Tool.
3. Use the Import RDF button and select the RDF file. An Ensemble Data Set object is created on the workspace and shown in the tool.
4. If the Ensemble Data Set contains series data, use the Plot Series Data button to show over-plotted lines of all the traces.
5. To perform analysis, select the data set and select Analyze.
6. Select the main category of analysis and then select any filtering options for slots or traces. Select the specific analysis type (mean, min, max, etc) along with any other relevant options. Select Perform Analysis when ready.
7. Based on the selections, the resulting results data will be added to new or existing slots on new or existing Ensemble Data Set objects. Open the objects from the EDT or the workspace and view or plot the data. In the future, additional plotting and visualization options may be available from the EDT.
8. If specified, the Ensemble Data Set objects will be saved in the model file and can be accessed for additional analysis.
Accessing the Ensemble Data Tool
Access the Ensemble Data Tool from any of the following locations:
• From the workspace, use the Utilities and then Ensemble Data Tool menu.
• From the Multiple Run Control dialog, use the View and then Ensemble Data Tool menu.
• From an Ensemble Data Set object’s open object dialog, use the Open Ensemble Data Tool button.
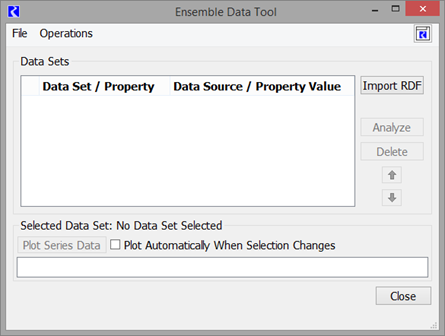
Then the Ensemble Data Tool will open. A blank, empty Ensemble Data Tool is shown in Figure 3.13.
Figure 3.13 Ensemble Data Tool with no Ensemble Data Sets
How to Use the Ensemble Data Tool
The Ensemble Data Tool allows you to create, view and analyze Ensemble Data Sets that are created from RDF files. This section describes these operations
Creating, Organizing and Deleting Data Sets
Use the Operations and then Import from RDF menu or use the Import RDF button. Then use the file chooser to select the RDF file and select Open. The Ensemble Data Tool imports and reads the RDF file and creates an Ensemble Data Object on the workspace and shows it as an item in the Data Sets panel.
The default name and metadata is shown in the Data Sets panel and described below. Right click and choose Rename Selected Data Set to change the data set name. Right-click options also include Expand All and Collapse All items in the tree-view.
Use the up and down arrow buttons to move the selected data set up or down in the list.

Use the Delete button to delete the data set and the ensemble data set object from the tool and model.
Viewing Data Set properties
The Data Sets panel presents the list of data sets as an expandable tree view. Selecting a data set expands its row in the tree view.
For each ensemble data set, the following metadata and properties are shown in the list:
• Save With Model: Whether the ensemble data set should be saved in the model as an object or is temporary and will not be saved
• RDF File Path: the path of the RDF file from which the data set was created
• RDF File Creation Time: The date and time at which the RDF file was created
• RDF Number of Slots: Count of the slots in the RDF file
• RDF Number of Timesteps: Count of the number of timesteps for series slots in the RDF file
• RDF Start Date: earliest date/time of series data in the RDF file
• RDF End Date: latest date/time of series data in the RDF file
• RDF Timestep size: the size of the timestep for series data.
• RDF Number of Runs: count of the runs in the RDF file
• RDF Trace Range: the range of trace numbers for traces in the RDF file
• Number of Data Set Slots: the number of slots in the data set found by multiplying the number of slots by the number of traces.
For each Analysis data set, the following are shown:
• Save With Model: Whether the ensemble data set should be saved in the model as an object or is temporary and will not be saved
• Number of Data Set Slots: the number of results slots in the data set.
Plotting Selected Data Sets Series Slots
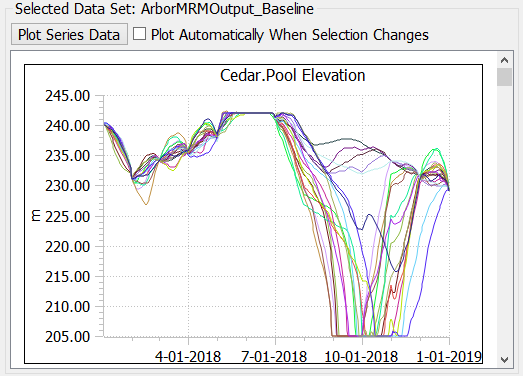
The EDT displays the Selected Data Set panel as a scrollable list of line charts, one per slot, with data for each trace over-plotted. For performance reasons, because data sets can be large, the plots are created on demand using the Plot button. You can choose to have them automatically displayed whenever you select a new data set using the Plot Automatically When Selection Changes.
Note: Only series data from RDF data sets can be plotted. In the future, additional plots and plotting of Analysis data sets may be supported.
Figure 3.14 Screenshot of Ensemble Data Tool Selected Data Set panel
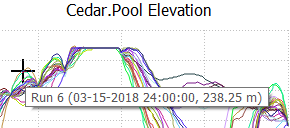
Hover over a curve to see the run/trace number:
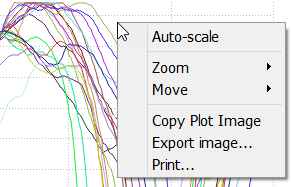
Draw a rectangle to zoom in. Click and drag the middle mouse button to pan the plot. Right click on a plot area for additional plotting functionality as shown in Figure 3.15.
Figure 3.15 Ensemble Data Tool Plotting controls.
Analyzing Data Sets
Use the Analyze button to perform analysis on an Ensemble Data Set. Currently, only RDF data sets can be analyzed; in the future there may be ways to perform additional analysis on Analysis data sets.
The following types of analysis are supported by the Ensemble Data Tool. These correspond directly to the types of analysis supported by the ensemble data analysis script action types. See the script documentation for the specific details of each analysis type.
EDT Analysis Type | Script Action Type | Link to Script Information |
|---|---|---|
Per Timestep, Across Traces | Analyze Ensemble Data Set | |
Regression On Scalar Data, Across Traces | Compute Regression | |
Duration Curve | Compute Duration Curve |
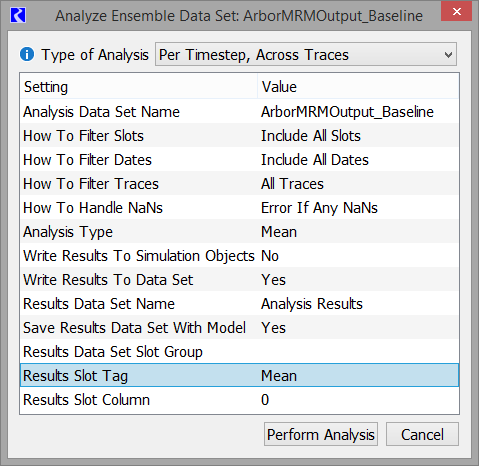
When you select Analyze, the tool presents a modal dialog which allows you to configure and perform the analysis as shown in Figure 3.16
Figure 3.16 Screenshot of Analyze Data Set dialog
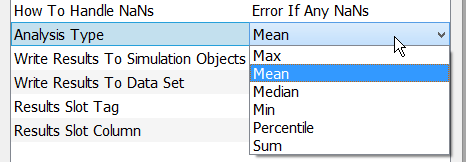
Click any item in the right column to initiate editing. For example, click the value and then select from the menu to change the analysis type, as shown in Figure 3.17. Documentation of the various options are in the script documentation, with links in the table above, Analyzing Data Sets.
Figure 3.17 Screenshot of editing while using the Analyze Ensemble Data Set dialog
About Ensemble Data Sets
An Ensemble Data Set is an object that contains either RDF trace data or the results of analysis of that data.
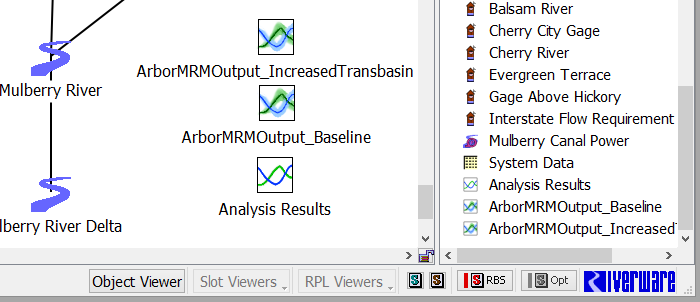
In addition to being listed in the Ensemble Data Tool, all ensemble data sets are also displayed on the workspace. When a data set is created, its workspace object is automatically placed on the workspace in the lower right corner of the region containing existing objects. Figure 3.18 shows a workspace containing several ensemble data sets. Variations in the icon distinguish between the set's data source (RDF or Analysis).
Figure 3.18 Workspace with ensemble data set objects
Ensemble Data Sets are simulation objects. For example, the data are represented as slots, sometimes referred to as “data set slots”, which can be either series, scalar, or table. An Ensemble Data Set can be opened in the Object Viewer and allows access the wide range of RiverWare functionality that applies to slot data. For example, you can visualize ensemble data in plots or canvas charts and write their data using DMIs or model reports.
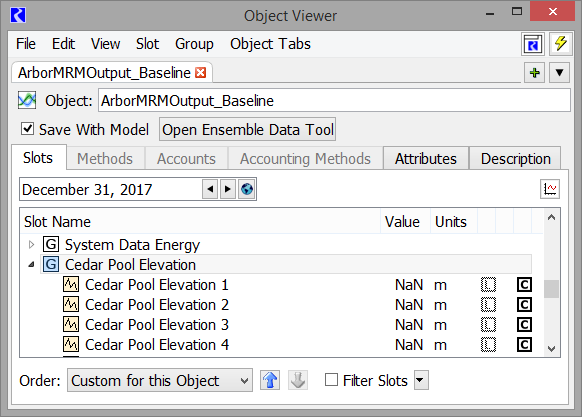
Ensemble Data Sets in the Object Viewer have an additional row of controls, allowing the user to control whether the data set will be included in the model file and providing a button with access to the Ensemble Data Tool as shown in Figure 3.19.
Note: The object is read-only; many operations that change the object, slots, and data are disabled.
Figure 3.19 Object Viewer displaying an Ensemble Data Set
Script Actions for Opening and Analyzing Ensemble Data Sets
The following script actions operate on the Ensemble Data Tool:
• Analyze Ensemble Data Set - Compute a specified statistic (mean, median, etc) for an open ensemble data set.
• Compute Duration Curve - Compute a duration curve for a set of series slots across multiple traces and timesteps from an open ensemble data set.
• Compute Regression - Perform a multiple linear regression analysis for an open ensemble data set.
• Create Ensemble Data Set - Read an RDF file and create a dataset in the Ensemble Data Tool.
• Delete Ensemble Data Set - Close and delete the specified ensemble data set from the Ensemble Data Tool and the model, freeing the memory associated with the data set.
• Open Ensemble Data Tool - Open the Ensemble Data Tool dialog box.
A sample use case would be the following sequence of script actions:
1. Create Ensemble Data Set action to read an RDF file and create the data set.
2. Open Ensemble Data Tool action to open the dialog box.
3. Memo action to pause while you look at the plots.
4. Analyze Ensemble Data Set to perform statistical analysis on the data set.
5. Open Slot to show the slot populated by the Analyze Ensemble Data Set.
6. Delete Ensemble Data Set to remove the data set from memory.
Revised: 07/05/2022