
Instructions for Creating a Teacup Diagram
Following are instructions for creating a teacup diagram from scratch. These are the bare minimum instructions; you will want to modify fonts, colors, and label text to make the diagram look great.
1. From the Output Manager dialog menu, select the New, then New Output Canvas.
In general, to create a new Canvas, select General Settings, then Canvas Layout to define what you want to have in the Canvas. Select Selected Item Settings to configure each item in the Canvas.
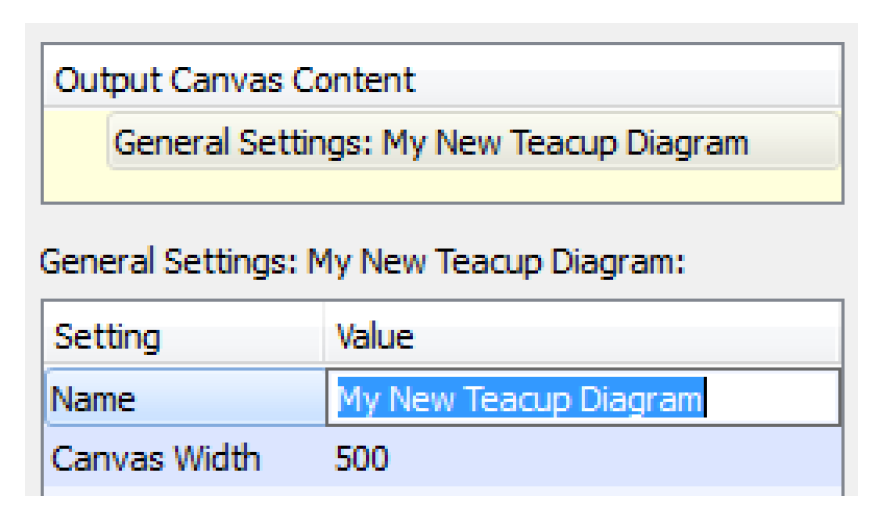
2. In the General Settings, specify the Name.
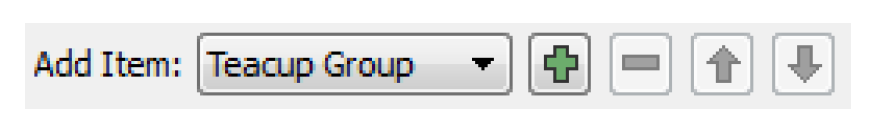
3. Add a Teacup Group by selecting it from the Add Item menu and selecting +.
4. Specify the slots to use for the Current Entity and Maximum Entity by selecting Maximum Slot Name, Reference Type, Current Slot Name, and Reference Type.
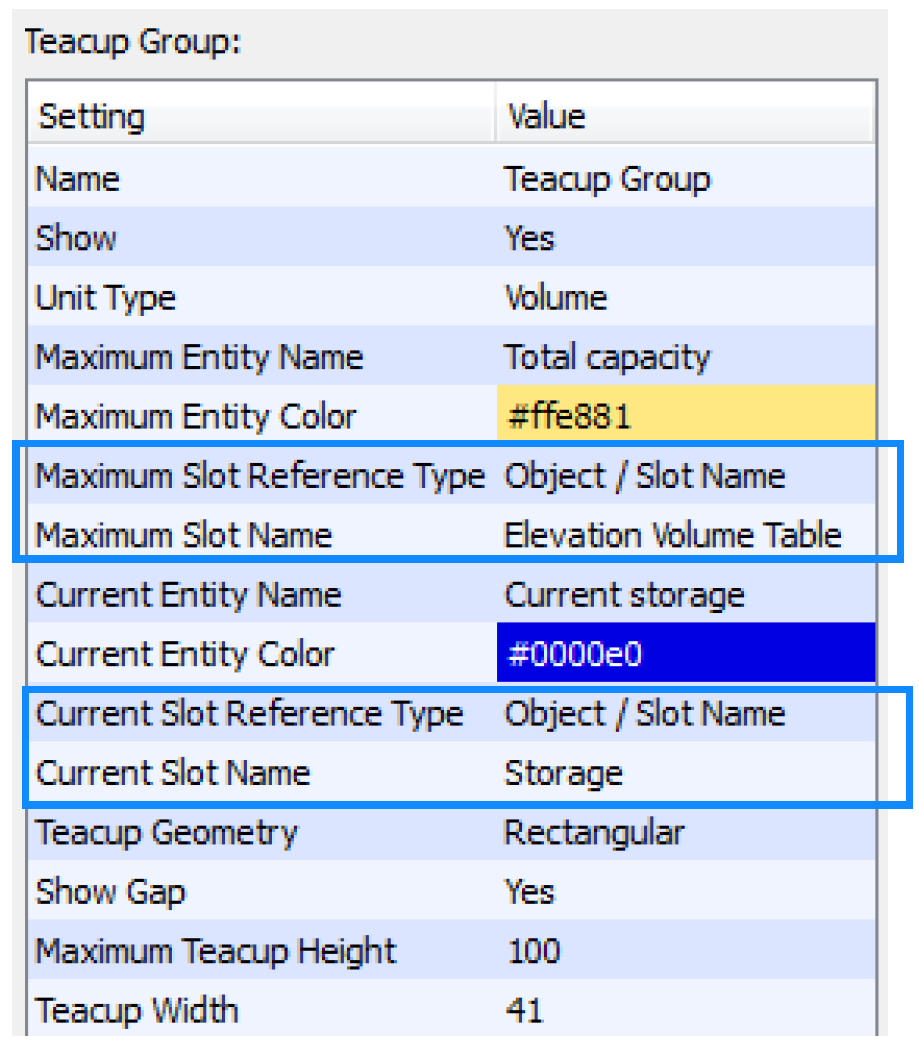
5. Specify the Teacup Geometry (rectangular or trapezoid) and whether you would like to Show Gap on the side of each teacup.
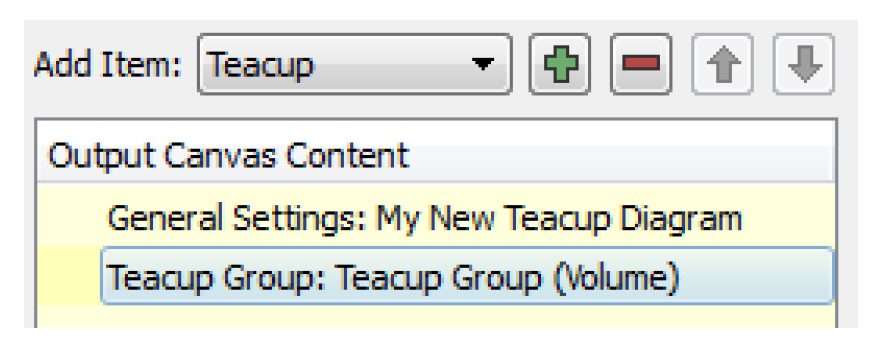
6. Add Teacups to the group. First select the Teacup Group, then select Teacup from the Add Item menu. Select +.
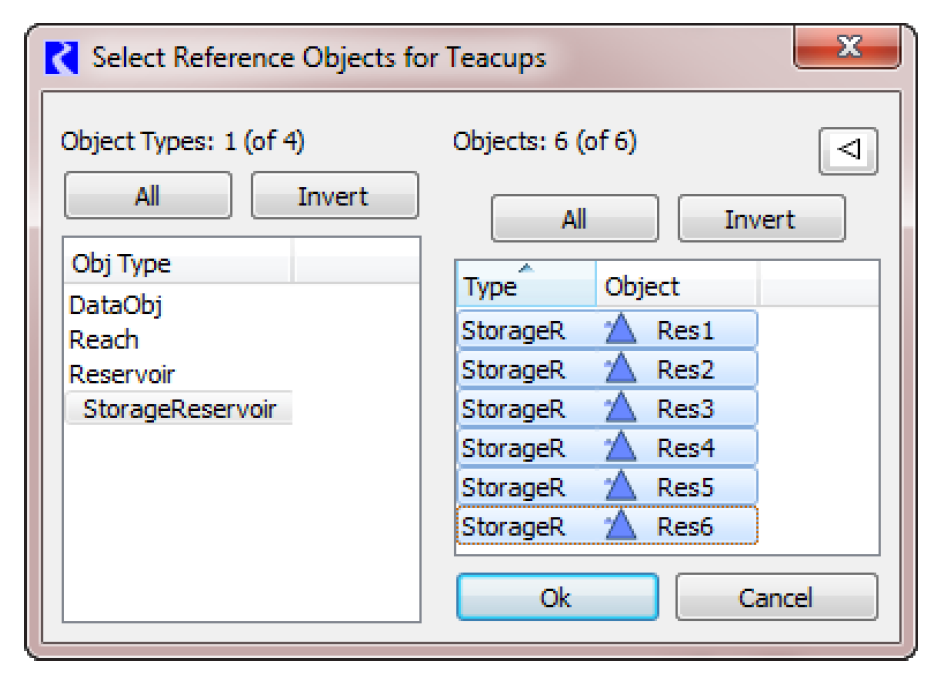
7. Select the objects you wish to use. Make sure to select all the objects you want. One teacup will be created for each object.
8. This will create a set of teacups and show them on the preview canvas. The initial placement uses the positions of the objects on the Simulation Workspace.On the Canvas Preview, drag the teacups to the desired location.
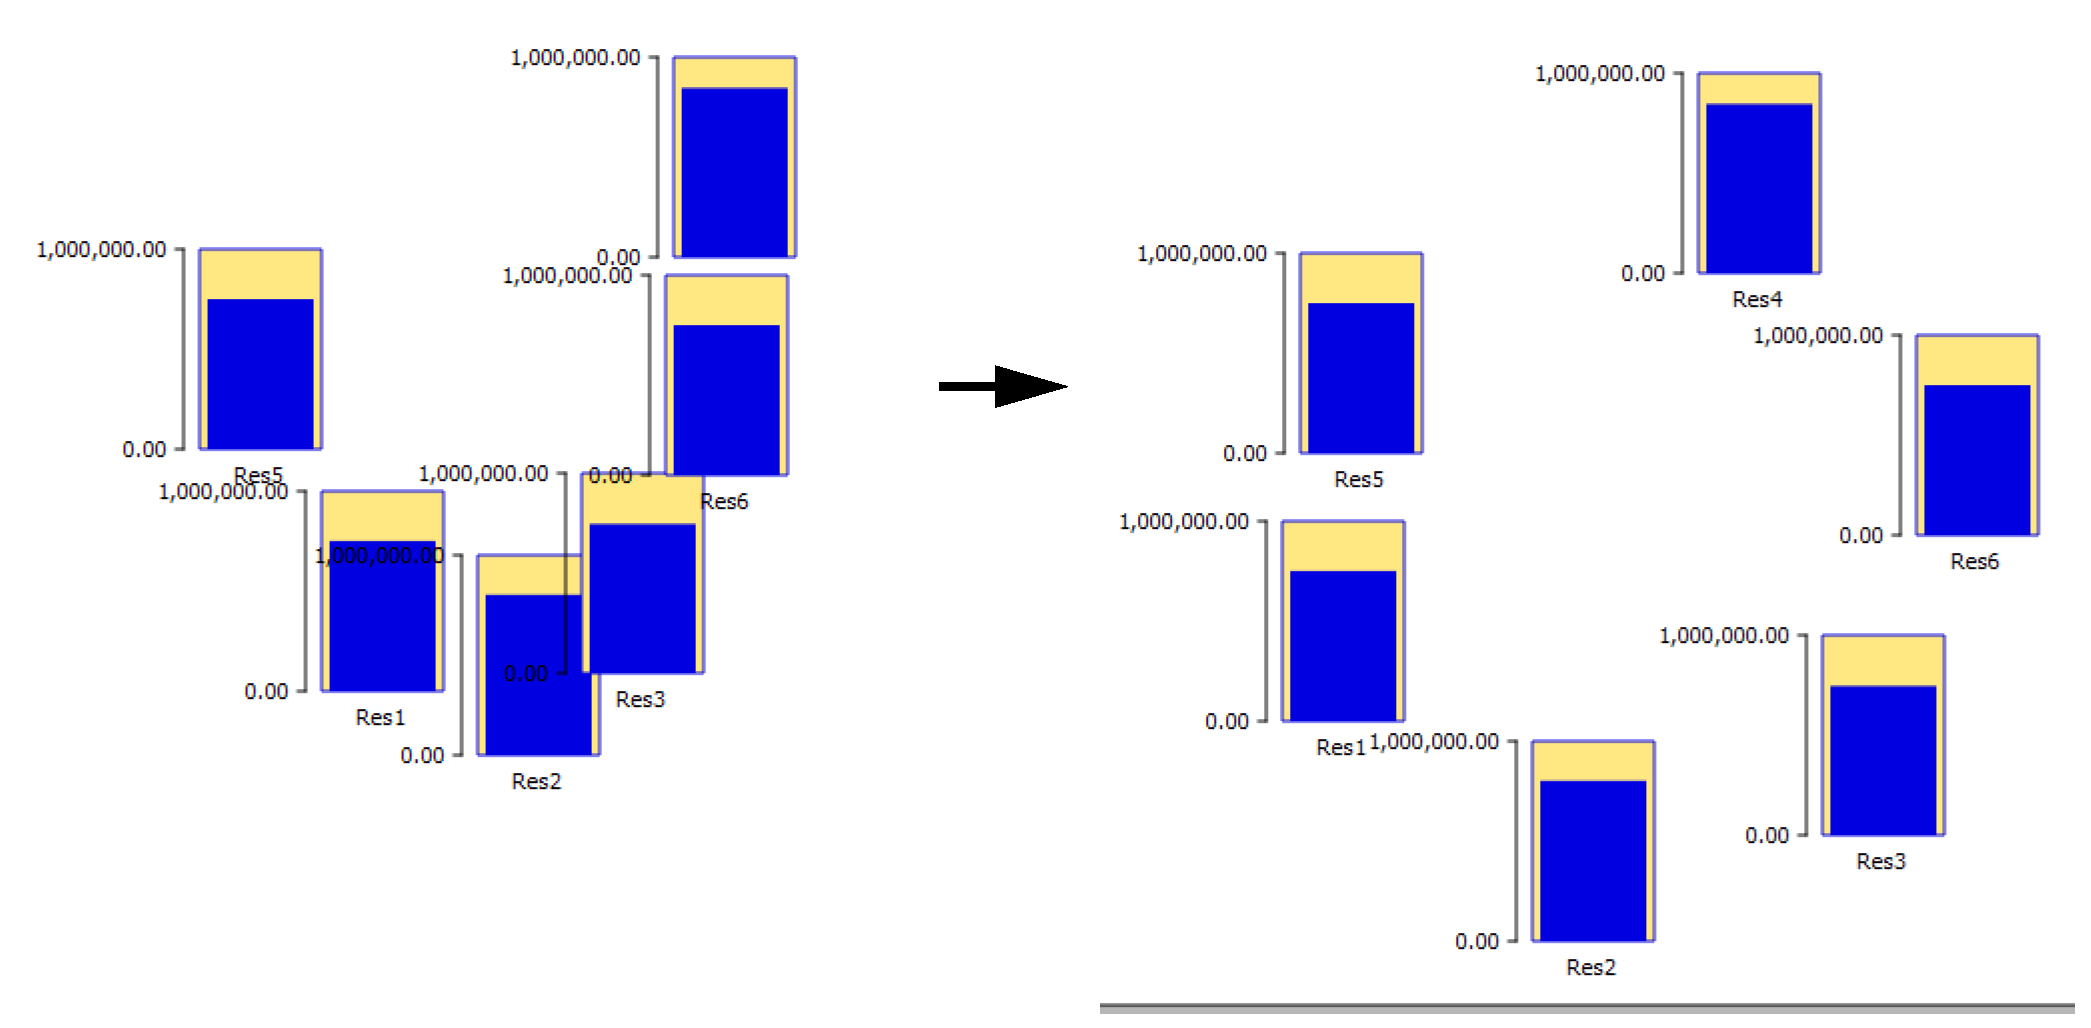
9. In the teacup group, modify the dimensions of the teacups. For rectangular teacups, specify the width of all teacups and the height of the largest teacup in the Settings panel. For trapezoids, specify the bottom width, maximum height, and top widths of the largest teacup. All other teacups will be scaled accordingly.
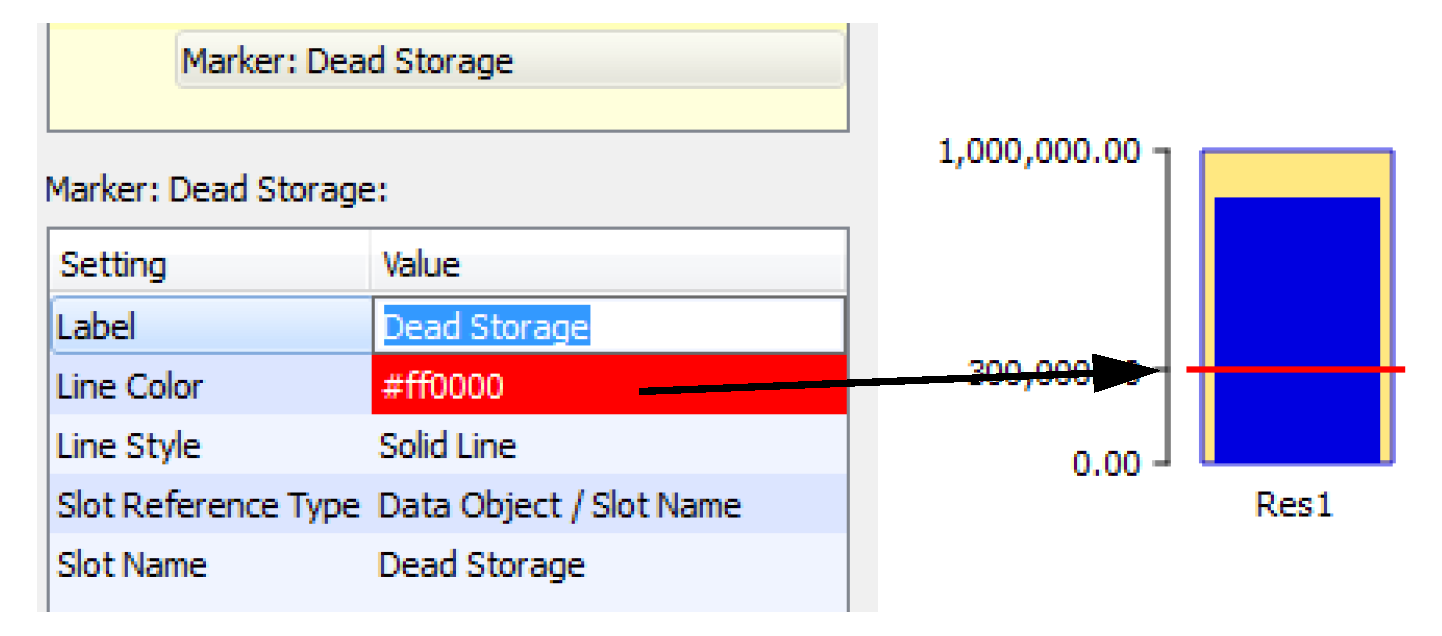
10. Add Markers to the Teacup Group: First select the Teacup Group, then select Marker from the Add Item menu. Select +.
11. Specify the Slot (series, scalar, periodic) to use for the marker and its location. Specify a better label if desired. This will be shown later on the legend.
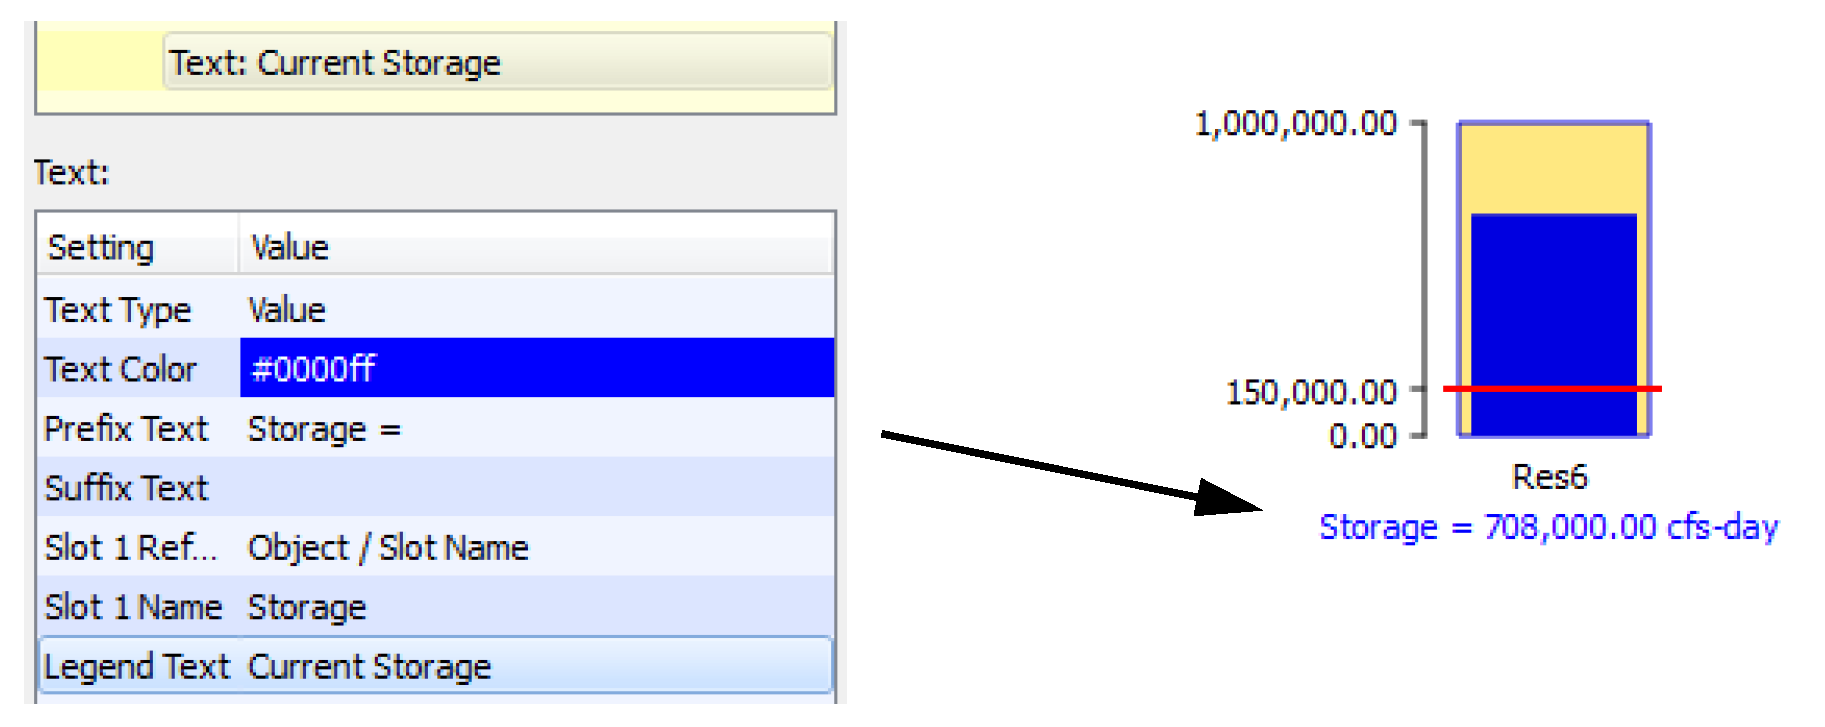
12. Add a Text item. First select the Teacup Group, then select Text Item from the Add Item menu. Select +.
13. In the settings, specify the type of text. For this example, we will add text showing the current storage. Select Value for the Text Type setting. Specify the prefix, suffix, slot reference, slot name, and Legend Text.
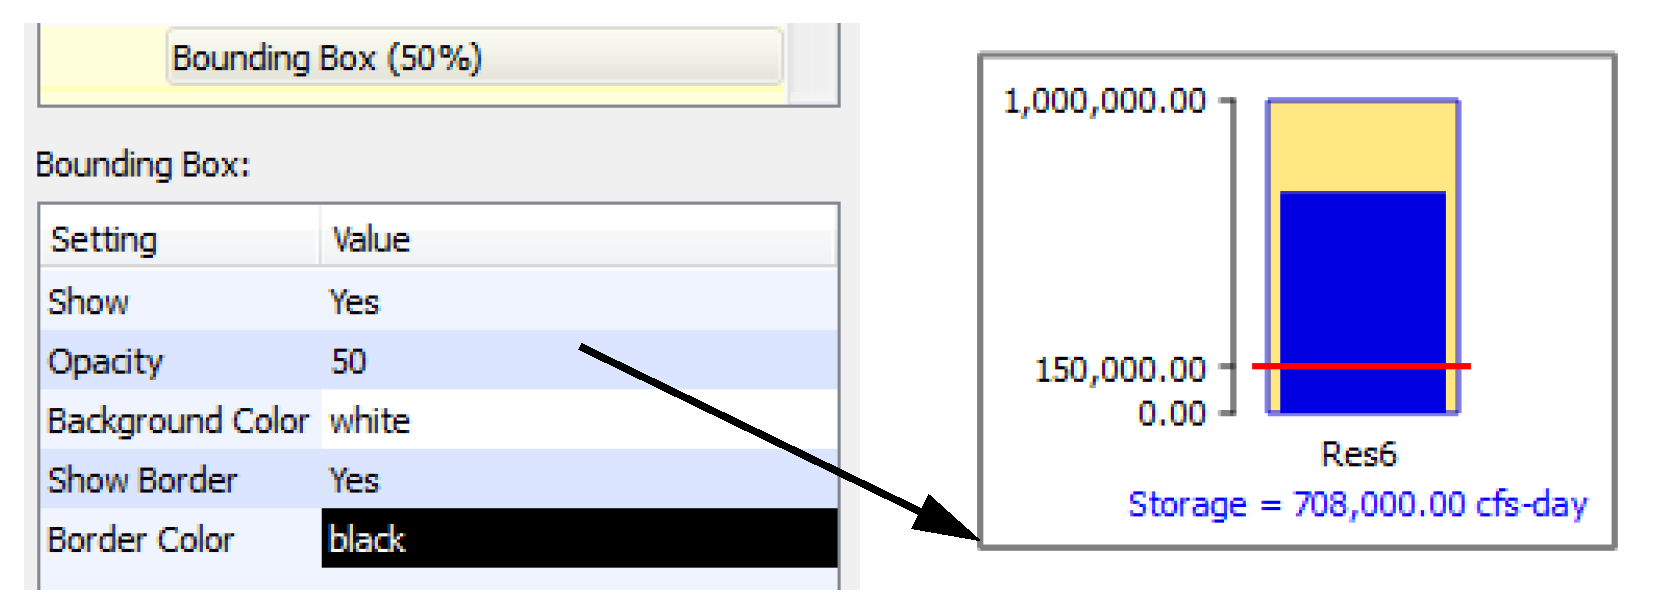
14. If desired, add a Bounding Box to the Teacup Group to create a border around each teacup. Select the Teacup Group, then select Bounding Box from the Add Item menu. Select +. Modify the colors or opacity if desired.
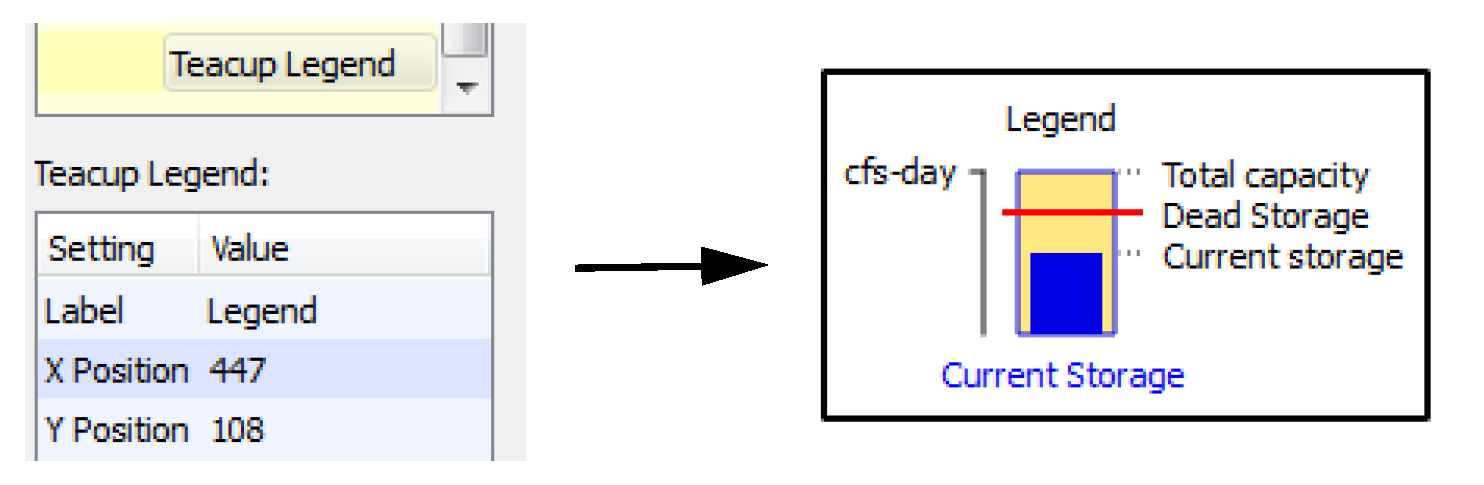
15. Add a legend so all of the units, markers, and text values are clearly annotated. Select the Teacup Group, then select Teacup Legend from the Add Item menu. Select +.
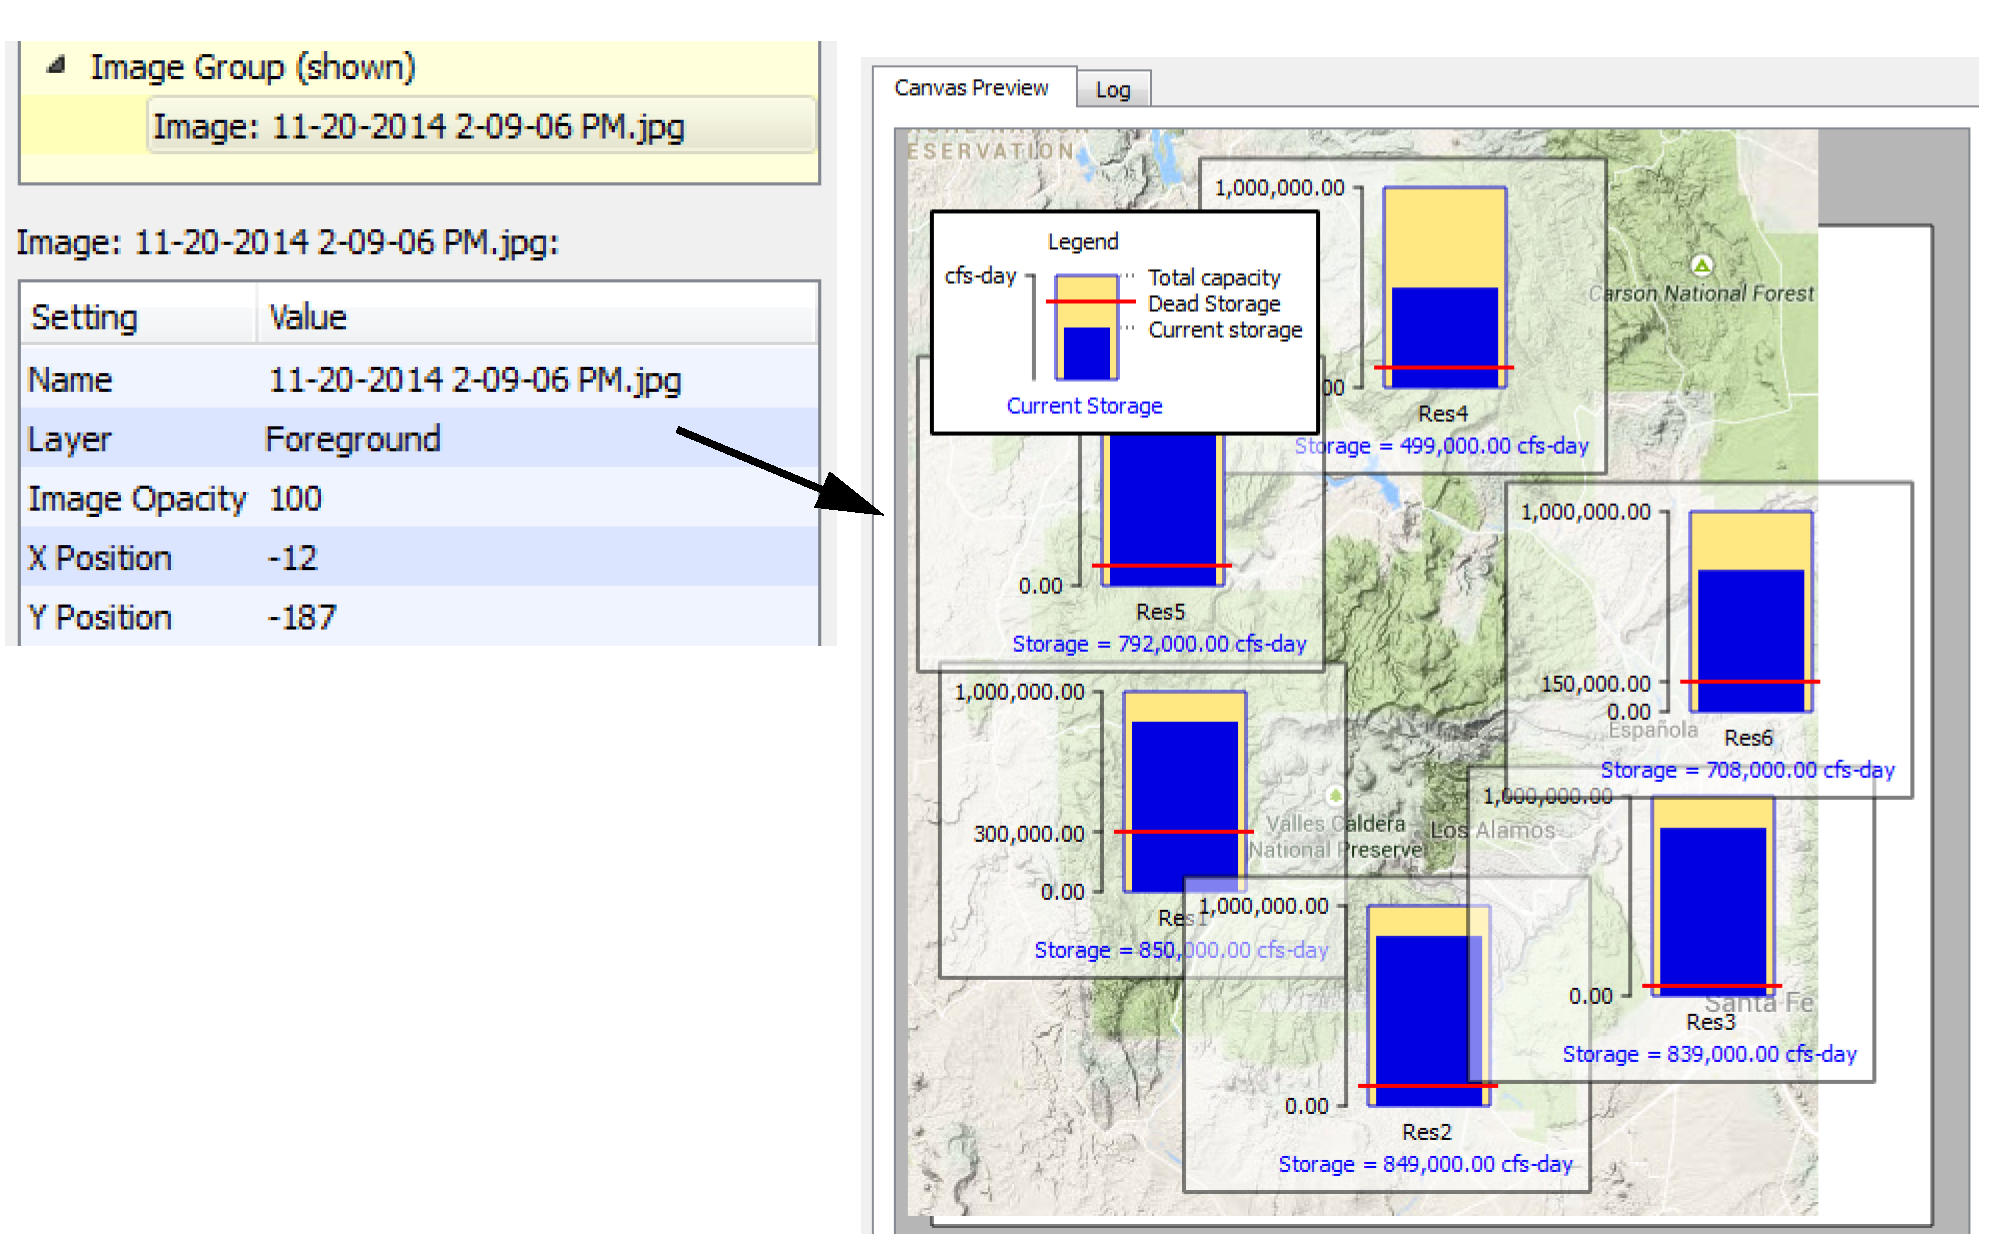
16. Add background images and foreground images if desired. Select the General Settings, then select Image Group from the Add Item menu. Select +. Select Image from the Add Item menu. Select +. A file chooser opens. Select the desired jpg or png file.
17. At this point, your teacups and images may not fit on the canvas. Following are some possible solutions:
– Enlarge the canvas by selecting General Settings for width and height.
– Shrink the teacups by selecting Maximum Bar Height in the Teacup Group settings.
Then drag the teacups and images to fit them on the canvas as desired.
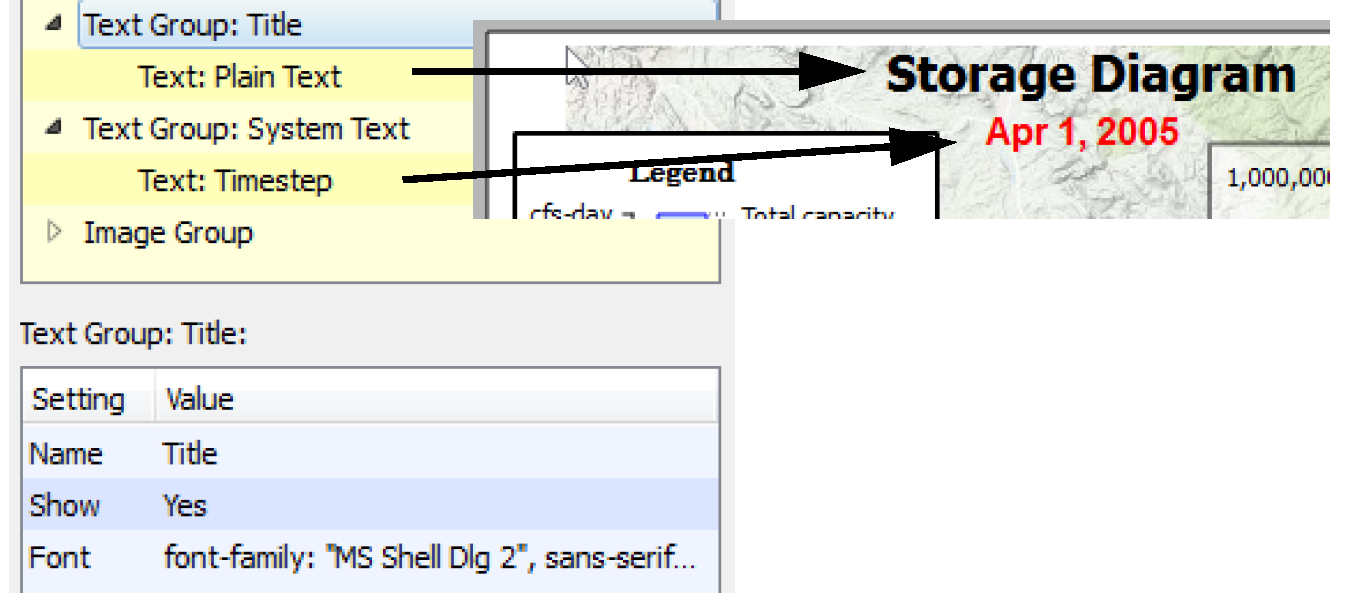
18. Add one or more Text Groups and free-standing Text Items. Use these to create a title, show the timestep, or show a system-wide summary variable. Add a Text Group by selecting it from the Add Item menu and selecting +. Specify the desired Font.
19. Add Text Items to the group. First select the Text Group, then select Text Item from the Add Item menu. Select +. Figure 6.28 shows two Text Groups that each contain one Text Item. The first is Plain Text, while the second is the Timestep.
Figure 6.28
20. Modify the colors and fonts to make the canvas look pretty.
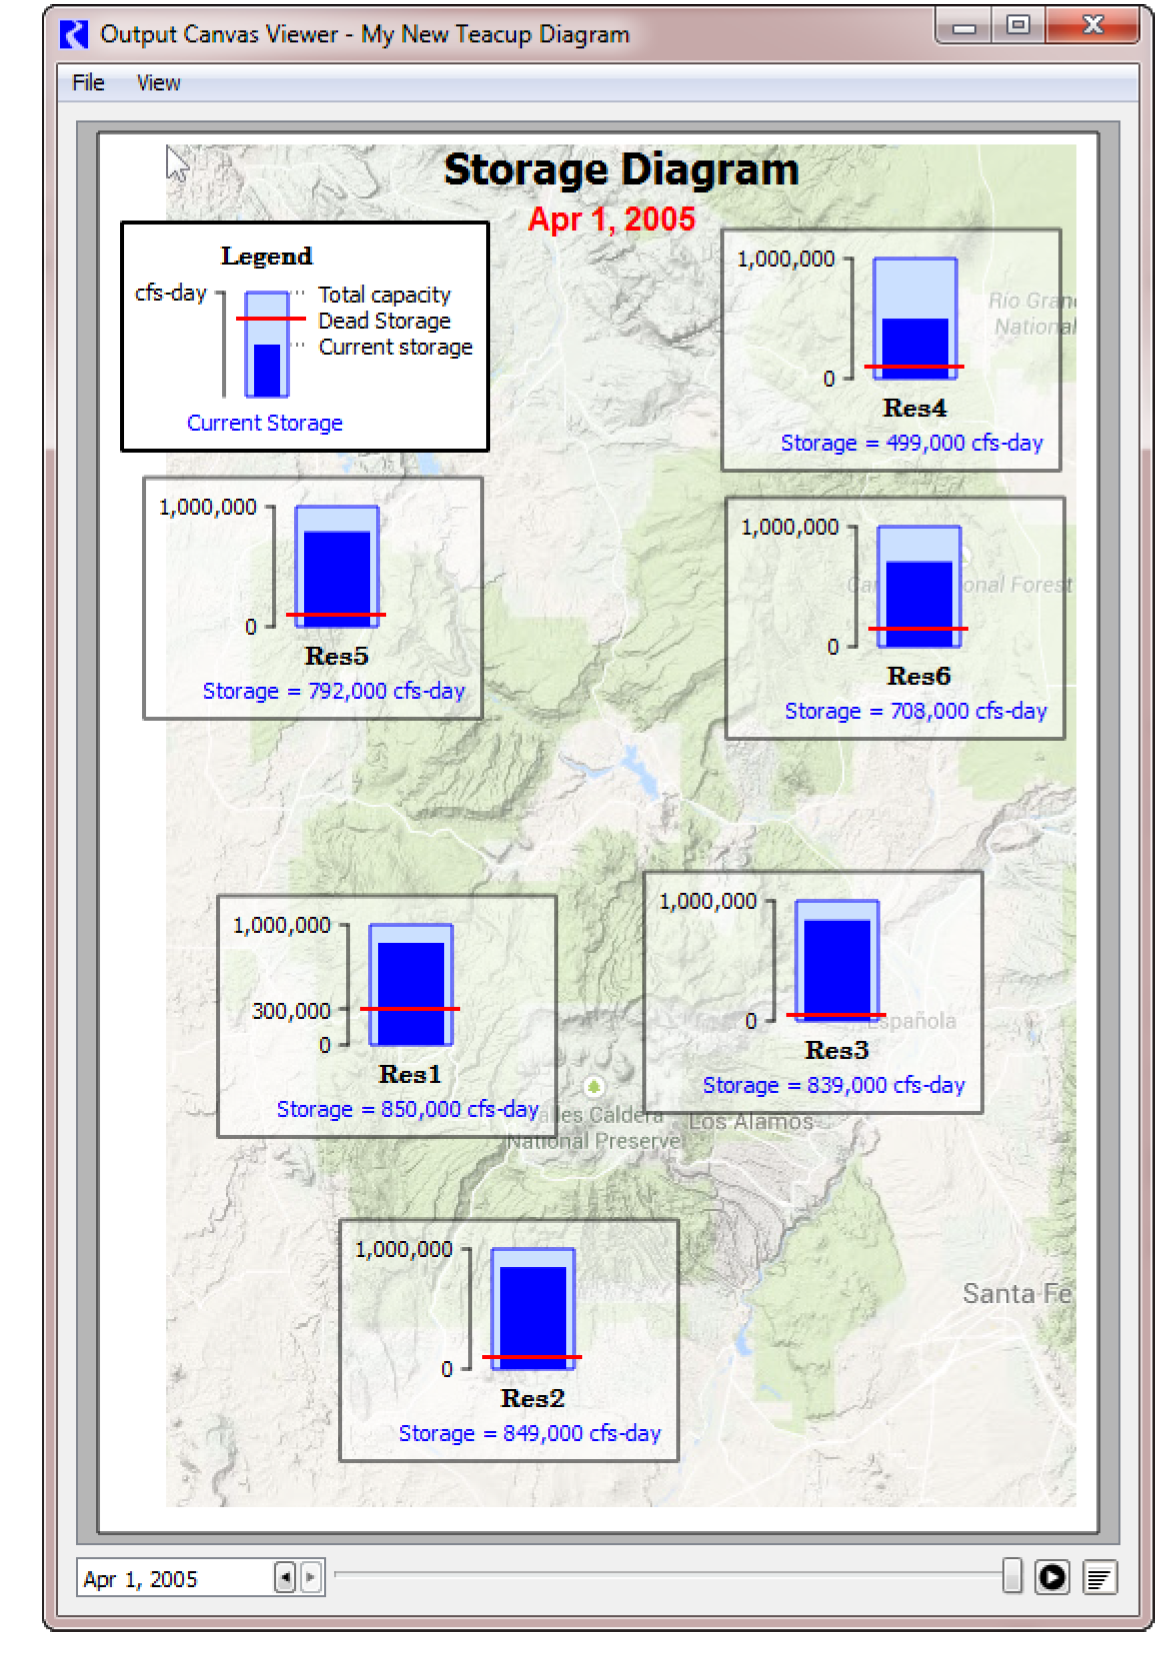
21. Select OK to save the canvas and then generate the device from the Output Manager. Use the animation controls to watch the teacups change through time. Figure 6.29 shows our result.
Figure 6.29
Revised: 07/05/2022