
Priority-oriented Optimization Solution Analysis Tool
The Priority-Oriented Optimization Solution Analysis Tool provides detailed information from an optimization run.This includes the following:
• Objective values
• Satisfaction of derived objectives (e.g. Repeated Maximin) from goals with soft constraints
• Constraints frozen with each solution
• Variables frozen with each solution
• Dual prices of frozen constraints
• Reduced costs of frozen variables
This information is valuable for understanding the optimization solution. For example, observing which constraints were frozen immediately after a given solution indicates which policies were driving the solution. Information from the tool can also be helpful for debugging problems with an optimization run. For example, constraints that were frozen when not expected can at times indicate policy in the goal set that is having unintended consequences.
Figure 7.1
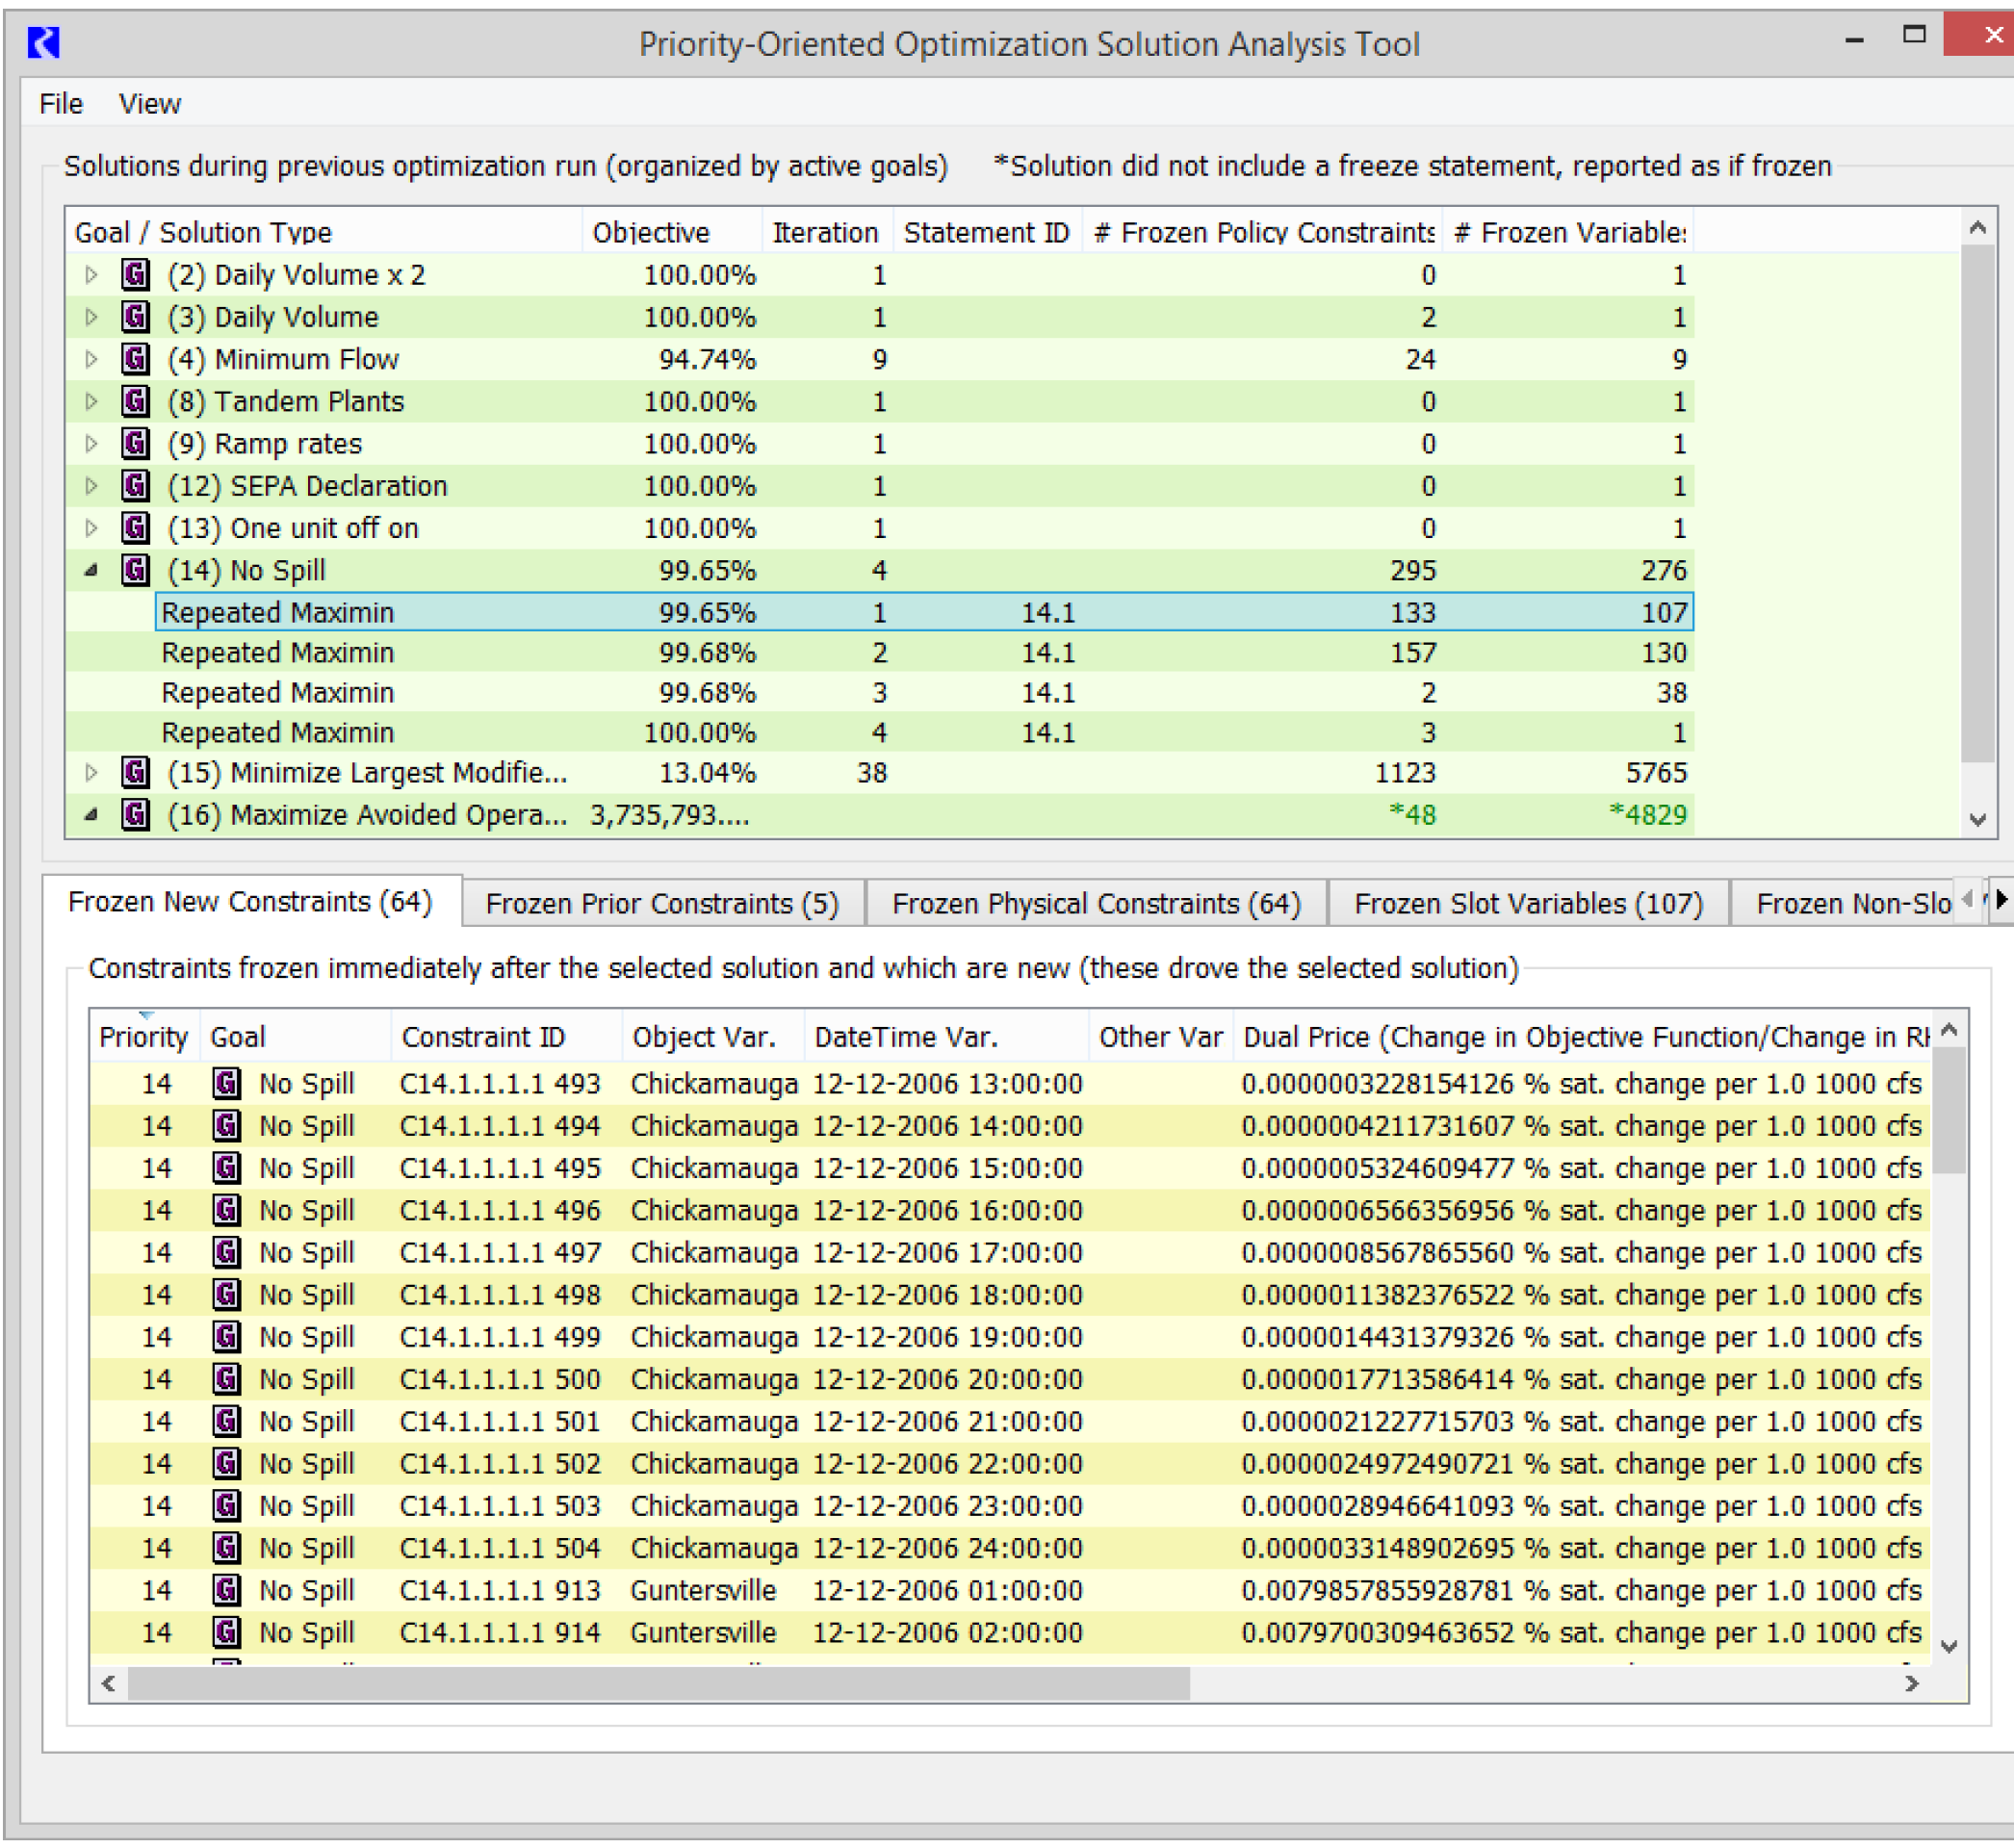
The tool has two panels. The top panel, the Solution Information panel, provides an overview of the solutions that occurred during a single optimization controller run. The tabs of the lower panel provide additional details; the focus of these details is controlled by user selection within the Solution Information panel.
The information displayed by the tool is:
• Collected during every optimization run.
• Invalidated and completely cleared by deletion of objects or slots from the workspace.
• Cleared whenever a new optimization run is initiated.
• Corresponds to the current run when paused within a run; otherwise it corresponds to the previous optimization run.
• Only guaranteed to display correctly when the currently loaded goal set was the previous run’s goal set.
• Partially saved in the model file. The entire set of information can be saved to an external file and reloaded for later use.
During an optimization run, the display updates when the run is paused, stopped, terminated, or ends.
Accessing the Analysis Tool
When information about the last optimization run is available, the Priority-Oriented Optimization Solution Analysis Tool can be accessed in the following ways:
• From the Run Control dialog: View, then Optimization Solution Analysis.
• From the Model Run Analysis dialog: File, then Optimization Solution Analysis.
• From the Workspace: Utilities, then Optimization Solution Analysis.
Save/Load Problem
The information associated with the Solution Information panel is automatically saved within the model file. The information associated with the remaining panels is likely to be large and so is not saved with the model, but it can optionally be saved to a file in the optimization output directory.
To automatically save the problem each time:
1. Open the Run Control dialog.
2. Select the Optimization controller.
3. Select View, then Optimization Run Parameters.
4. Check the box for Save Final Optimization Problem.
When this option is selected, the constraint and variable information will be saved to a file in the optimization output directory when the model is saved.
To save the problem interactively for later use, use the File, then Save Problem operation to write the problem to a file.
To load the saved information, after opening the relevant model and loading the goal set, open the Solution Analysis Tool and select File, then Load Problem and choose the desired file.
Note: For the File, then Load Problem utility to function correctly, the active goals and their priorities in the problem being loaded must match those of the most recent optimization problem currently displayed in the Solution Information panel (i.e. must be from a run with the same goal set or at least a set that is the same at the top level of goal names and priorities). If the loaded problem is from a different goal set, one with different goals, different goal activation and/or different prioritization than the most recent solution displayed in the Solution Analysis Tool, then the information displayed will not be consistent with the loaded problem.
In most cases, the Priority-Oriented Optimization Solution Analysis Tool will be used for a run just completed and this step of saving and loading the optimization solution is not necessary.
Solution Information Panel
The Solution Information Panel presents an overview of the optimization solution. The top level displays the active goals in the loaded goal set, in priority order. Clicking on the arrow at the left of each these goal rows will expand the row to display information about each solution corresponding to that goal (a solution row). See Table 7.1 for details.
Column Name | Goal Row | Solution Row |
|---|---|---|
Goal/Solution Type | Priority and name of the goal | Type of solution from the executed statement in the associated goal, one of: Maximize Objective, Minimize Objective, Summation, Repeated Maximin, Single Maximin, Mixed Integer |
Objective | The value of the first solution row that has a value; for Maximize or Minimize objectives this is the objective value; for Repeated Maximin it is the percent satisfaction of the derived objective on the first iteration | The objective value (with units); if the associated statement was a Maximin this is the percent satisfaction of the derived objective. |
Iteration | For goals with Repeated Maximin, the total number of iterations; otherwise no value is displayed | For Repeated Maximin, the solution index (iteration number); otherwise no value is displayed |
Statement ID | No value displayed | The first number indicates the priority of the goal. Subsequent numbers correspond to levels within the goal. (e.g. 22.1 indicates the first statement in goal 22). |
Number of Frozen Policy Constraints | The number of policy constraints introduced by goals that were frozen while executing the goal (all iterations); physical constrains are not included in the count | The number of policy constraints introduced by goals that were frozen immediately after the corresponding solution; physical constrains are not included in the count. See also the following section. |
Number of Frozen Variables | The number of variables frozen while executing the goal (all iterations) | The number of variables frozen immediately after the corresponding solution. |
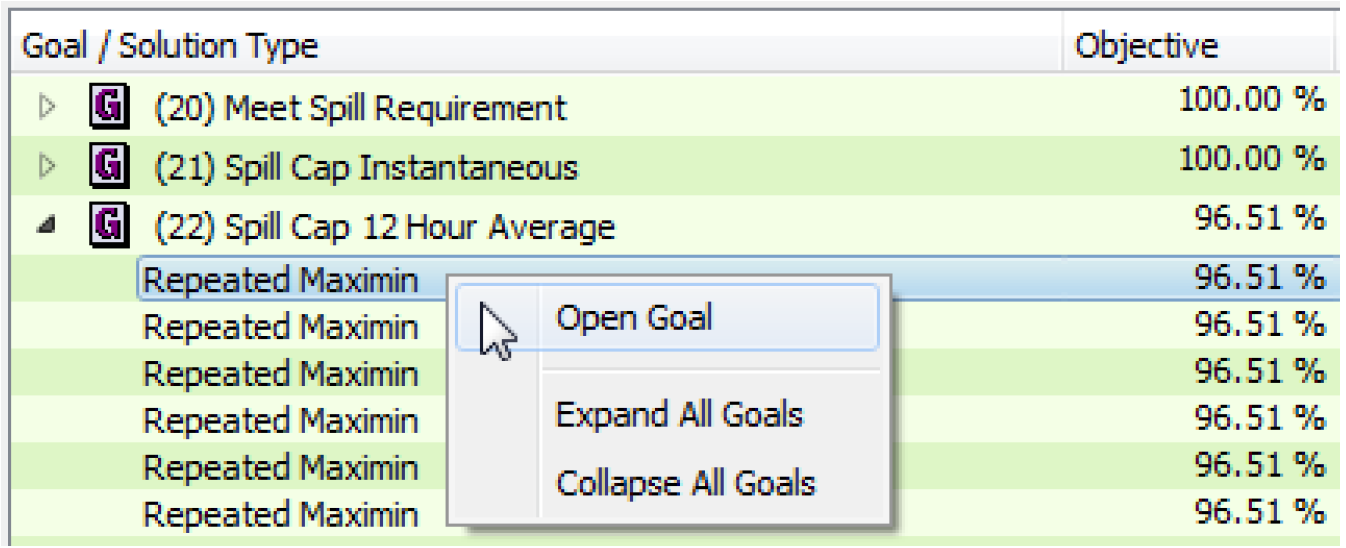
Right-clicking on a row in the Solution Information Panel will open a context menu that will allow to you open the corresponding goal.
Solutions Without a Freeze Statement
In a typical policy, most problem solutions are immediately followed by the freezing of solution limiting variables and constraints. This freezing occurs automatically only for solutions that occur during execution of a Repeated Maximin statement; for freezing to occur after solutions caused by statements of other types, the policy must contain an explicit Freeze statement.
When a problem solution is not immediately followed by a freeze before the next solution, it is sometimes useful to know which constraints and variables would have been frozen had a Freeze Statement been executed. Thus, for these solutions the “# Frozen Constraints” and “# Frozen Variables” columns contain the number of constraints and variables that would have been frozen had the solution been immediately followed by a Freeze statement. These totals are displayed with a preceding asterisk (*) and a differently colored font.
Note: When more than two solutions occur before a freeze, a single variable or constraint might have been frozen at multiple solutions, but is reported for only the earliest solution.
Frozen Constraints Tabs
The lower panel presents five tabs. The first three present lists of constraints that were frozen:
Frozen New Constraints
Constraints frozen immediately after the selected solution, which were introduced by the goal at this priority (these drove the selected solution)
Frozen Prior Constraints
Constraints frozen immediately after the selected solution and which were introduced earlier
Physical Constraints
Non-policy constraints frozen immediately after the selected solution; typically physical constraints or variable definition constraints automatically added to the optimization problem by RiverWare
Information in the Frozen Constraints tabs corresponds to the currently selected solution in the Solution Information panel. If no solution is selected, the Frozen Constraints tabs will be blank. Also, if no constraints were frozen as a result of the selected solution, the Frozen Constraints Tabs will be blank. See Table 7.2 for details.
Note: Not all columns are included in all three tabs.
Column Name | Description |
|---|---|
Priority | Priority of the goal that added the constraint to the optimization problem |
Goal | Name of the goal that added the constraint to the optimization problem |
Constraint ID | The ID of the constraint, for example C4.1.2.2.1 45. The first number indicates the goal priority number and each subsequent number corresponding to a statement at each different level within the goal. The final number is the individual permutation of variables from a set of nested FOR loops. |
Object Var. | If the constraint is within a FOR statement, and if one of those statements contains an index variable of type Object, then this is the value of the outermost Object index. |
DateTime Var. | Similar to the Object Var. column but for DateTime variables |
Other Var. | The values of any FOR statement index variables not covered by the previous two columns |
Dual Price(Change in Objective Function/Change in RHS) | The change in the objective function value per unit change in the right-hand side of the constraint. The units given are the units of the objective per units of the right-hand-side (user units). |
Dual Price (raw) | The dual price value as reported by CPLEX |
Shrink to ID | The ID of the constraint to which this constraint is shrinking, if there is one (i.e. a constraint added earlier that differs only in a less restrictive right-hand-side value) |
Satisfaction | The percent satisfaction of the constraint |
• Clicking on any column header will sort the table by that column.
• Columns can be reordered by clicking and dragging on the column header.
• Right-clicking on a constraint row presents the Open Constraint’s Goal option. For constraints that were shrunk to another constraint (a value is present in the Shrink to ID column), there will also be the Open Shrink To Constraint’s Goal option.
Frozen Variables Tabs
The remaining two tabs present information about Frozen Variables:
• Frozen Slot Variables—Variables associated directly with slots frozen immediately after the selected solution (these limited its objective function, are at bounds)
• Frozen Non-Slot Variables—Variables not associated directly with a slot frozen immediately after the selected solution (these limited its objective function, are at bounds)
Information in the Frozen Variables tabs correspond to the currently selected solution in the Solution Information panel. If no solution is selected, the Frozen Variables tabs will be blank. Also, if no variables were frozen as a result of the selected solution, the Frozen Variables tabs will be blank. See Table 7.3 for details.
Column Name | Description |
|---|---|
Object | The object associated with the variable |
slot | The slot associated with the variable (just the slot name) |
Date/Time | The timestep associated with the variable |
Value | The value in the solution (in internal optimization units) |
Reduced Cost (Change in Objective Function/Change in Variable) | The change in the objective function if the variable changes by 1 unit. The units given are the units of the objective per unit of the variable (user units). |
Reduced Cost (raw) | The reduced cost value as reported by CPLEX |
• The Frozen Non-Slot Variable tab has a single Name column in place of the Object, Slot and Date/Time columns.
• Selecting any column header sorts the table by that column.
• Columns can be reordered by clicking and dragging on the column header.
Export as CSV
To export the information in the analysis tool to a comma separated values (CSV) file, select File, then Export Analysis (CSV). The following dialog opens, allowing you to configure the file output.
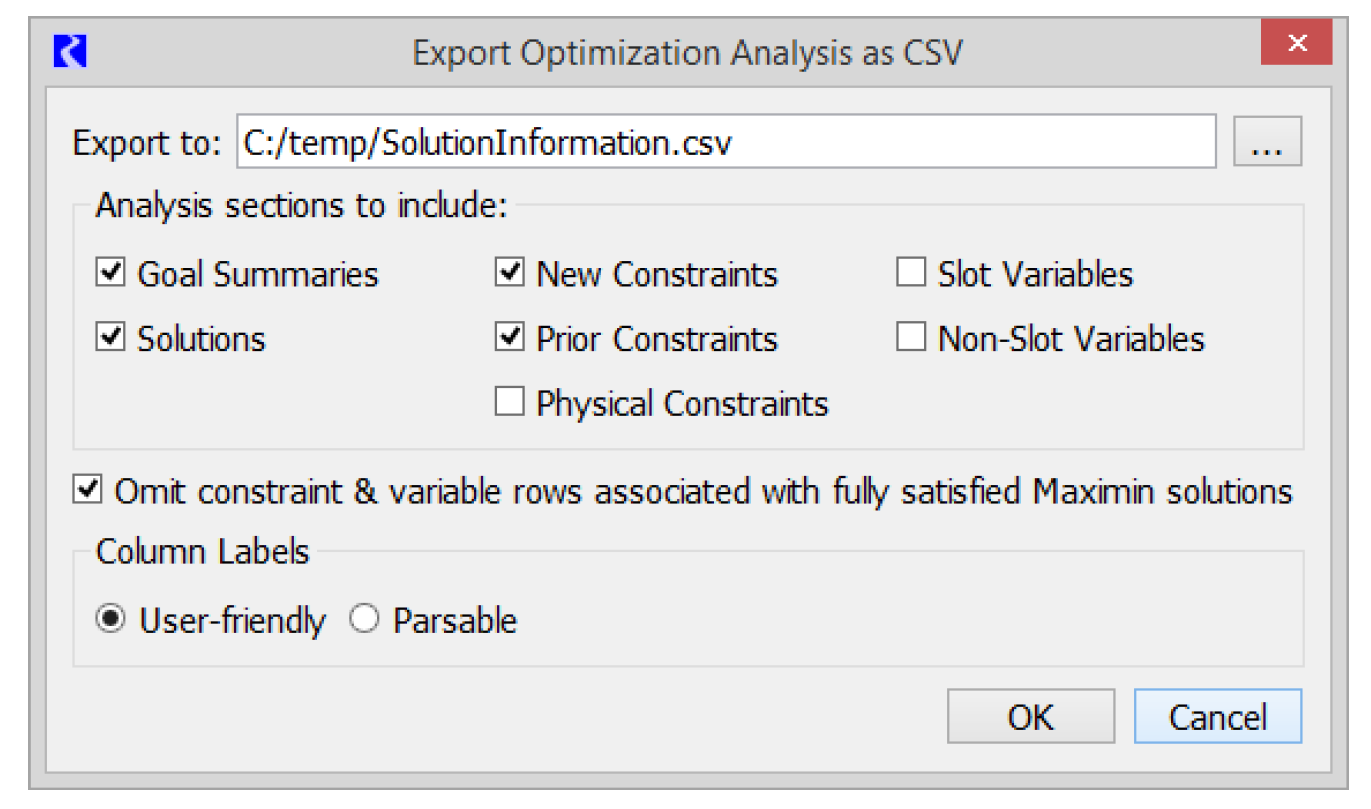
1. First, specify the file to use for export in the upper Export to: field.
2. Choose the Analysis sections to include. Each checkbox results in one or more rows for each optimization goal priority in the file.
The columns of the CSV file correspond to the columns shown in the analysis tool, presented in the tables above.
3. Specify whether to Omit constraint & variable rows associated with fully satisfied Maximin solutions. When checked, rows representing a fully satisfied solution are omitted.
4. For the column labels, choose one of the following options:
– User-friendly with spaces between words
– Parsable where all spaces are removed.
5. Select OK to generate the CSV file or Cancel to close without creating the file.
Revised: 07/05/2022