
Edit and Run Scenarios
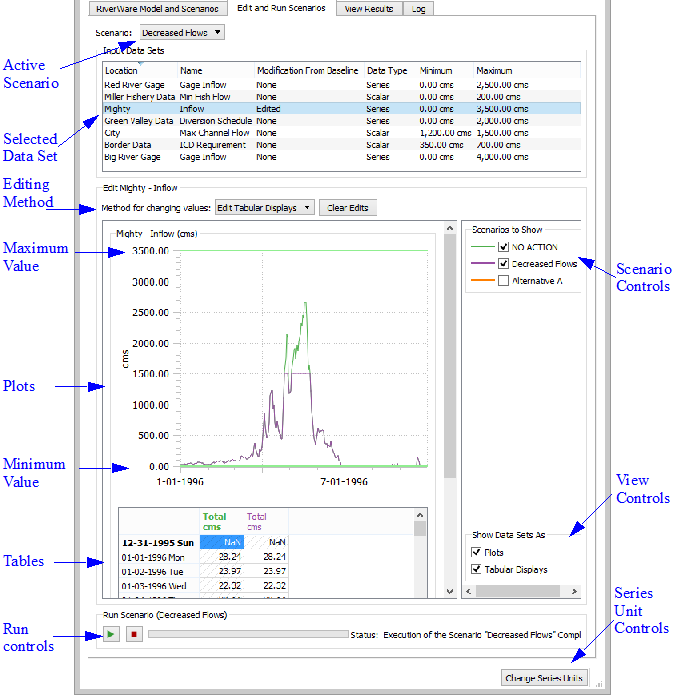
To edit input data and run the scenarios, select the Edit and Run Scenarios tab. As shown in Figure 1.2, you can activate a scenario, view and change the input data, compare the inputs with the inputs of other scenarios, and execute a simulation of the scenario to compute the results for the modified inputs.
To select the active scenario—the non-baseline scenario you wish to edit and simulate—select the Scenario button from the menu, then select the desired scenario from the list. You can create new scenarios on the Scenarios panel on the lower portion of the RiverWare Model and Scenarios tab.
Figure 1.2 Edit and Run Scenarios tab
Select Data Sets to Modify
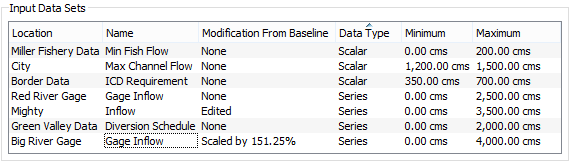
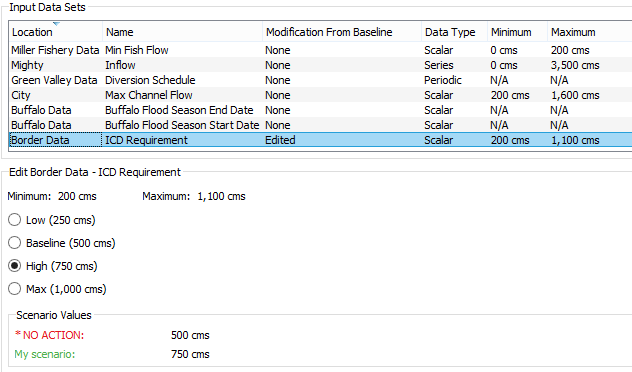
The Input Data Sets panel lists the active scenario's input data that can be modified from the baseline run. The columns of the list provide the following information for each data set:
• Location. Basin location of the data.
• Name. Name of the modeled quantity; it can be physical data (for example, “Inflow”) or water accounting data (for example, “Storage in the M&N Account”).
• Modification from Baseline. Indicates whether the data in the data set for the selected scenario differs from the data in the baseline. “None” indicates that no modification from the baseline values has been made; “Edited” indicates that one or more values have been changed.
• Data Type. Form of the numeric data associated with the data set. There are the following options:
– Series: Time series of values
– Table: Matrix of values
– Periodic: A matrix of repeating values. Each row represents a date.
– Scalar: Single value
• Minimum and Maximum. Minimum and maximum values permitted for the data set. These are optionally established by the developer for Scalar and Series data.
Note: All scenarios contain the same list of Input Data Sets. Values in those data sets may vary between scenarios. These variables are a subset of the models input, selected by the developer, and common to all scenarios for a given WISE file.
Tip: Series data units, including the Minimum and Maximum, can be modified to show Flows as Volumes over the timestep and vice-versa, as described in Series Units.
Modify a Data Set
To change the values for one or more input data sets, select the data from the Input Data Sets list. Then, controls for modifying values are displayed below the Input Data Sets list. These controls vary according to the data type, Series, Scalar or Tables, or sometimes the units of the data.
Note: You can edit multiple series data sets at once using scaling and offsets as described inModify Series Data. You can only edit scalar values or tables one at a time.
The edit panel displays values for all displayed scenarios to allow comparison of input values, but only the values for the currently active scenario can be changed. On the Scenarios to Show panel to the right of the data display, select which scenarios’ data to display and the display color associated with each.
Modify Series Data
When one or more series data sets is selected in the Input Data Sets list, the edit controls consist of a plot and a table of values. The plot shows the data associated with the data set, with each scenario’s data plotted using its color.
Note: You can edit multiple series data sets at once as long as each series has minimum and maximum values specified by the developer. If these bounds were not specified, then you can only edit one data set at a time.
Either the plot or the table can be hidden by clearing the appropriate checkbox to the lower right of the panel. See Plot Controls for details on plotting.
The table of values has one row for each date in the series, listed on the left, and one column for each scenario. The columns have a label (may be created by model developer) and the units of the values. (The color of the label corresponds to the color of the scenario associated with that column).
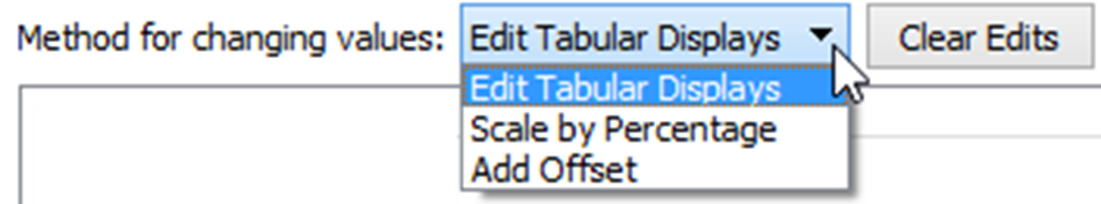
There are three methods to edit the selected series data sets:
Use the Clear Edits button to revert any changes back to the baseline data
Note: When switching between methods, the data is always reset to the baseline data.
The display units for series data can be modified to show Flows as Volumes over the timestep and vice-versa, as described in Series Units. You can modify the input series data in either display unit.
Edit Tabular Display
When in the Edit Tabular Displays mode, you must enter the values for the desired input data. You can either type in the new values or copy and paste them. To enter a value into one or more cells of the table, first select the cells you would like to change, type in the number, and then press Return.
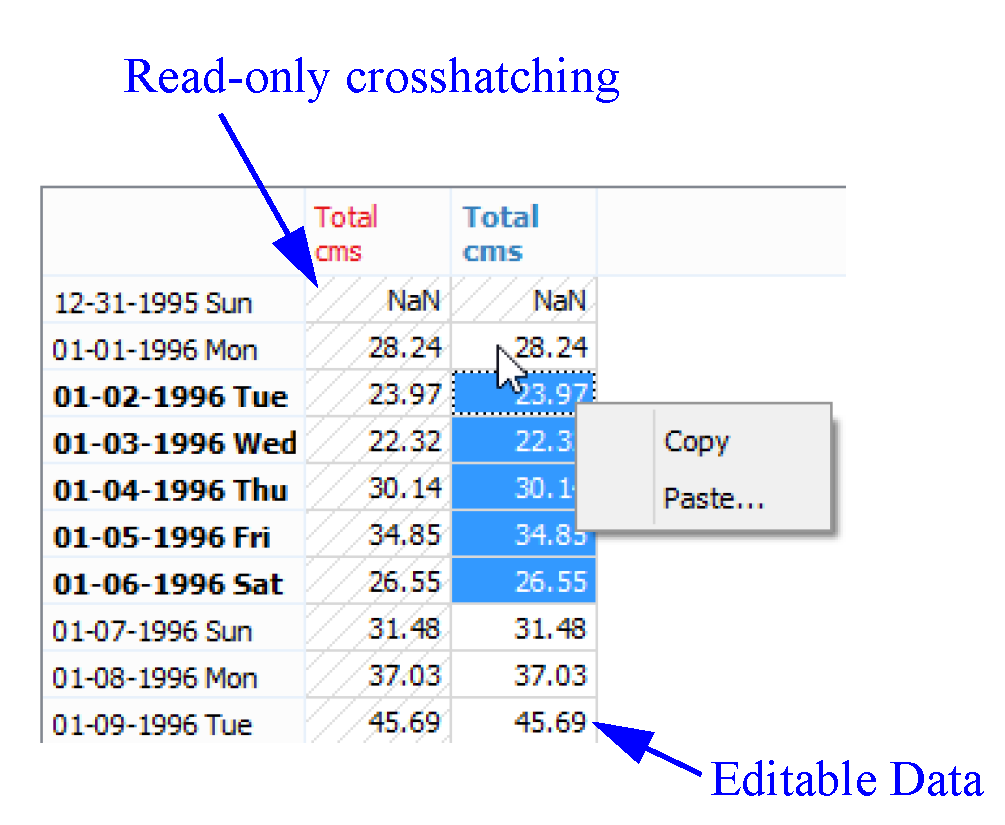
Only values for the active scenario can be edited, and of those, only those that were provided as inputs to the original RiverWare model run can be edited. That is, if the series value for a particular date was computed by RiverWare and not originally input by the model developer, then it is not editable. Non-editable values show cross-hatching and cannot be changed.
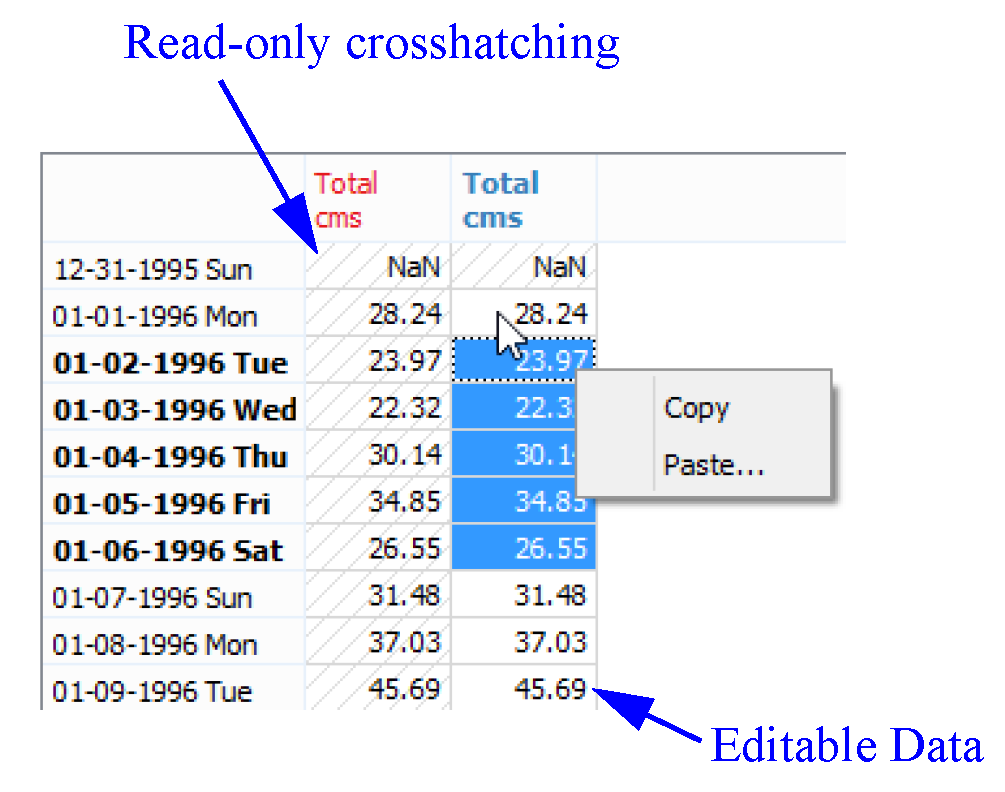
Note: As shown in the above screenshot, values may display as “NaN”, which means “Not a Number”. This is the RiverWare convention for an empty or invalid value, typically one that has not yet been set.
See Edit Operations and Copy To and From Excel for instructions on how to enter values into multiple cells, and how to copy and paste to and from other applications, such as Excel.
Scale by Percentage
When in the Scale by Percentage mode, you can use the scale edit box and/or the slider to set the percentage to scale all input values in the series data sets. The screenshot shows a sample scaled data set.
Figure 1.3 Screenshot showing a dataset that is scaled by a percentage
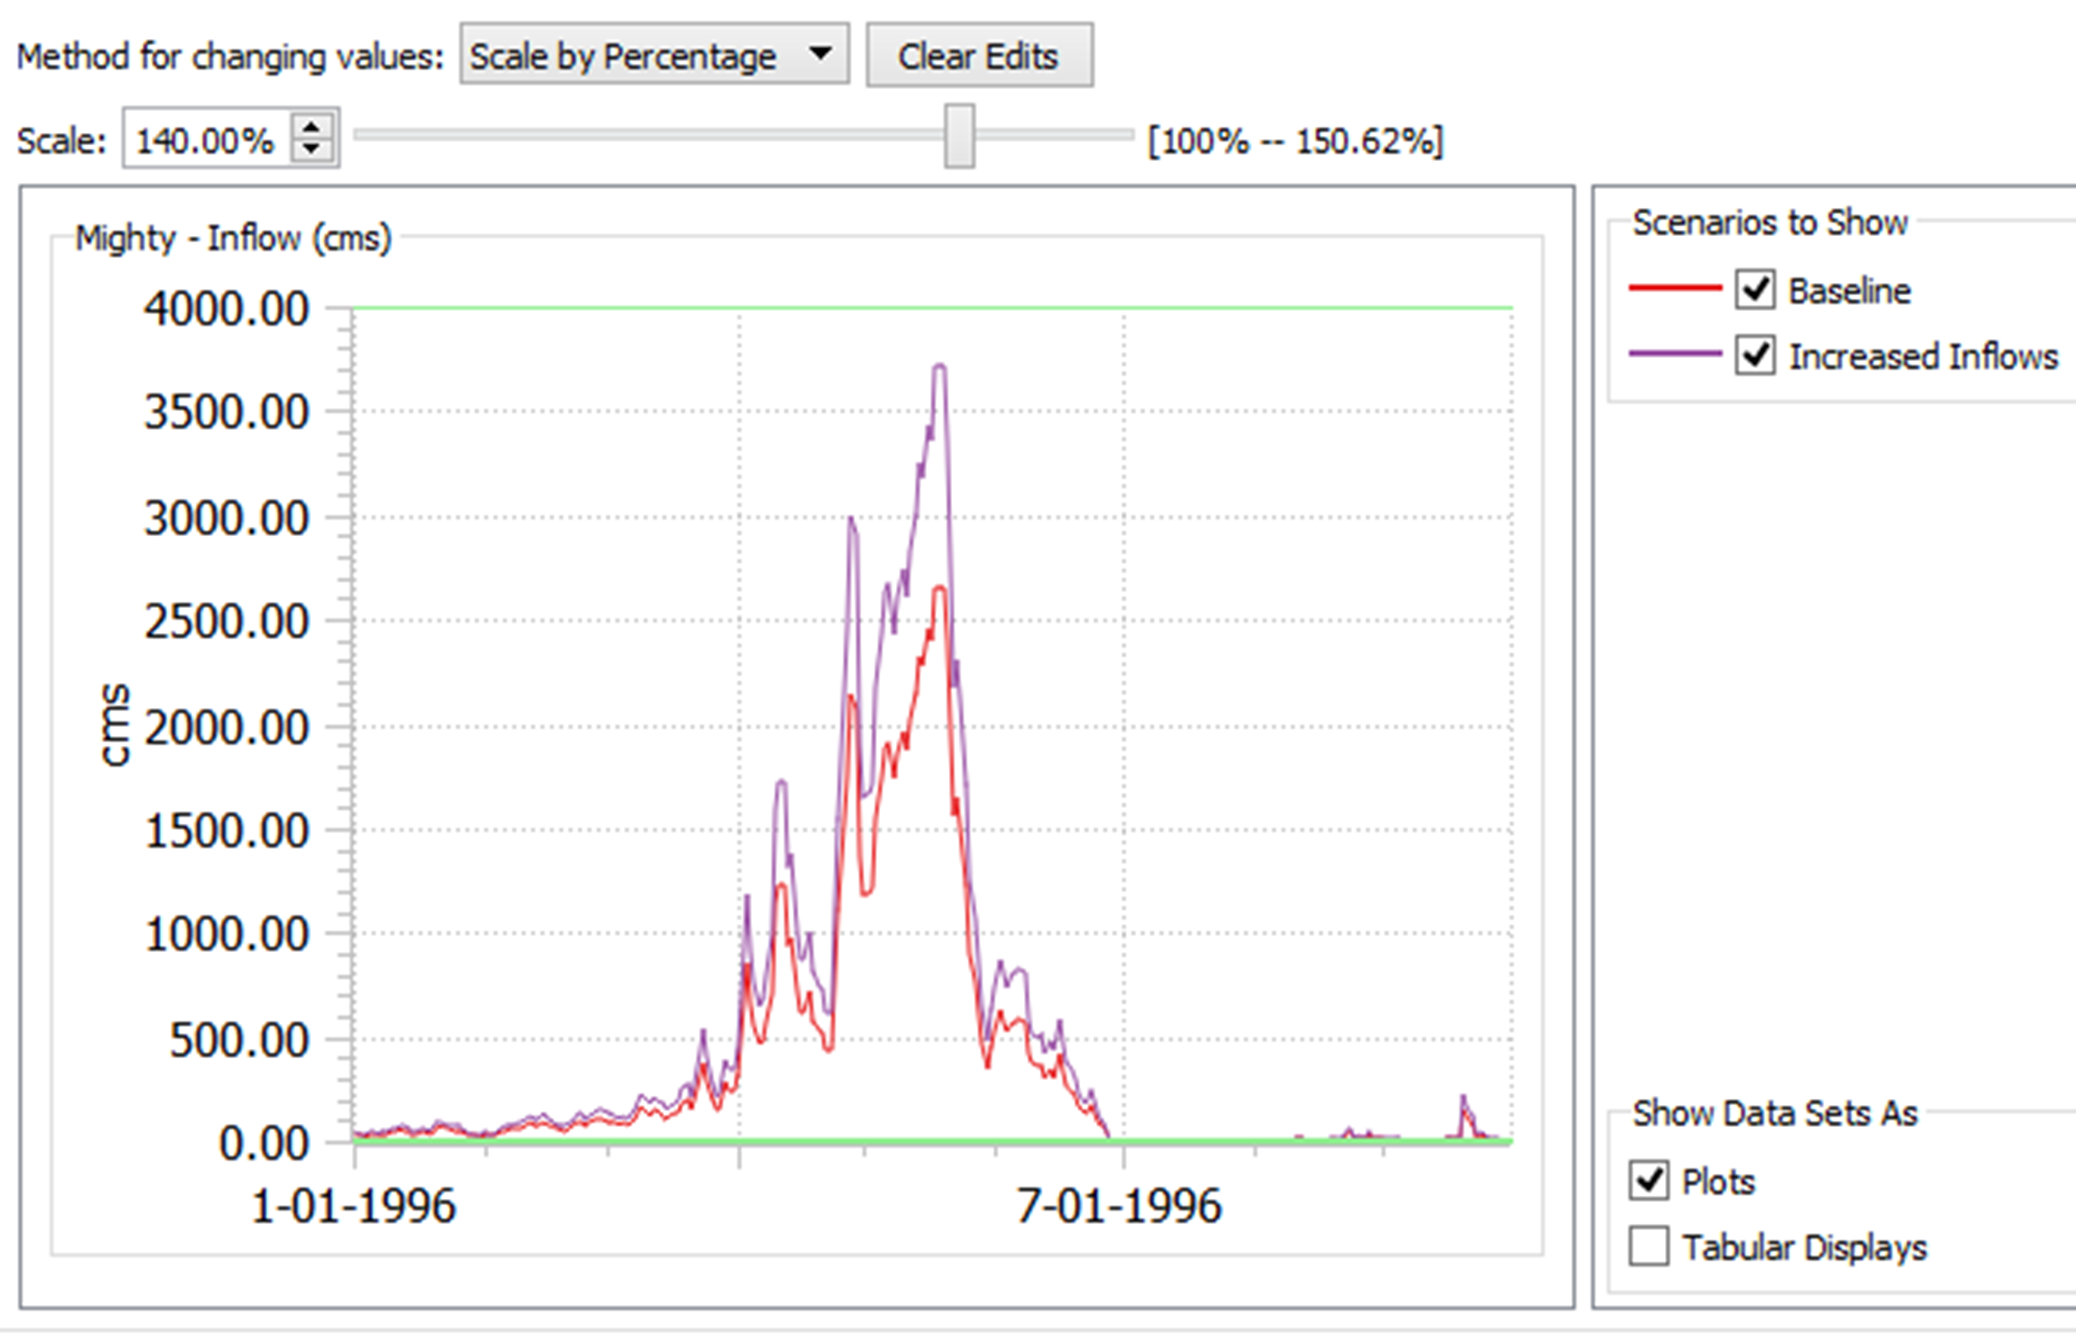
Note: The limits of the slider and the edit box use the Minimum and Maximum values for all data sets. Therefore, the maximum scale will be such that one data point reaches the maximum value at some point in the time series. Other data sets may not scale to the full range but you could specify their scale by editing them individually.
Add Offset
When in the Add Offset mode, you can type in an offset and/or move the slider to set the offset that will be added to all input values in the series data. All datasets must have the same unit type to add an offset.
Figure 1.4 Screenshot showing a dataset that is offset by a value
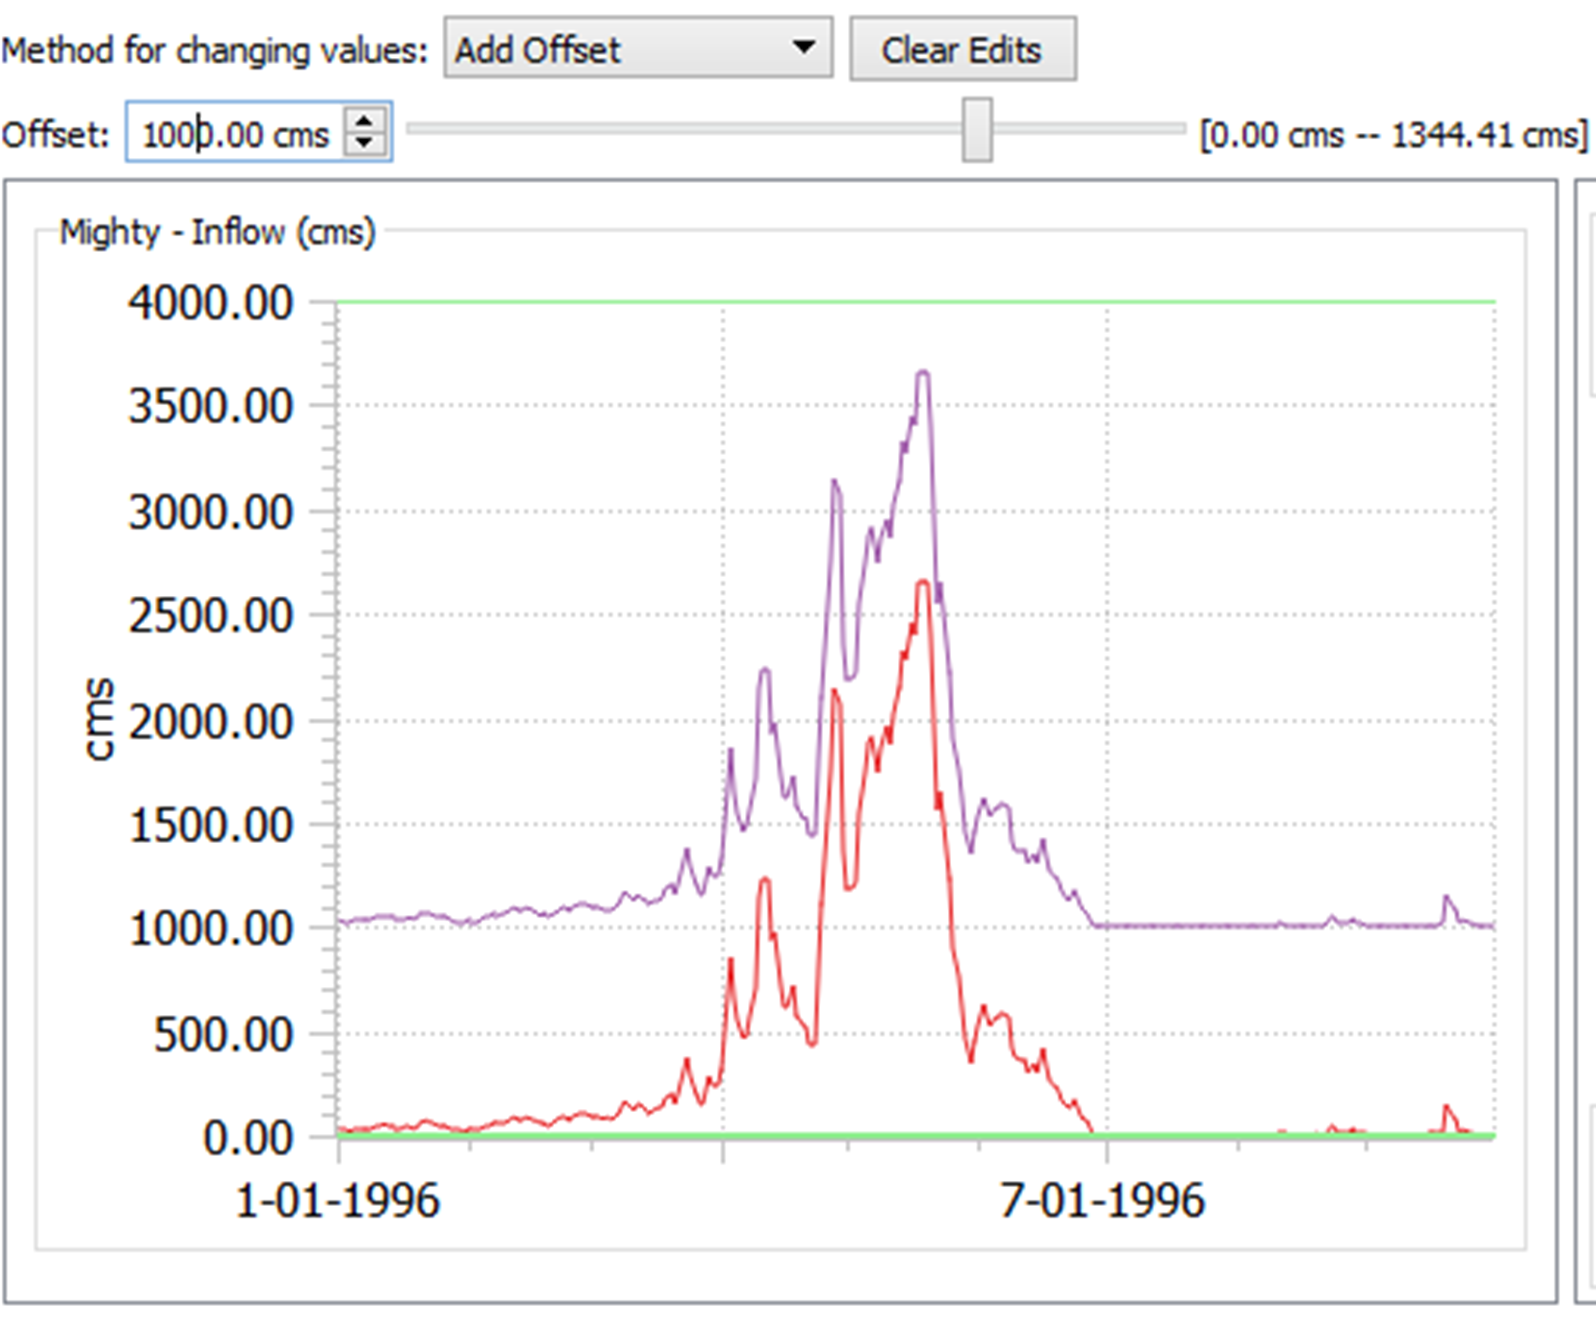
Note: The limits of the slider and the edit box are found by taking the minimum and maximum values for all data sets. Therefore, the maximum offset will be such that one data point reaches the maximum value at some point in the time series. Therefore, other data sets may not reach their maximum or minimum values.
Modify Table Data
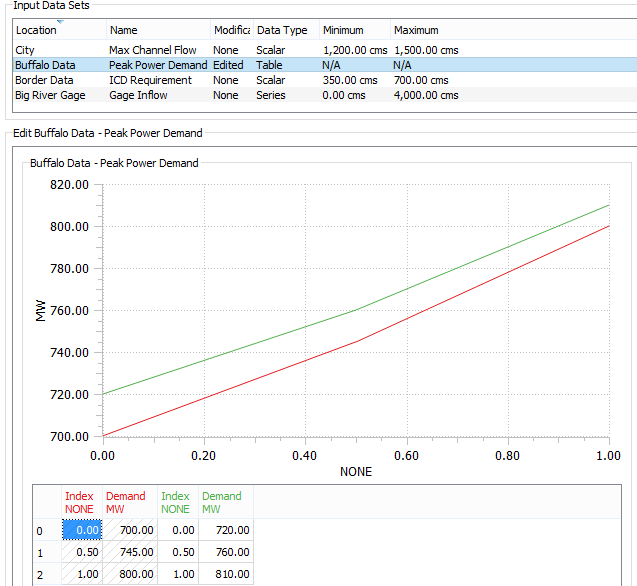
When a table data set is selected, the edit panel displays a table of values. The rows are indexed and may also have a text label. The color-coded columns, one for each scenario, show units and possibly a title. Only values in columns associated with the active scenario can be edited.
Note: Two-column tables also show a plot, when possible. Other tables only show only data.
See Edit Operations and Copy To and From Excel for instructions on how to change values in multiple cells, and how to copy and paste to and from other applications, such as Excel.
Modify a Scalar Data Set
When a scalar data set is selected, the edit panel displays an editable value, a slider, or a set of radio buttons.
To change the value either enter a new value into the Value box or drag the slider to the desired value. The Minimum and Maximum values configured by the Model Developer are also shown. They define the limits of the slider.
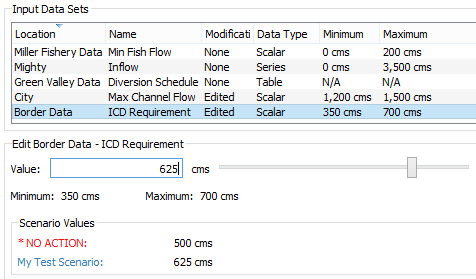
If radio buttons were configured by the Model Developer, they are shown in the Edit panel. Choose from the defined discreet options; a sample is shown.
Modify Date & Time Values
In addition to editing numeric values, that is, a number with or without units, in some cases, developers may export series, table, or scalar values that represent date and time values. When these date and time values have been exported, the edit panel of the “Edit and Run Scenarios” tab presents controls for specifying a date & time value.
Note: The only method available for editing Series data sets that include date/time values is “Edit Tabular Displays.”
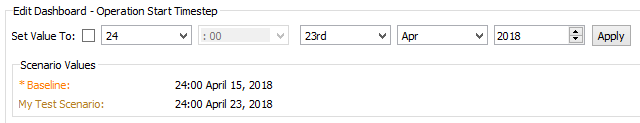
Direct editing of values is not supported, so use the controls to specify the date and times based on the type of values presented. Some controls allow you to break out the date into its components. Use either approach and then apply the changes to the selected values.
Figure 1.5 Editing Controls for to specify a full Date & Time
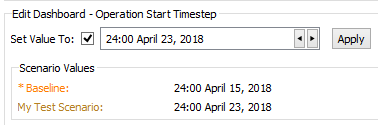
Figure 1.6 Editing Controls to specify components of a Date & Time
Tip: Copy and Paste works on date & time values, but the values copied are encoded numbers used internally. The integer part is the number of seconds since the beginning of 1800 (or, as RiverWare presents this, December 31, 1799, 24:00). For full date and times, the fractional part is zero. Otherwise, the fractional part encodes which partial date time information is relevant. Use these values with caution.
Edit Operations and Copy To and From Excel
Values that are read-only are displayed with a light gray crosshatching.
Note: Only one tab supports editing of values, the Edit and Run Scenarios tab.
To enter a value into one or more cells of the table, first select the cells you would like to change, type in the number, and then press Enter. You can also select one or more cells and copy and paste from or to another application, such as Excel.
The following is a common workflow involving Excel.
1. Highlight a range of cells.
2. Right-click and select Copy.
3. In Excel, paste the data into a range of cells.
4. Edit the data in Excel using formulas and other techniques.
5. Copy the desired cells in Excel.
6. In the RiverWISE Edit and Run Scenarios tab, highlight a range of cells and right-click.
7. Select Paste to bring in the data.
Copy data to Excel or other application. To display or analyze simulation results in Excel or other tools, copy data from RiverWISE and paste it into another application.
Use the following steps in the RiverWISE Edit and Run Scenarios or View Results tab.
1. Highlight a range of cells or entire columns of data.
2. Right-click and select Copy.
3. In Excel or other application, paste the data into a range of cells.
Paste data from Excel or other application. To import data from other tools, copy the data and paste it into the Edit and Run Scenarios tab in RiverWISE.
1. In Excel, highlight a range of cells, such as a column of data.
2. Right-click and select Copy.
3. In the RiverWISE Edit and Run Scenarios tab, highlight the desired cells. Only the currently selected scenario is editable and will not have cross-hatching.
4. Right-click and select Paste.
Execute a Scenario
After modifying input values, execute the scenario to generate the new results. Select the Run button  at the bottom of the panel. The bar to the right indicates the progress of the simulation, and the Status label reports the state of the simulation.
at the bottom of the panel. The bar to the right indicates the progress of the simulation, and the Status label reports the state of the simulation.
Note: Scenario execution can vary from seconds to hours, depending on many factors including the size of the basin, the number of time steps in the simulation, and the machine on which RiverWISE is running.
To stop a simulation select the Stop button  . The simulation will be halted when it reaches a point that is the next valid stopping state.
. The simulation will be halted when it reaches a point that is the next valid stopping state.If a scenario execution quits unexpectedly, you can try changing the input data. Otherwise, contact the model developer with the data that resulted in the aborted run. RiverWISE is not intended for debugging errors or fixing modeling issues, only for conducting runs and showing comparison results. The model developer can analyze the issue and advise a solution, either modified data or generation of an entirely new WISE file.
As a Stakeholder, you can communicate the issue to the Model Developer using any of the following methods:
• Export the Log messages or entire text information. See Log Diagnostic Messages for details.
• Export the scenario that you created, using the File, then Export Scenarios. See File Menu for details.
You can then provide this file to the Model Developer for further debugging.
Model Developers can also export a RiverWare model file that represents the current state of the system.
Revised: 06/04/2022