
Performance Analysis Tools
The first step in improving performance is typically information collection. This section describes a number of tools and approaches used to diagnose performance problems, including both tools within RiverWare as well as external utilities. The following topics are discussed:
Topics
RPL Analysis
In simulations that use RPL sets (e.g., RBS ruleset, optimization goal sets, expression slot set, initialization rules set, user defined accounting method set, iterative MRM ruleset or global functions set), the RPL Set Analysis tool can be used to identify functions that execute an inordinate number of times or spend a lot of time in their execution. See RPL Analysis Tool for details.
RPL Timing and Count Predefined Functions
The following RPL predefined functions measure performance:
• RunTime() returns the number of seconds which have elapsed since the run began. See RunTime in RiverWare Policy Language (RPL) for details.
• DispatchTime() Returns the accumulated time spent executing object dispatch methods since the beginning of the current run. See DispatchTime in RiverWare Policy Language (RPL) for details.
• DispatchCount() returns the number of object dispatch method executions that have occurred since the beginning of the current run. See DispatchCount in RiverWare Policy Language (RPL) for details.
Note: More specific dispatch times and counts are also available in the RPL Set Analysis tool; see RPL Analysis Tool.
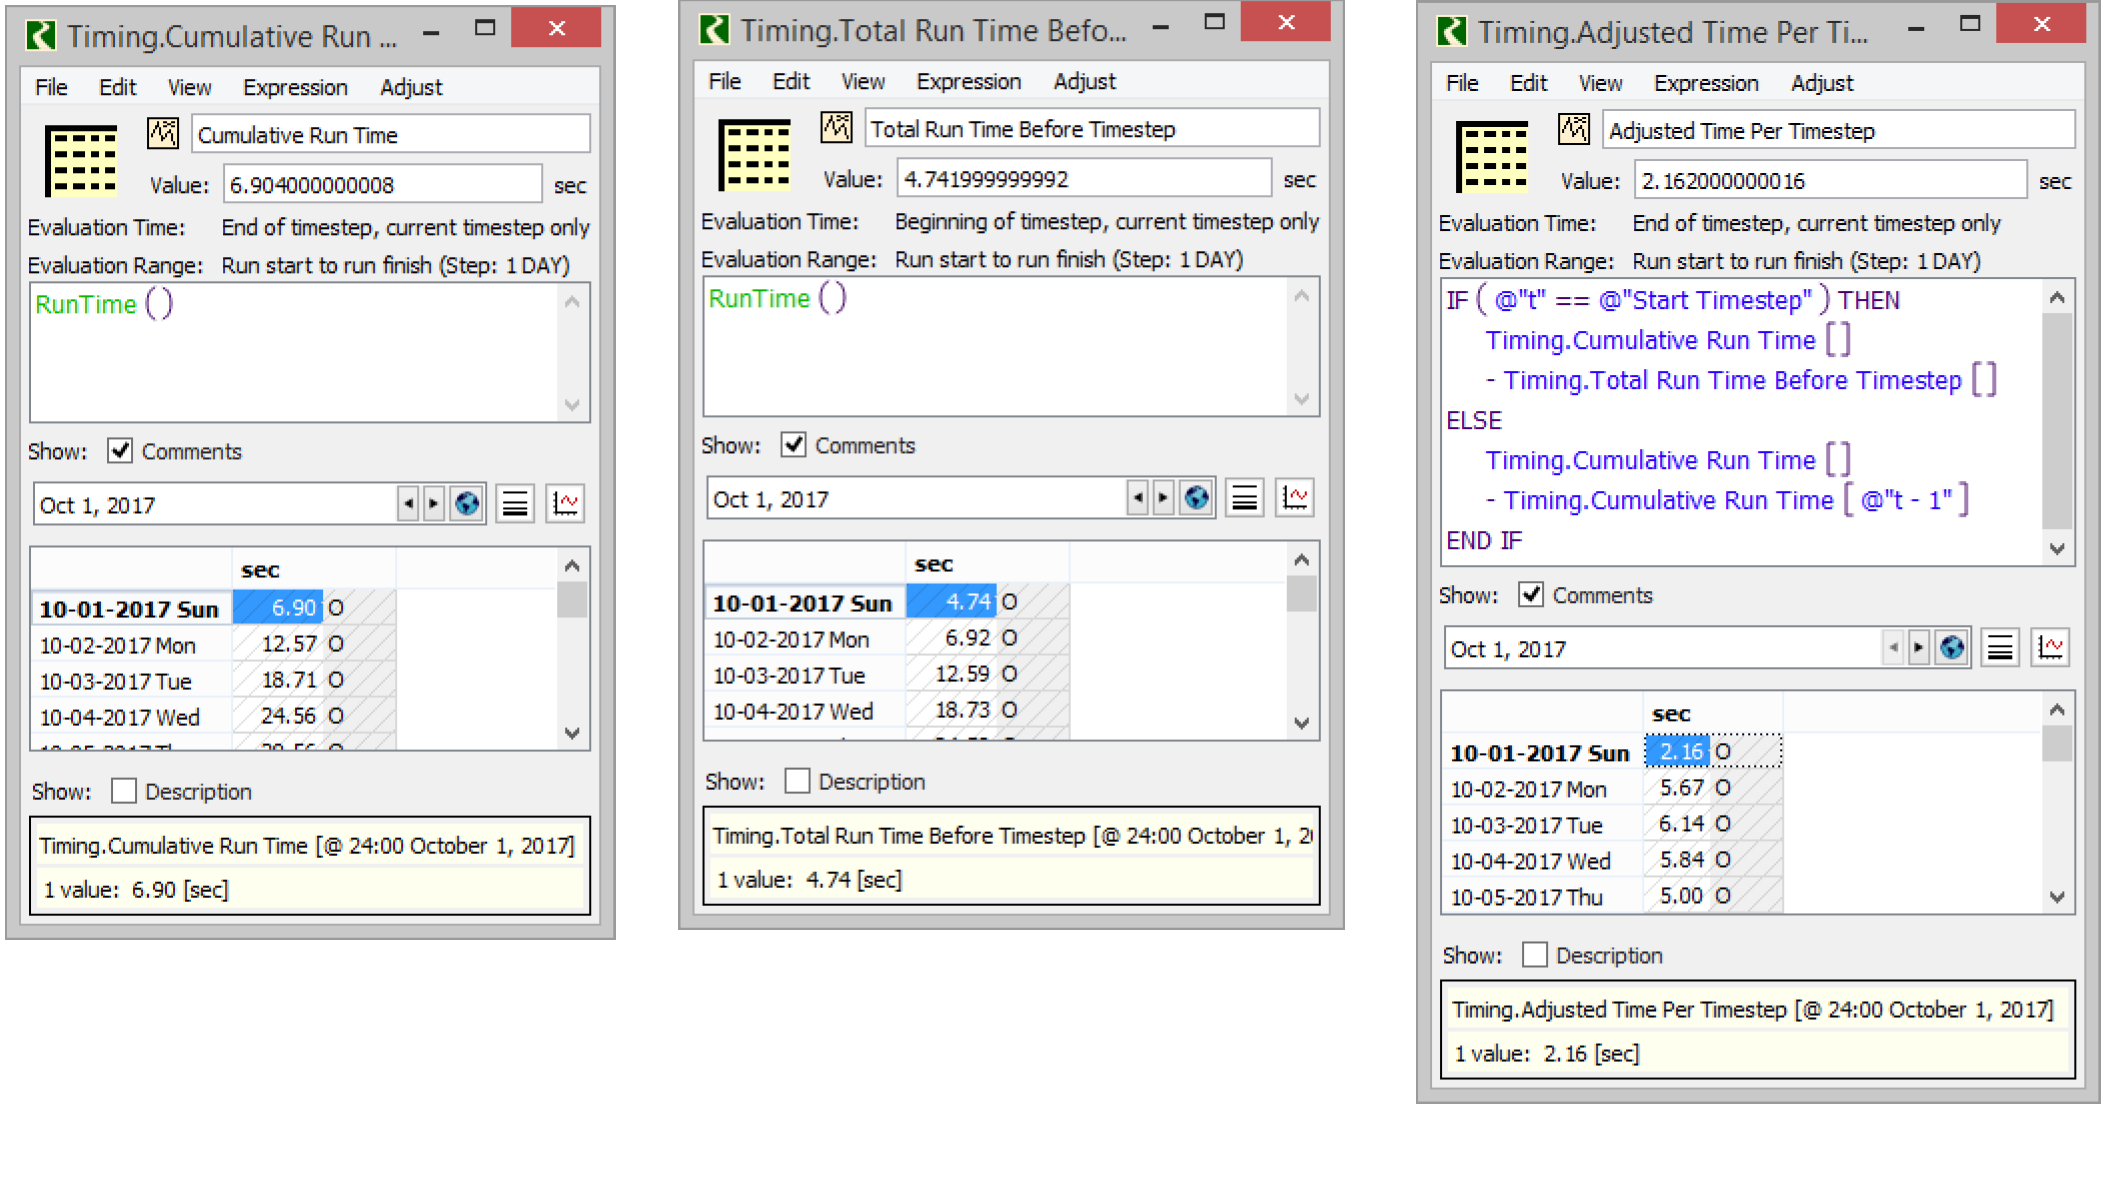
Using expression slots or rules, these function can be used to record the performance. Following is a series of expression slots that record the cumulative number of seconds that have elapsed since the beginning of the run or determine the number of seconds each timestep takes. This can be used to determine if a particular operation is taking more time than expected. For example, does a timestep that has a flood control operation take significantly longer than a non-flood control timestep?
Figure 1.1 presents an example of Expression Slots showing how the RunTime function can be used. The left and right functions are configured to evaluate at “end of Timestep, current timestep only”. The center function is configured to evaluate at “Beginning of Timestep, current timestep only”. Together, these give the “Time per timestep” shown in the expression on the right.
Figure 1.1
Windows Task Manager
The Task Manager is accessed by right-clicking the toolbar and selecting Task Manager. The Task Manager has two tabs that record performance information. The Performance tab displays a number of useful items as shown in Figure 1.2 and Figure 1.3.
• Total CPU usage
• Number of processors on this machine and a plot of their usages
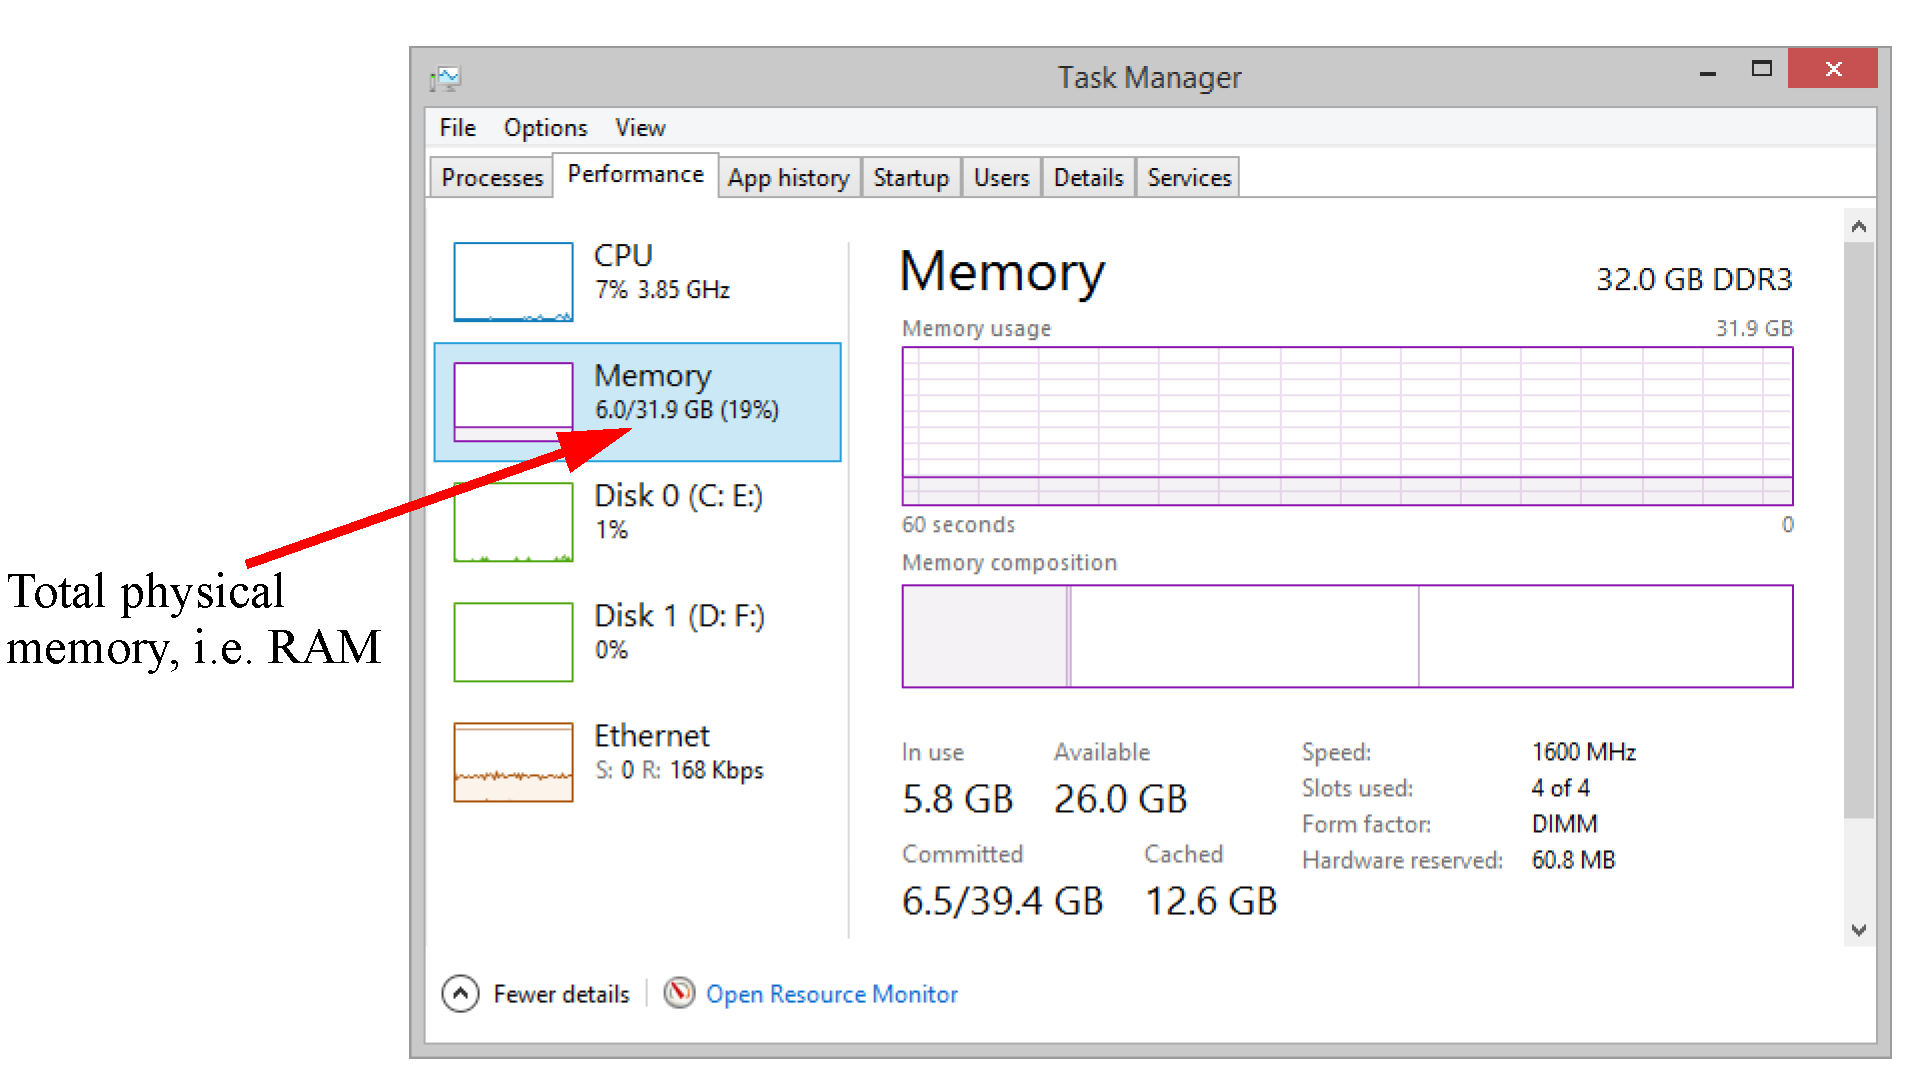
• Total physical memory (RAM) on the machine. In Figure 1.3, it is approximately 32 GB of RAM.
The Processes tab displays the percentage of CPU and memory used for each process.
We will refer to this utility in future sections. When using this utility to assess the performance of a RiverWare model, make sure that other large processes are not running.
Figure 1.2 Task Manager CPU view
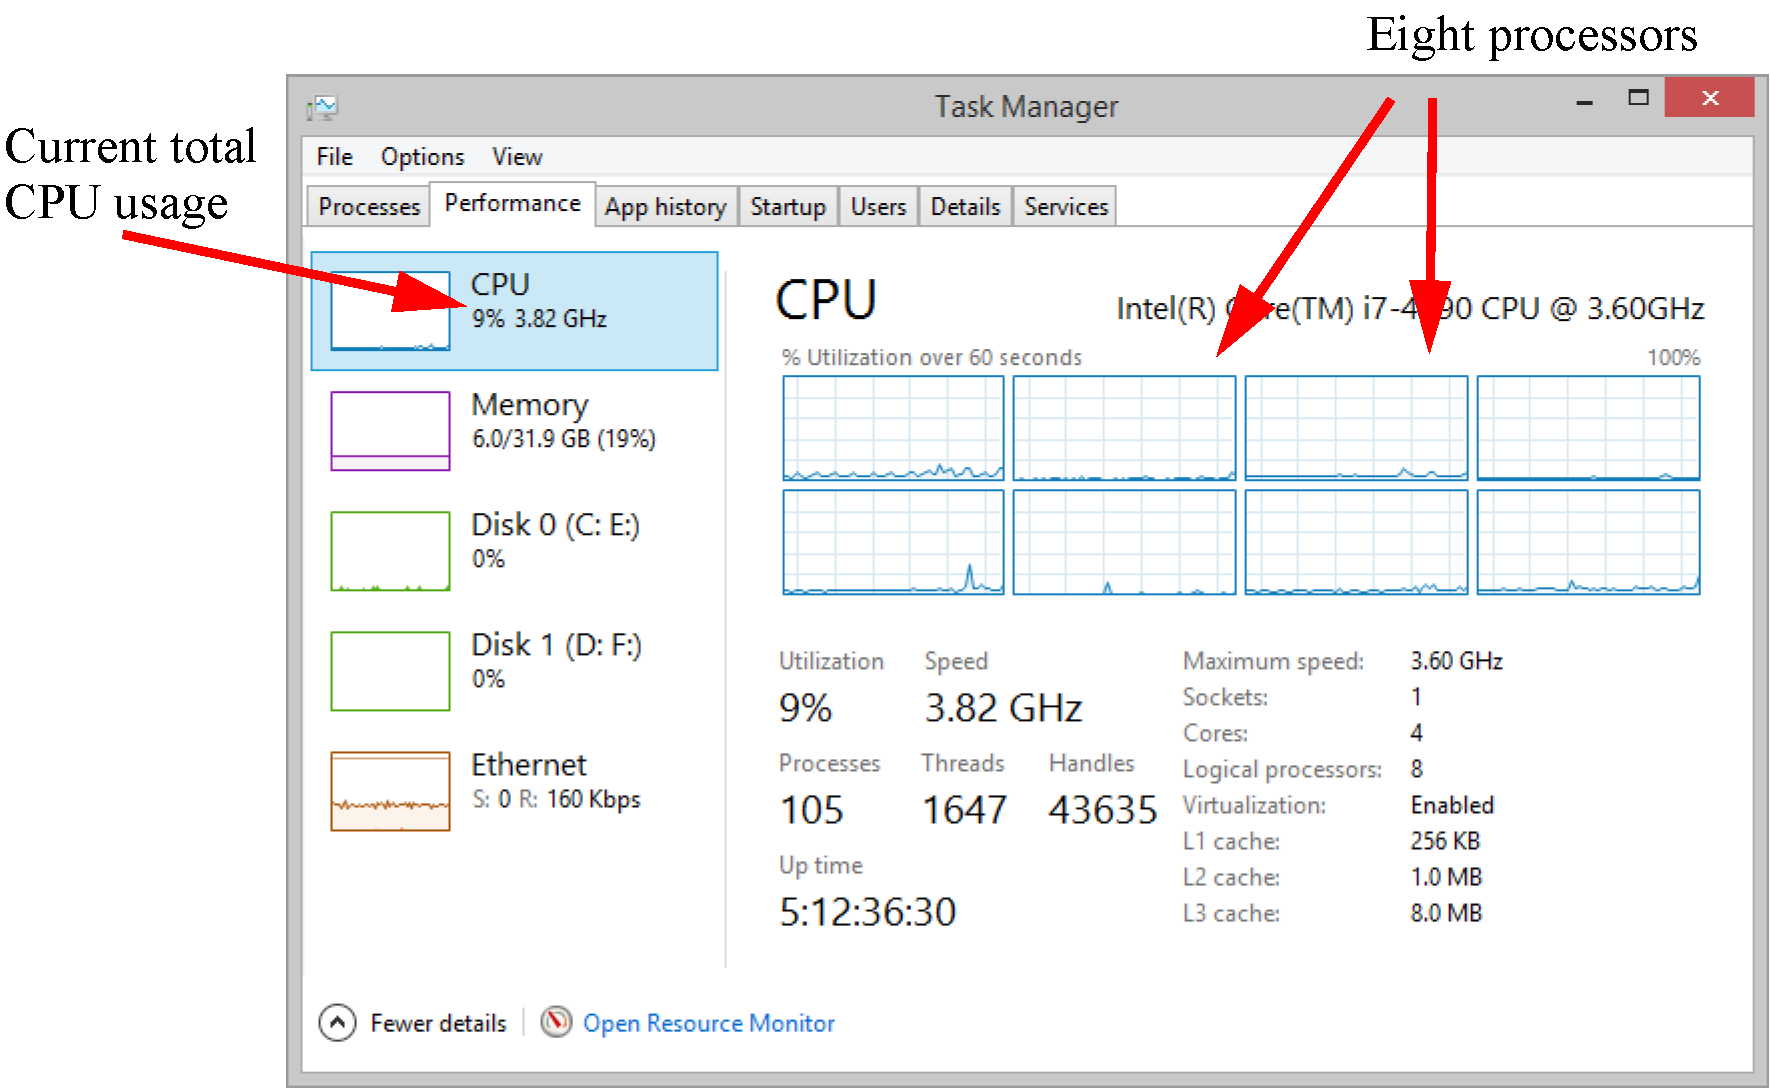
Figure 1.3 Task Manager Memory view
Windows perfmon Utility
In Windows, there is a performance monitoring utility called perfmon. This tool can be used to determine how processes including RiverWare are using memory. When using this utility to assess the performance of a RiverWare model, make sure that other processes are not running.
Use one of the following methods to start perfmon:
• Select Start, then All Programs, then Command Prompt and enter perfmon.
• Select Start, then Run, then enter perfmon.
The perfmon utility displays counters of variables. The following instructions are provided to show you how to use perfmon for simple analysis. This document is not comprehensive; use the perfmon Help for more information.
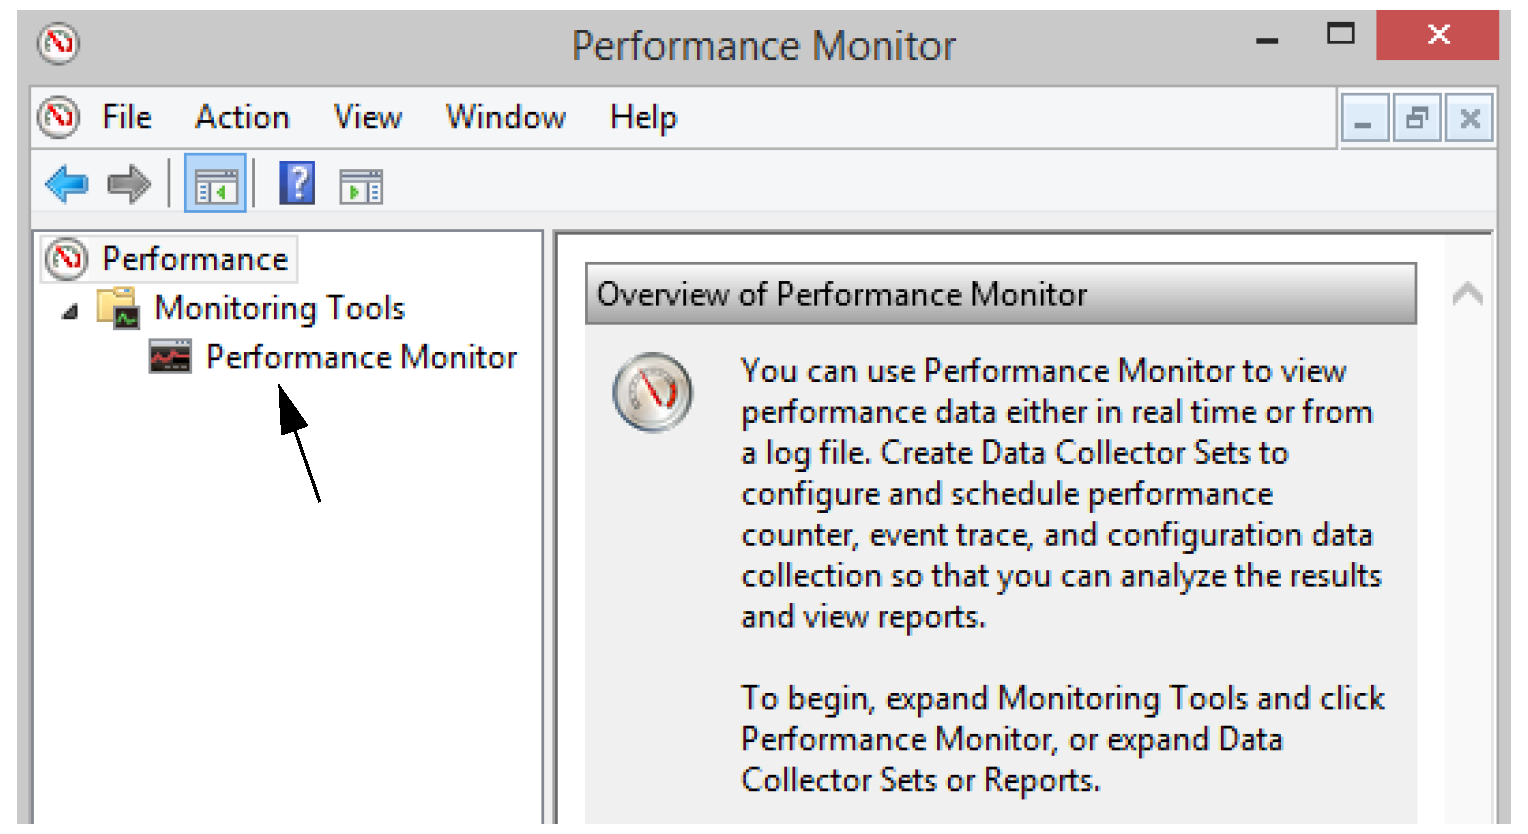
When you first start perfmon, a graph of the selected or default counters is provided, as shown in Figure 1.4. Select Performance Monitoring.
Figure 1.4 perfmon default view
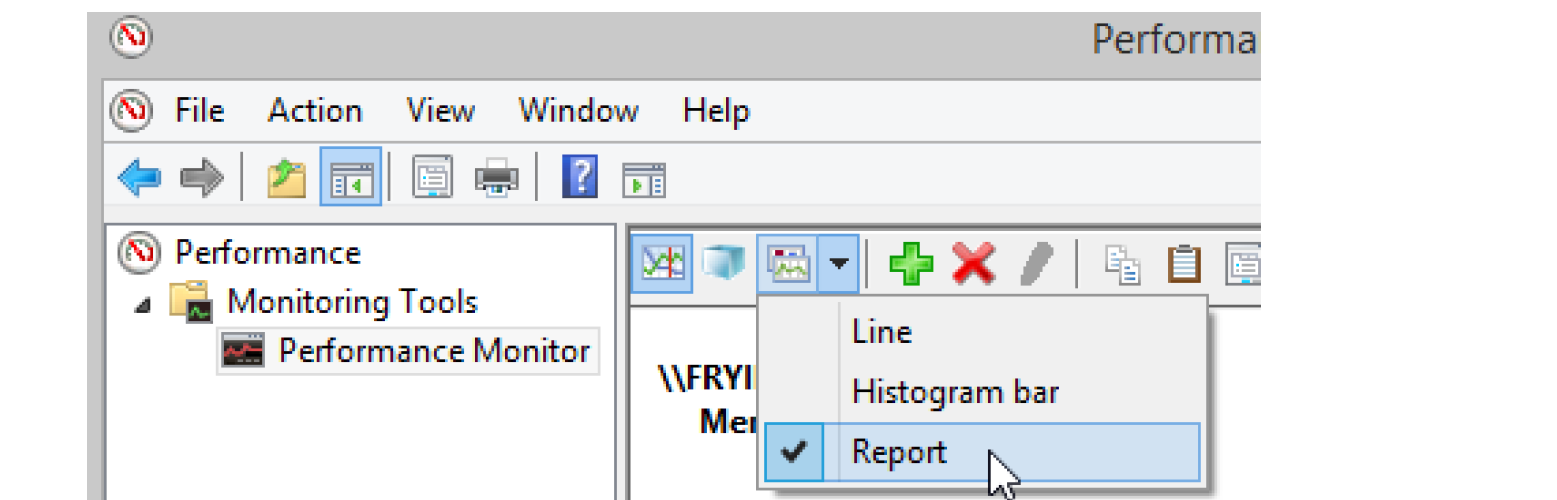
The most useful view is the Reports view. Select the Reports icon to switch views. Figure 1.5 shows the Reports view.
Figure 1.5 perfmon Reports view
There may be counters defined. To add counters, select the Plus icon to open the Add Counters dialog. Figure 1.6 illustrates.
to open the Add Counters dialog. Figure 1.6 illustrates.Use the following steps in the Add Counters dialog:
1. Select a Performance Object and expand the list.
2. Highlight the counter from the list.
3. Select the instance, i.e. riverware.
4. Select Add.
5. Repeat for other counters.
6. Select OK when finished.
Figure 1.6 perfmon Add Counters dialog
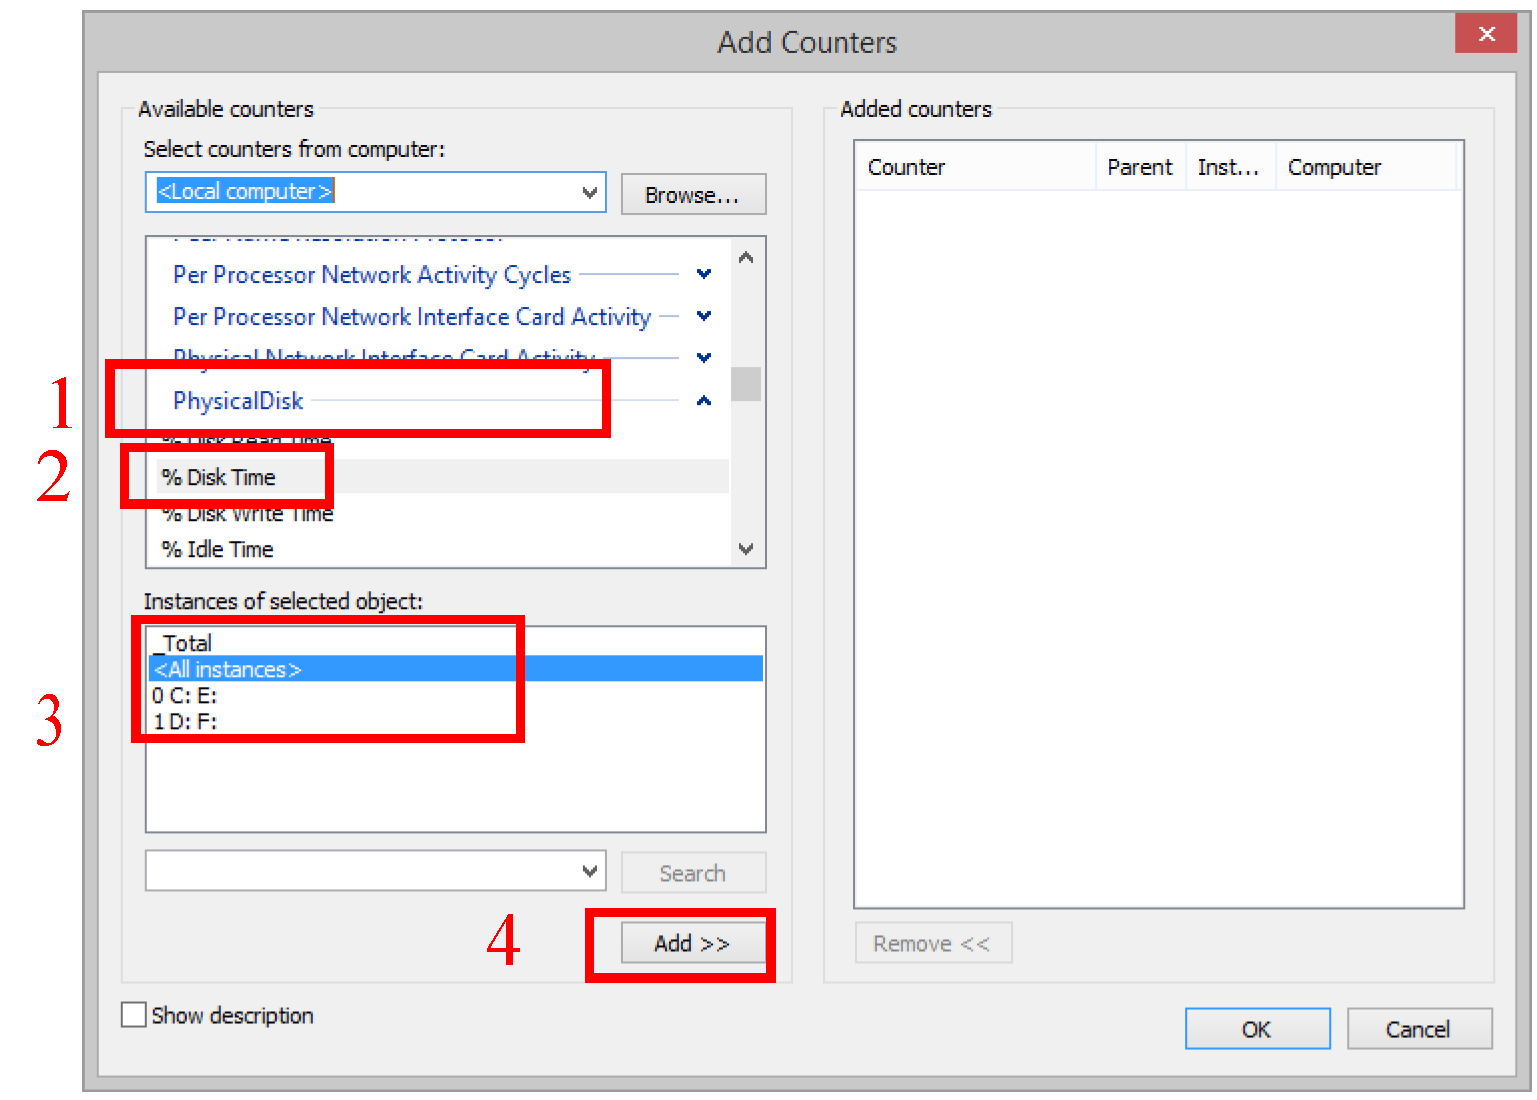
Table 1.1 describes the most useful counters.
Performance Object | Counter | Instance | Description |
|---|---|---|---|
Memory | Pages/Sec | NA | Hard Page Faults per second |
Physical Disk | % Disk Time | Disk that contains the paging file | Percentage of time the selected disk is reading or writing. |
Process | Virtual Bytes | _Total | Total size of all process |
Process | Virtual Bytes | riverware | Total size of the RiverWare process |
Process | Working Set | _Total | Size of memory that was recently touched by all processes |
Process | Working Set | riverware | Size of memory that was recently touched by RiverWare |
Note: For more information or a description of any of these counters, highlight the counter in the Add Counter dialog and click Show Description. Once the perfmon tool is configured, it can be saved as a .msc file and reloaded as necessary.
Now that we have tools to collect performance information, we present recommendations for acting on this information to improve performance.
Revised: 06/04/2022