
Viewing Results
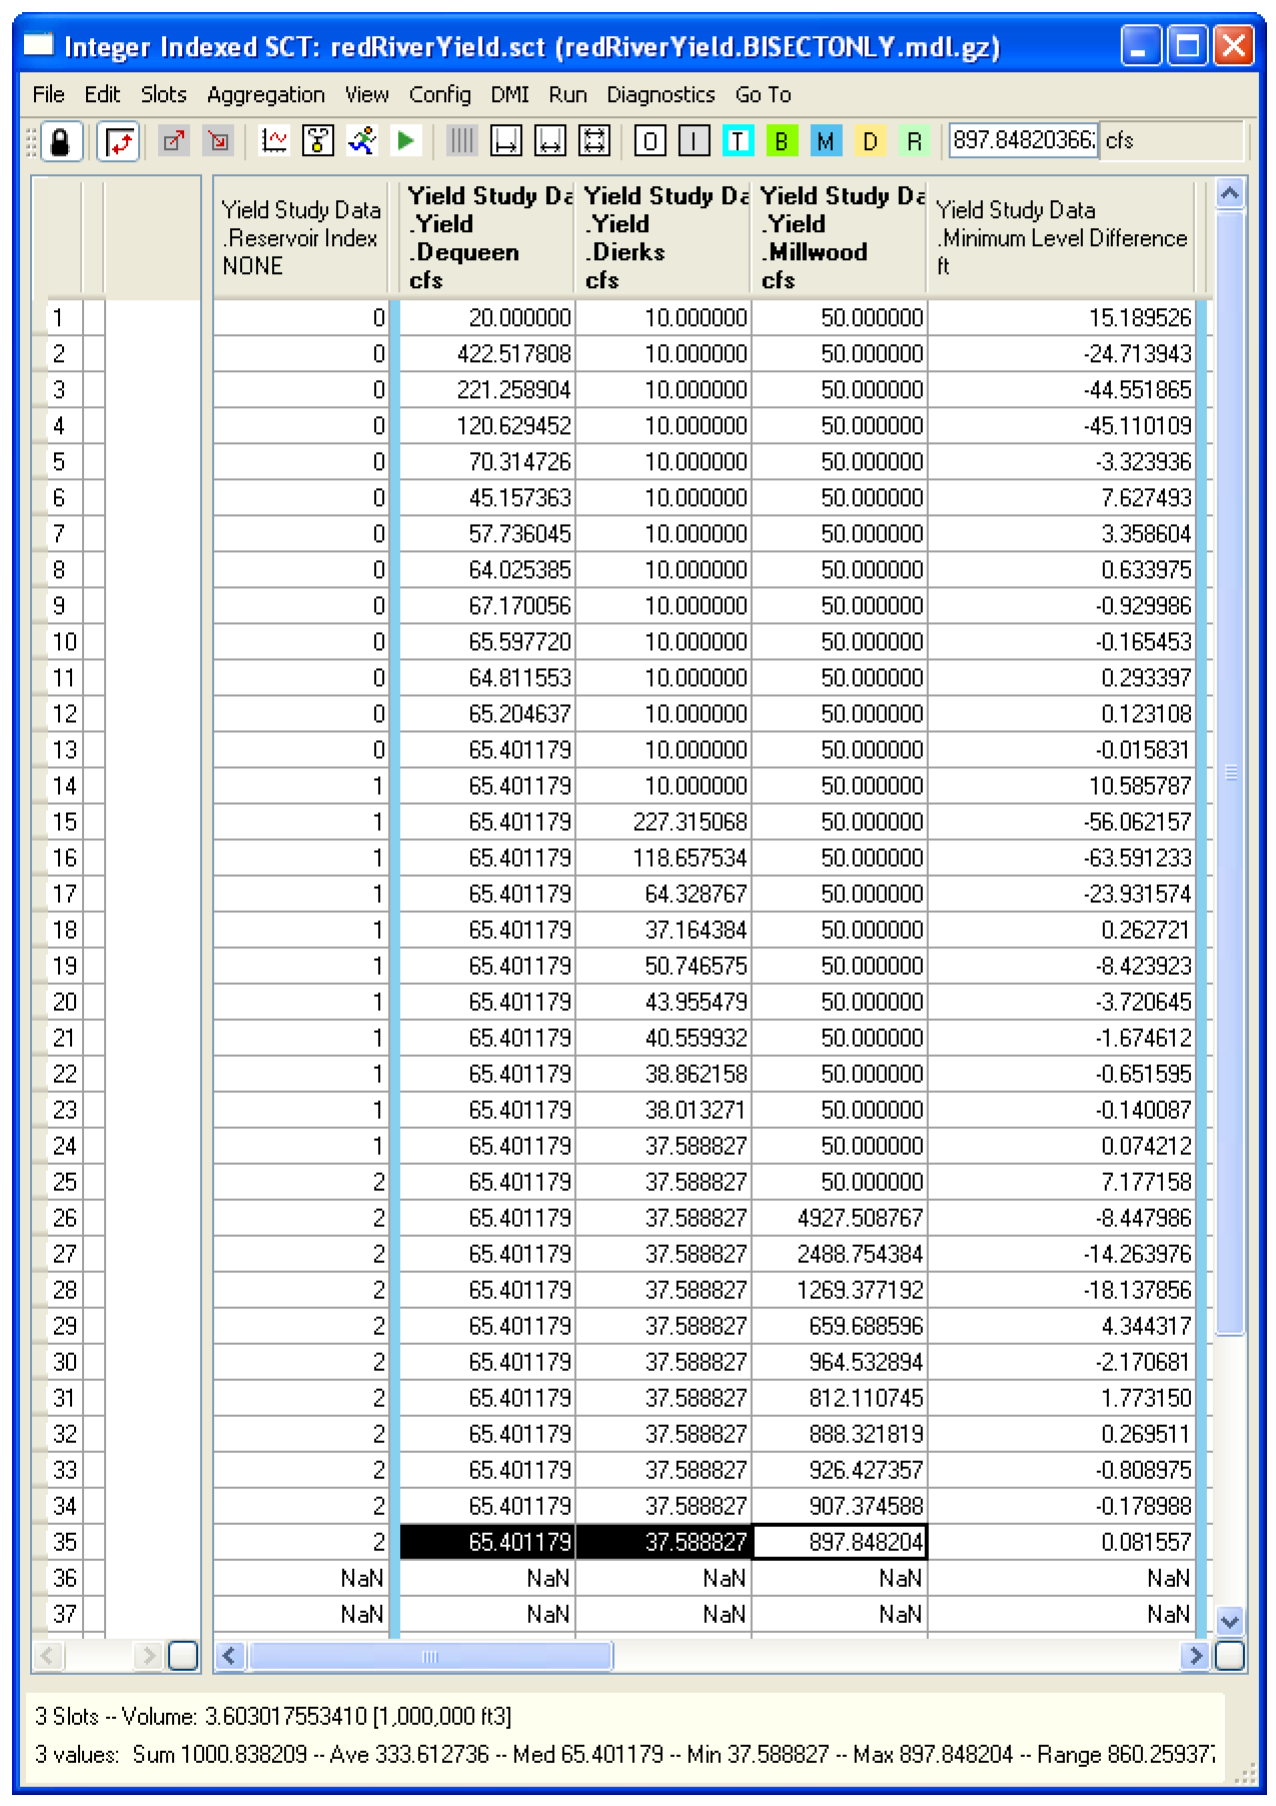
Figure 5.6 shows sample results. The Bisection method converged in 35 iterations. This section provides some guidance on viewing the SCT.
The SCT can be read as follows: Each row represents an iterative run. The average yield used for each run can be found in the Yield.Res column. For example, in the first run the minimum yield of 20 cfs was used for Dequeen, 10cfs for Dierks and 50 cfs for Millwood. In the next row, the maximum for Dequeen is used while the other two reservoirs continue to use the previous value. Then the yield for Dequeen is bisected. Only Dequeen’s Yield is modified until it converges, then the algorithm moves on to Dierks. The Minimum Level Difference column shows the minimum difference between pool elevation and the bottom of the conservation pool.
Note: Convergence is met in rows 13, 24, and 35 where this value is less than 0.1ft.
Note: The yields are average values, while the distributed values are set on the Reservoir.Diversion slot and can be viewed there. To determine the total yield, highlight each of the individual yields as shown and the sum is displayed at the bottom of the SCT. The SCT also contains (not shown) the bounds used in iteration and the critical period found for each run. At the end of the iterative run, the critical period can be found on the row in which that reservoir converged, i.e. 13, 24, and 35.
Figure 5.6 SCT used to view results from Yield study
Revised: 08/02/2021