
Configure display of summary cells
Use this procedure to configure the background colors used for aggregation summary rows, specify whether to display summary statistics in the SCT Status area, and define the colors used in the SCT Status area. See Summary tab for details on these settings.
1. On the SCT menu, select Config, then Summary.
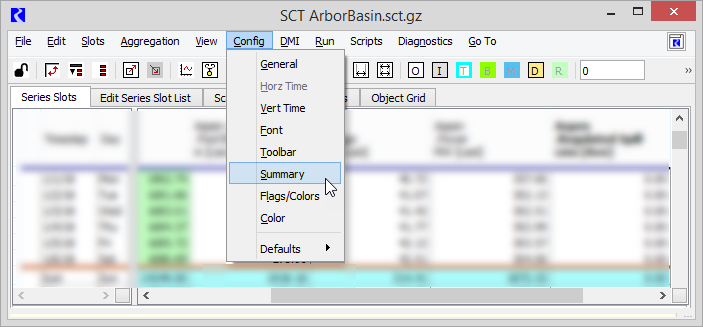
The SCT Configuration window opens at the Aggregation Summary Cells Flag Ornamentation tab.
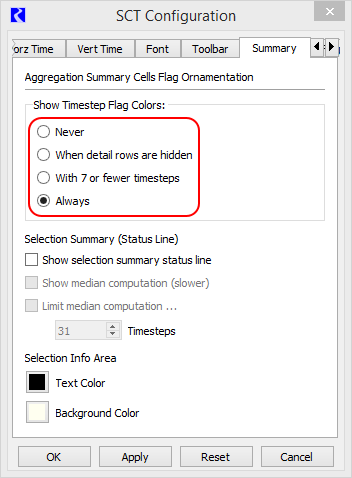
2. In the Show Timestep Flag Colors setting, select one of the following options to indicate whether the background color for summary rows should be the cell value flag color or the Summary Cell Background color. These options allow you to experiment with ways of distinguishing summary rows from detail rows. They also support a faster screen refresh rate with large aggregations.
• Never—summary rows never use flag colors in the background; they always use the Summary Cell Background color.
• When detail rows are hidden—summary rows uses the appropriate flag color in the background when detailed timesteps are hidden; they use the Summary Cell Background color when details are shown.
• With 7 or fewer timesteps—summary rows with seven or fewer timesteps use the appropriate flag color in the background; rows with more than seven timesteps use the Summary Cell Background color.
• Always—summary rows always use the appropriate flag color in the background. This is a good option in most circumstances.
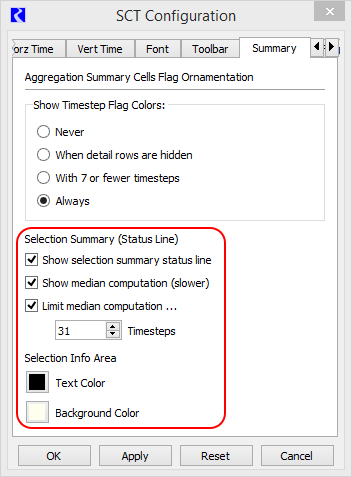
3. Use the following steps to configure the SCT Status area.
a. Select or clear the Show selection summary status line check box, as follows.
• Select to enable the display of summary statistics in the SCT Status area when one or more cells are selected in the same slot.
Note: If cells are selected in multiple slots, summary statistics are not displayed.
• Clear to disable the display of summary statistics when cells are selected; proceed to Step 4.
b. Configure the display of median values in the summary statistics, as follows.
• Select the Show median computation (slower) checkbox to display the median value for selected cells.
• Clear the check box to exclude median values; proceed to Step 4.
Note: The median value requires the selected values to be sorted; therefore, enabling this option may lead to slower response times in the SCT display. You can mitigate this by disabling the median value display when more than a specified number of cells have been selected.
c. Optionally disable the display of median values when more than a specified number of cells have been selected, as follows.
• Select the Limit median computation check box to include median values only for a specified number of selected cells. In the Timesteps field, enter the maximum number of selected cells for which median values will be computed. The default is the number of timesteps in the aggregation interval.
• Clear the check box to display the median regardless of the number of cells selected; proceed to Step 4.
The median is displayed only if the number of cells selected is less than or equal to this number. For example, if this field is “5” and you select five or fewer cells, the median is included; if you select six or more cells, the median is not included.
4. Configure the appearance of the SCT Status area, as follows.
– Select the Text Color button to customize the text color used in the SCT Status area. This selection opens a color selector dialog box that allows you to define or select a custom color.
– Select the Background Color button to customize the background color used in the SCT Status area. This selection opens a color selector dialog box that allows you to define or select a custom color.
5. Select Apply or OK to apply the settings to the SCT.
The SCT display is immediately updated.
Related topics
Revised: 08/02/2021