
Plotting Structure and Interface
Like other Output devices, the plot consist of a dialog used to edit and configure the Plot Page and a view of the completed Plot Page. Following is an overview of each part of the plotting utility.
Plot Page Editor
The Plot Page Editor is where all editing is performed. This includes defining the layout (1X1, 2X1, 3X3), adding curves, choosing the slots for curves, and configuring the appearance in terms of colors, line widths, etc. See Plot Page Editor for details. You can edit multiple plots at once by selecting the Configure Multiple Plots and Curves dialog. See Configuring Multiple Plots and Curves for details.
Plot Page
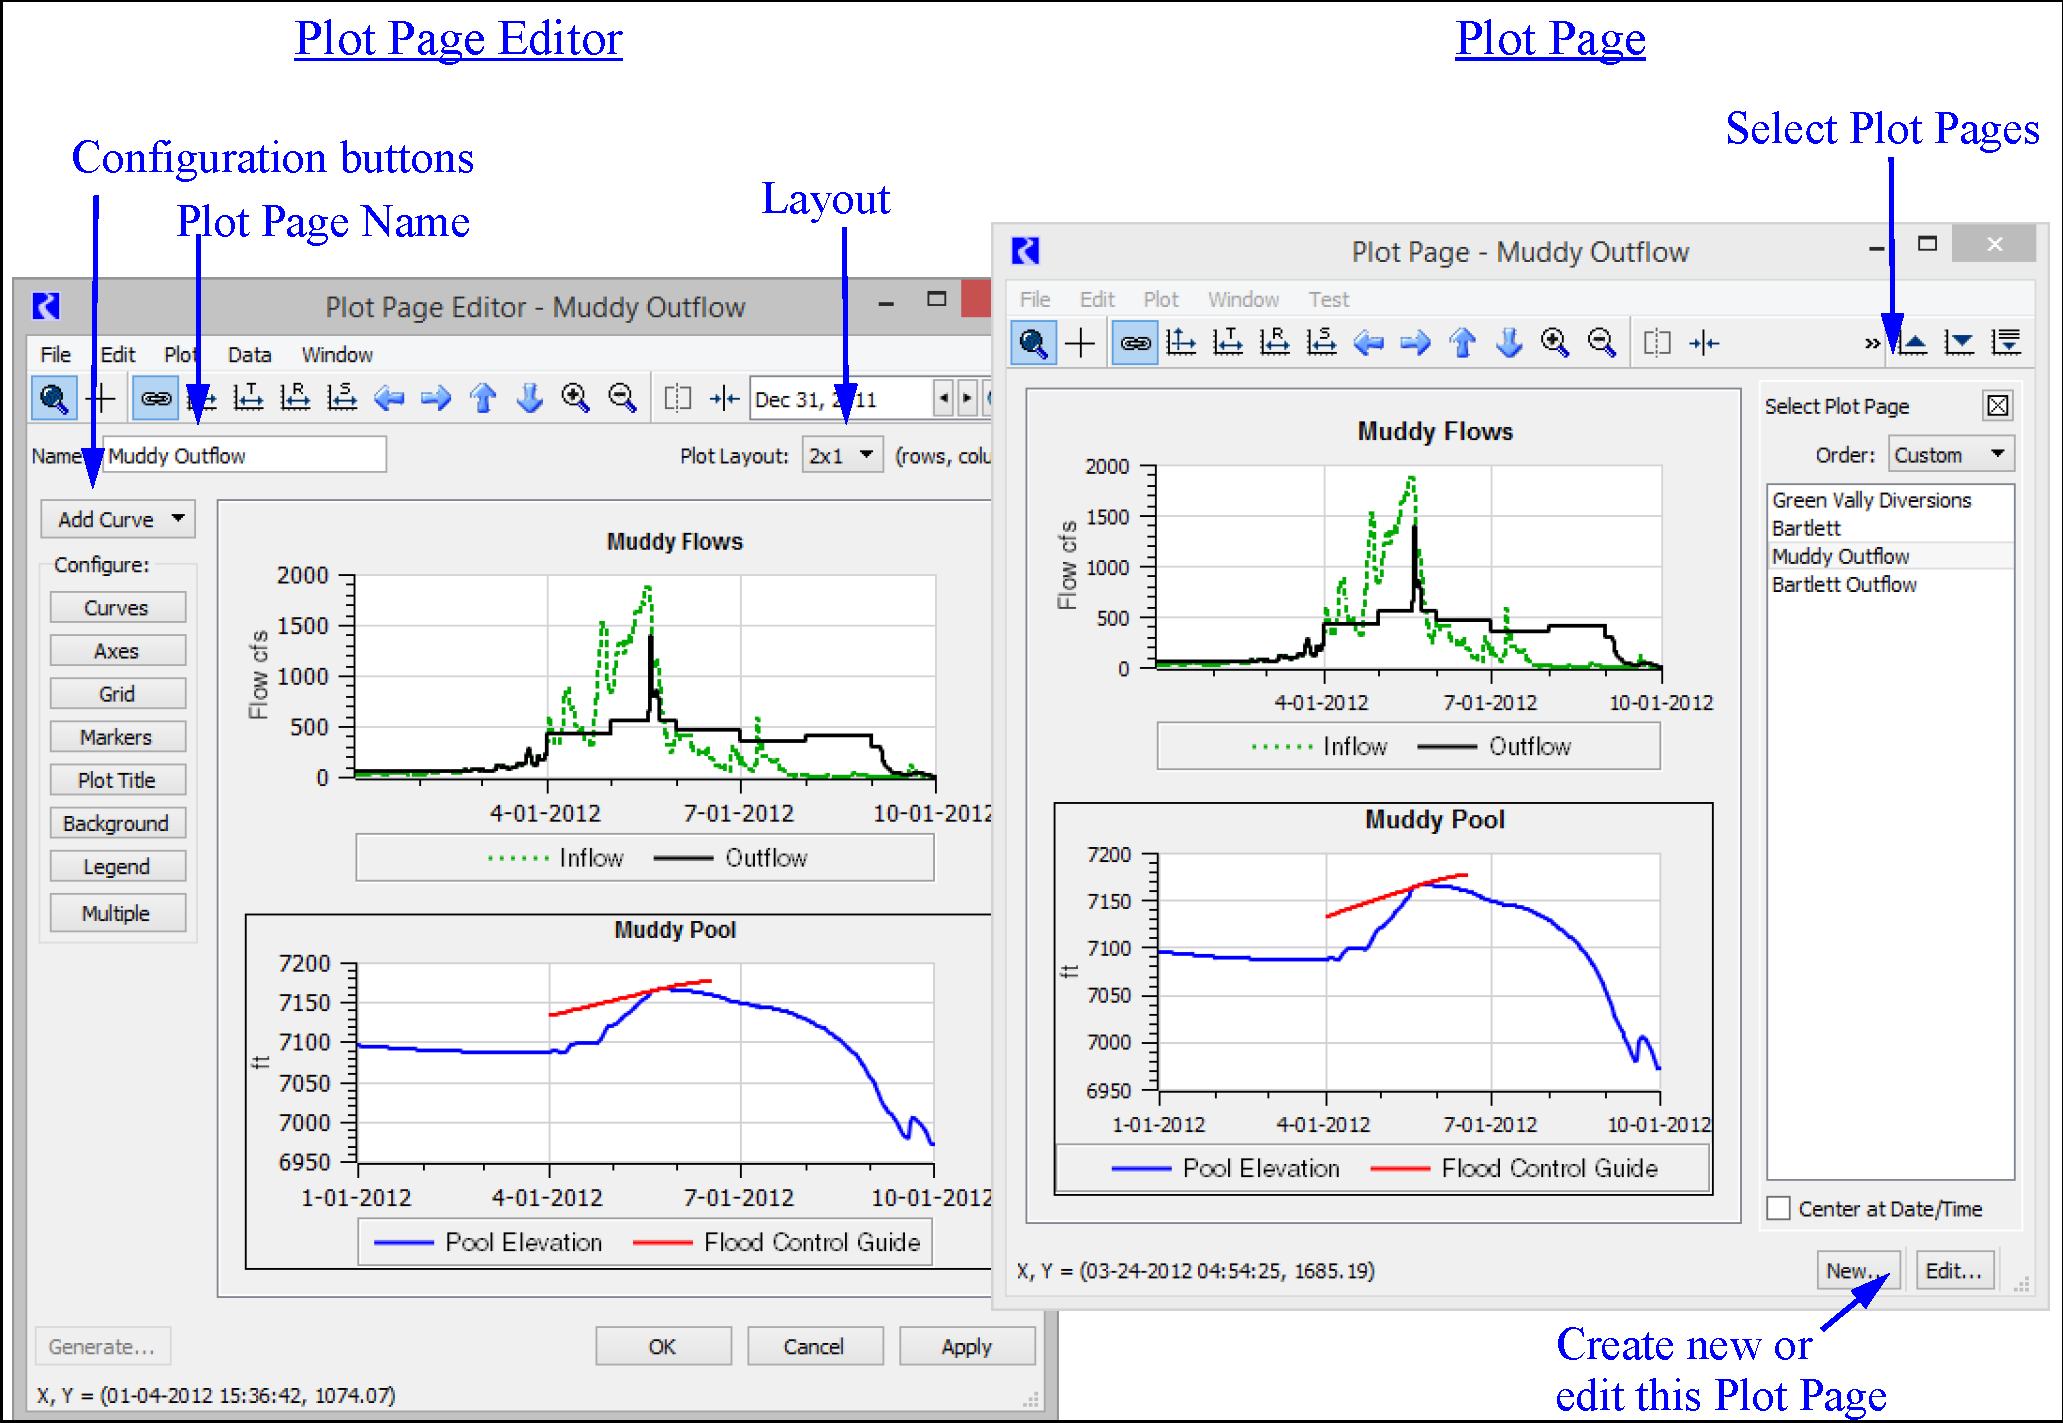
The Plot Page displays the saved plots and provides interaction with multiple plots. This is shown in Figure 2.2. In addition, the Plot Page can optionally show the list of saved plot pages in the model. You can then select through them to view the various data. See Plot Page for details.
Figure 2.2 shows that both dialogs share a common tool bar that has navigation controls. See Plot Page Navigation for descriptions of the controls.
Figure 2.2 Annotated screenshots of the Plot Page Editor and Plot Page Viewer
Revised: 08/02/2021