
Power
Only a subset of available Simulation methods are available in Optimization. Selection of a method other than those that follow will result in an error.
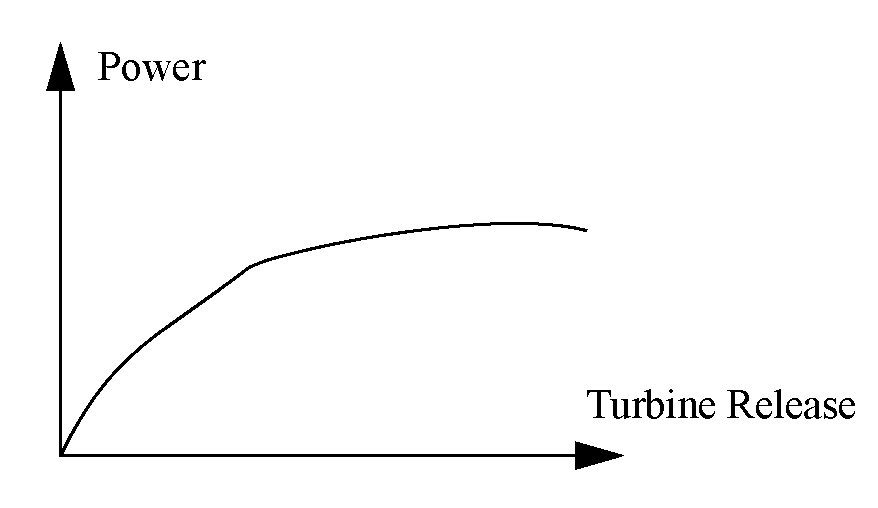
If the Optimization problem uses Power, either directly or indirectly, then the Power slot is added to the problem. Before being passed to the optimization solver, this slot is numerically approximated as a function of Operating Head and Turbine Release (Numerical 3-D Approximation).
See Power in Objects and Methods for details on the Simulation methods.
Slots Specific to This Method
Power
Type: Agg Series Slot
Units: Power
Description: Power generated by flow through the turbines
Information:
Defined by: Numerical 3-D Approximation in terms of Operating Head and Turbine Release. Approximation is based on the Plant Power Table.
The Power LP Param table contains a value for Operating Head used to index the Operating Head column of the Plant Power Table. This approximated value, therefore, reduces the Power to a function of Turbine Release.
The flow values in the Power LP Param table are then used as approximation points, indexing the Turbine Release column of the Plant Power Table.
The Plant Power Table should have increasing values of Operating Head and Turbine Release. Power should be a concave function of Operating Head, but concavity is not strictly enforced. The preferred order of approximation is substitution, piece-wise, two-point line, tangent.
Power LP Param
Type: Table Slot
Units: Length and Flow
Description: Specifies the Operating Head and the flow points used to take the tangent, line, and piecewise approximations for Power linearization.
Information: This table must be user input if the Independent Linearizations method is selected in the Optimization Power category; otherwise it is unused.
The best Operating Head to choose should be close to the expected head during optimized period. Tangent approximation is generally not used, nor helpful, as it often results in non-zero power for zero flow.
The suggested points for a line approximation are 0 flow and best turbine flow for the entire plant. The suggested points for piecewise linearization are 0 flow, 1 unit best turbine flow, 2 units best turbine flow ... n units best turbine flow, and maximum turbine flow.
Defined by:
Power Turbine Release relationship, for a fixed Operating Head value. Not drawn to scale.
Slots Specific to This Method
In the RPL Optimization mode, the following slot requires special handling.
Best Turbine Flow
Type: Agg Series Slot
Units: Flow
Description: Flow associated with the most efficient power generation for an associated Operating Head
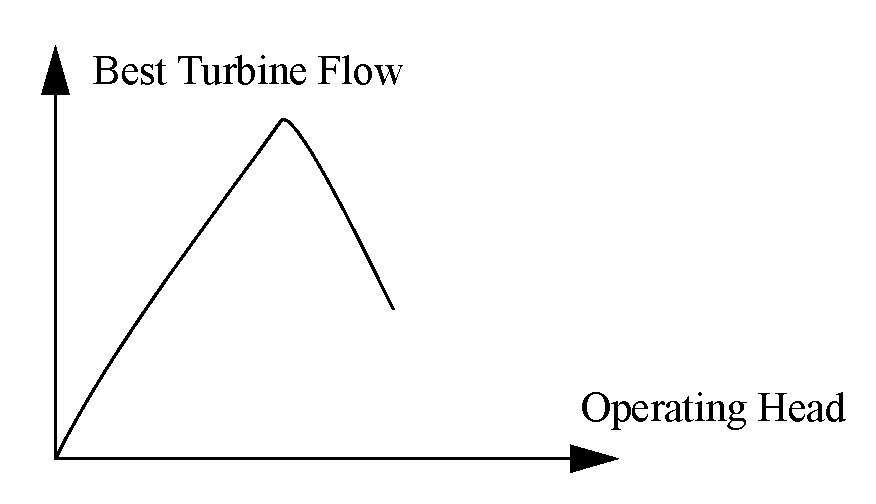
Information: If the Optimization problem uses Best Turbine Flow, either directly or indirectly, this slot is added to the problem. Before being passed to the Optimization solver, this slot is numerically approximated as a function of Operating Head (Numerical 2-D Approximation). The relationship between Operating Head and Best Turbine Flow depends on other methods selected, as follows.
If the selected method in the Power category is Plant Efficiency Curve, the relationship is automatically developed from the Plant Power Table.
For the Plant Power Coefficient method, the user-input Best Turbine Q table defines the relationship.
For other Plant Calculation category methods, Best Turbine Flow must be input.
Defined by: Numerical 2-D Approximation in terms of Operating Head, based upon an internal best turbine flow table. For the Plant Power Coefficient method (selected in the Power category) the internal table is the Best Turbine Q table. The Best Turbine Q table is required to have increasing values of Operating Head and Best Capacity, and be a concave function of Operating Head.
The preferred order of approximation is substitution, piece-wise, tangent, two-point line. The Best Turbine Flow LP Param table values are used as approximation points, indexing the best turbine flow table.
Best Turbine Flow LP Param
Type: Table Slot
Units: Length
Description: Specifies the Operating Head points in the best turbine flow relationship used to take the tangent, line and piecewise approximations for Best Turbine Flow linearization
Information: The best operating head points to choose for a piecewise approximation are generally: minimum Operating Head, Operating Head at max capacity, and maximum Operating Head. These three points typically define most of the shape of the Best Turbine Flow curve.
Defined by: User input
Best Turbine Q
Type: Table Slot
Units: Length vs Flow
Description: Table defining the relationship between Operating Head and the most efficient power generation.
Information: This table is used if the Power category has the Plant Power Coefficient method selected. If the Power category has the Plant Efficiency Curve method selected, then this table is not used, but a similar relationship is automatically developed from the Plant Power Table.
Defined by: User input
Plant Power Table
Type: Table Slot
Units: Length vs Flow vs Power
Description: Table defining the relationship between Operating Head, Turbine Release, and Power at selected points of operation. In building the Plant Power table, the following approach might be taken.
For a given Operating Head, create n + 2 rows of data, where n is the number of units comprising the Plant. The first row reflects no flow through the turbines. The next row reflects the preferred level of flow through the first unit normally activated. Subsequent rows reflect incremental flow levels as additional turbines come on line at their respective preferred levels of flow. The final row reflects the flow of all available units running at maximum flow capacity.
Information: Data must be entered into the table in increasing, concave blocks of the same Operating Head for the 3‑D table interpolation to work correctly. For every block of the same Operating Head in column 1, Turbine Release and the corresponding Power should be listed in increasing, concave order in columns 2 and 3.
There must be a point of zero Turbine Release and zero Power for each Operating Head. The following table is an example of the proper way to formulate the Plant Power Table. This table can be derived from the Best Turbine Q, Best Power Coefficient, Max Turbine Q and Max Power Coefficient slots.
Operating Head | Turbine Release | Power |
|---|---|---|
30 | 0 | 0 |
30 | 100 | 100 |
30 | 200 | 175 |
40 | 0 | 0 |
40 | 100 | 125 |
40 | 220 | 195 |
50 | 0 | 0 |
50 | 110 | 147 |
50 | 250 | 205 |
Best Turbine Flow – Operating Head relationship. Not drawn to scale.
Defined by: User input
The Plant Efficiency Curve method approximates Best Power Flow the same as the Plant Power Coefficient method.
In RPL Optimization, this method creates the following turbine release constraint. No actual power value is calculated.
(5.47) Turbine Release <= Power Plant Capacity Fraction * Turbine Capacity * Number of Units.
In RPL Optimization, this method creates the following turbine release constraint. No actual power value is calculated.
(5.48) Turbine Release <= Power Plant Capacity Fraction * Turbine Capacity * Number of Units.
See Unit Power for the Optimization formulation.
See Unit Power Table in Objects and Methods for the Simulation algorithm.
Slots Specific to This Method
See Unit Power Table in Objects and Methods for slot descriptions.
Method Details
When the Unit Power Table method is selected, the following method categories are available:
• Startup
The status of a unit at a given timestep can be one of the following:
• Available
• Unavailable
• Must run
At the highest level, an entire plant may never be able to provide an ancillary service like Regulation. The user can indicate this by selecting None in the appropriate category. On the other hand, the following slot settings allow users to specify unit availability / must run for individual time steps for generation and ancillary services. Without any inputs, the units default to being available.
If the Unit Power Table method is selected, but not Frequency Regulation, the user can specify through optimization RPL policy.
Note: Setting certain slots may be possible but not preferred.
• Unit u must generate at time t:
– Unit Is Generating [t,u] = 1, or
– Unit Energy [t,u] = value
• Unit u is unavailable at time t:
– Unit Is Generating [t,u] = 0, or
– Unit Energy [t,u] = 0
If the Frequency Regulation method is selected, the user could specify through optimization policy (RPL):
• Unit u must regulate up at time t:
– Regulation Up [t,u] = value
• Unit u must regulate down at time t:
– Regulation Down [t,u] = value
• Unit u must regulate at time t:
– Regulation [t,u] = value (which implies Regulation Up [t,u] = value and Regulation Down [t,u] = value)
If a unit is unavailable for some type of regulation, then a value can be 0.
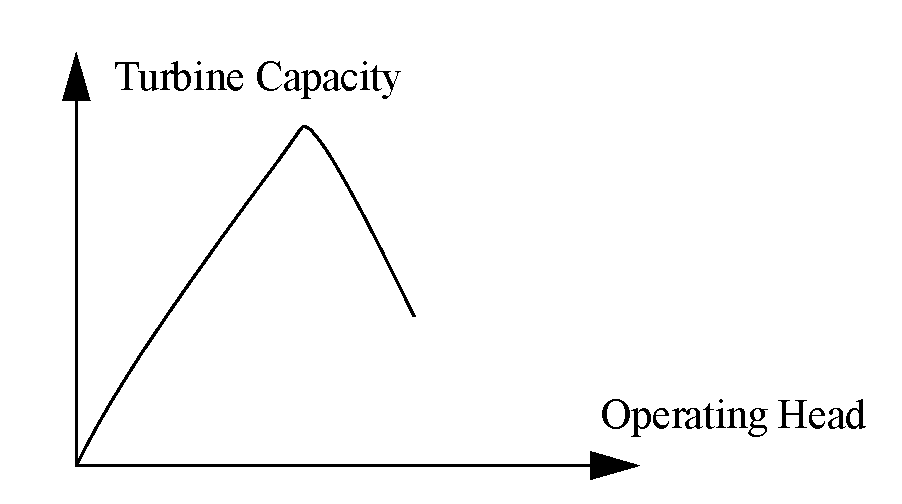
Turbine Capacity is numerically approximated before being passed to the optimization solver. The slot is approximated as a function of Operating Head (Numerical 2-D Approximation).
The relationship between Operating Head and Turbine Capacity depends on the method selected in the Power category, as follows.
• If Plant Efficiency Curve is selected, the relationship is automatically developed from the Plant Power Table.
• If Peak Power or Peak and Base is selected, the relationship comes from the Best Generator Flow table.
• If none of these methods is chosen, the relationship is contained in the user-input Max Turbine Q slot.
Slots Specific to This Method
Turbine Capacity
Type: Agg Series Slot
Units: Flow
Description: Flow capacity of the turbines
Information:
Defined by: Numerical 2-D Approximation in terms of Operating Head, based upon a maximum turbine capacity table. This capacity table is determined in various ways according to the Power method:
The Turbine Capacity LP Param table values are used as approximation points, indexing the selected maximum turbine capacity table. The maximum turbine capacity table is required to have increasing values of Operating Head. Turbine Capacity in that table is required to be a concave function of Operating Head. The preferred order of approximation is substitution, piecewise, tangent, two-point line.
Turbine Capacity LP Param
Type: Table Slot
Units: Length vs Length vs Length
Description: Specifies the operational head points used to take the tangent, line and piecewise approximations for Turbine Capacity linearization
Information: For the piecewise approximation the best operating head points to chose are generally: minimum Operating Head, Operating Head at max capacity, and maximum Operating Head. These three points typically define most of the shape of the Turbine Capacity curve.
The following figure illustrates the relationship of
Defined by: User input, unless the selected method in the Power Linearization Automation category is not None.
Turbine Capacity Operating Head relationship. Not drawn to scale.
Revised: 08/02/2021