
Plotting Templates
Plot Templates allow you to create a Plot Page involving particular slots on particular objects and then generalize this Plot Page as a Template. You can then apply the Template to other objects and slots of the same type. This is useful when you have data that you wish to plot for many objects or slots.
For example, for a basin with 10 reservoirs, you may wish to view Storage and a guide curve, Outflow and flow targets, and Energy produced. You wish to view this exact same data in the same plotting format for each reservoir. Plot Templates allow you to create and configure one Plot Page, save that as a Template and then apply that to the other 9 reservoirs in the basin.
Another example, you might create a 3X1 Plot Page that has the following curves by plot:
• BigReservoir.Pool Elevation and BigDataObject.FloodGuide
• BigReservoir.Storage and DeepReservoir.Storage
• BigReservoir.Outflow
Turning this Plot Page into a Template will give you the ability to easily substitute reservoirs, for example, into the Template:
• SmallReservoir for BigReservoir
• ShallowReservoir for DeepReservoir
• SmallDataObject for BigDataObject
This could then create the 3X1 Plot Page that has the following curves by plot:
• SmallReservoir.Pool Elevation and SmallDataObject.FloodGuide
• SmallReservoir.Storage and ShallowReservoir.Storage
• SmallReservoir.Outflow
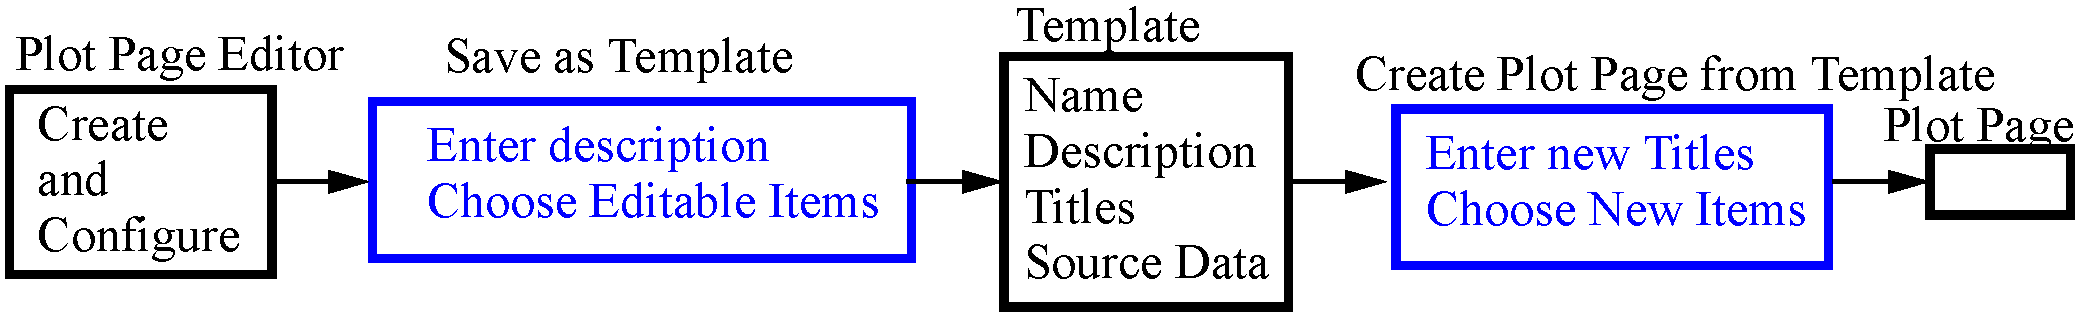
The three aspects of creating and using Plot Templates are illustrated in Figure 2.27 and described in the following sections.
Figure 2.27
Create and Configure a Base Plot Page
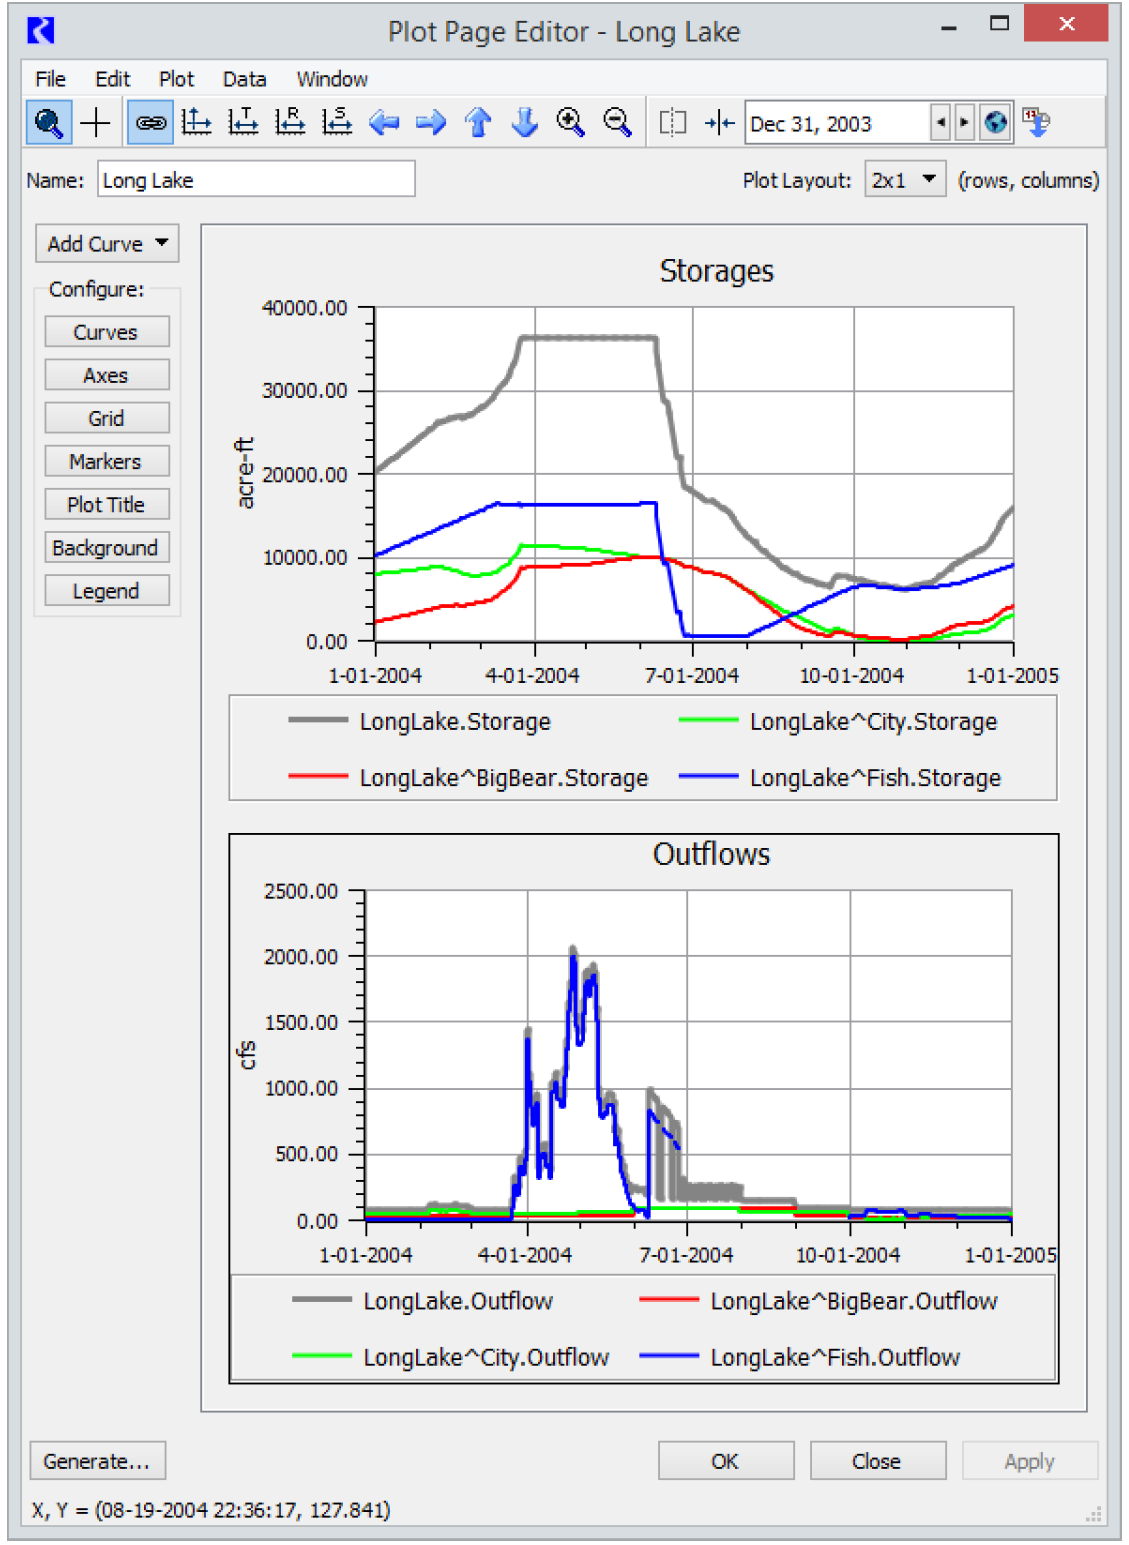
A Plot Template is created from an existing Plot Page. Thus, it is important to configure the Plot Page as desired before saving it as a Template. Make sure you have your colors, line widths, axis labels, axis precision, and titles correct. Once you save the Plot Page as a Template, you cannot change these settings in the Template itself. You can change any configuration setting in Plot Pages generated from the Template, but configuring it as desired in the first place, can save you time. Figure 2.28 is the original Plot Page used in the subsequent example screenshots.
Figure 2.28
Save a Plot Page as a Template
Once a Plot Page is configured as desired, you can save it as a Template. From the Plot Page Editor, select: File, then Save As Template,
This opens the Save Plot Page as Plot Page Template dialog shown in Figure 2.29.
Figure 2.29
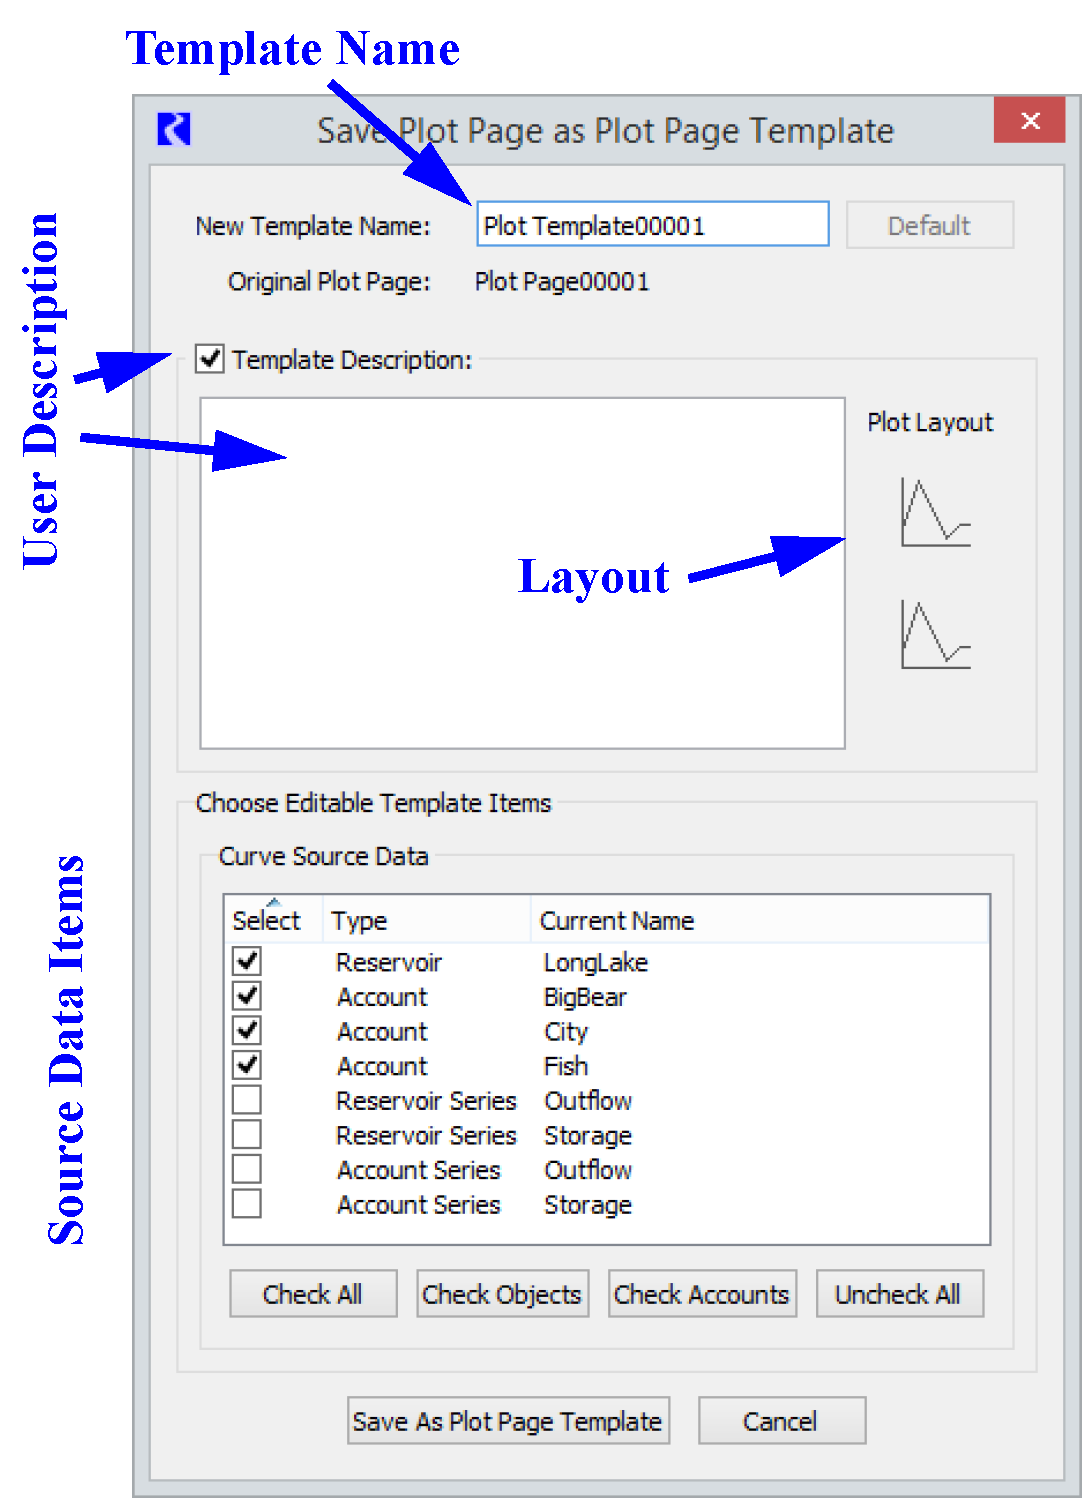
In the Save Plot Page as Plot Page Template dialog, the user specifies the Name of the new template, and any Descriptive text about the plots in the template. This description can optionally be hidden by selecting the checkbox next to the Template Description. You should enter enough text in here to describe the items in the template. The graph layout is shown to help describe the template. Tooltips on the graph icon show the Title for each graph.
The bottom part of the dialog, Choose Editable Template Items is where you specify which items in the plot you want to make editable in the template. Select the checkbox of each desired item. Options include the following:
• Objects
• Accounts
• Slots
• Supplies
Because certain slots (like Hydrologic Inflow) are only available for certain objects, (Reservoirs). The slots are broken into further types such as “Reservoir Series” or “Account Series”. Also, because certain objects only have certain slots, substitution is limited to like objects. Thus, in the same screenshot, Long Lake is classified as a “Reservoir”.
In Figure 2.30, we select the first two items in the list: Long Lake Reservoir and Big Bear Account.
Figure 2.30
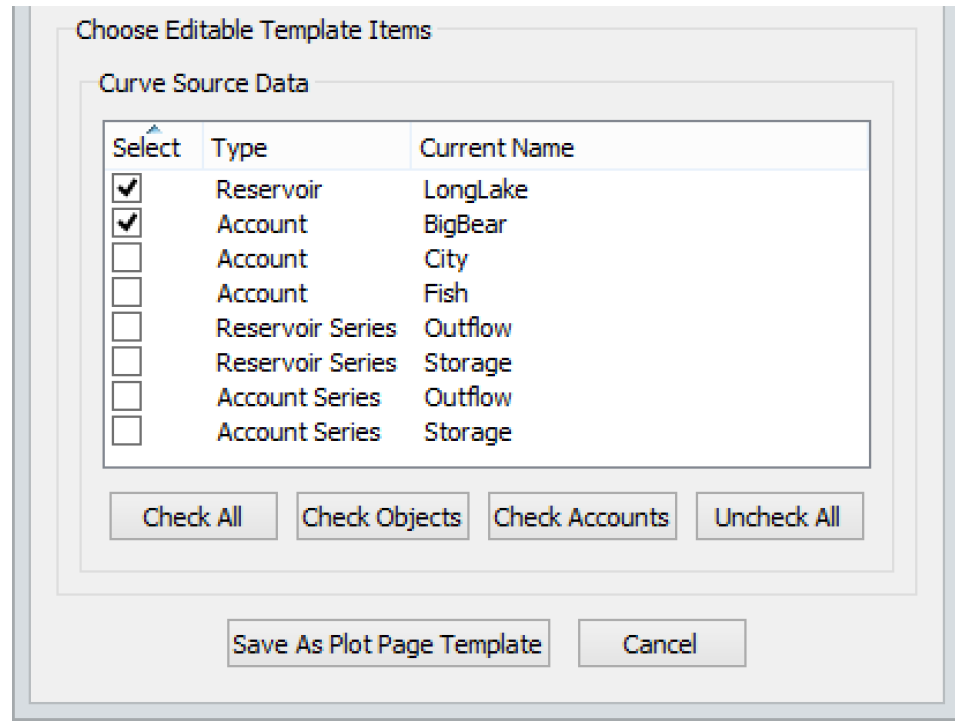
Buttons at the bottom of the frame allow you to Check All, Check Objects, Check Accounts, Uncheck All.
When finished, select Save As Plot Page Template. The dialog closes and the Output Manager opens with the newly created Plot Page Template selected.
If the Save As Plot Page Template is inactive, the tooltip describes the reason.
Apply the Template
Once the Template has been created, it is stored in the Output Manager. From the Output Manager, highlight the template item and select Generate or Edit (or double-click the item). The Plot Page Template dialog opens. It shows the Template’s Name, Description, Titles, and Curve Source Data as described in the following sections.
Figure 2.31
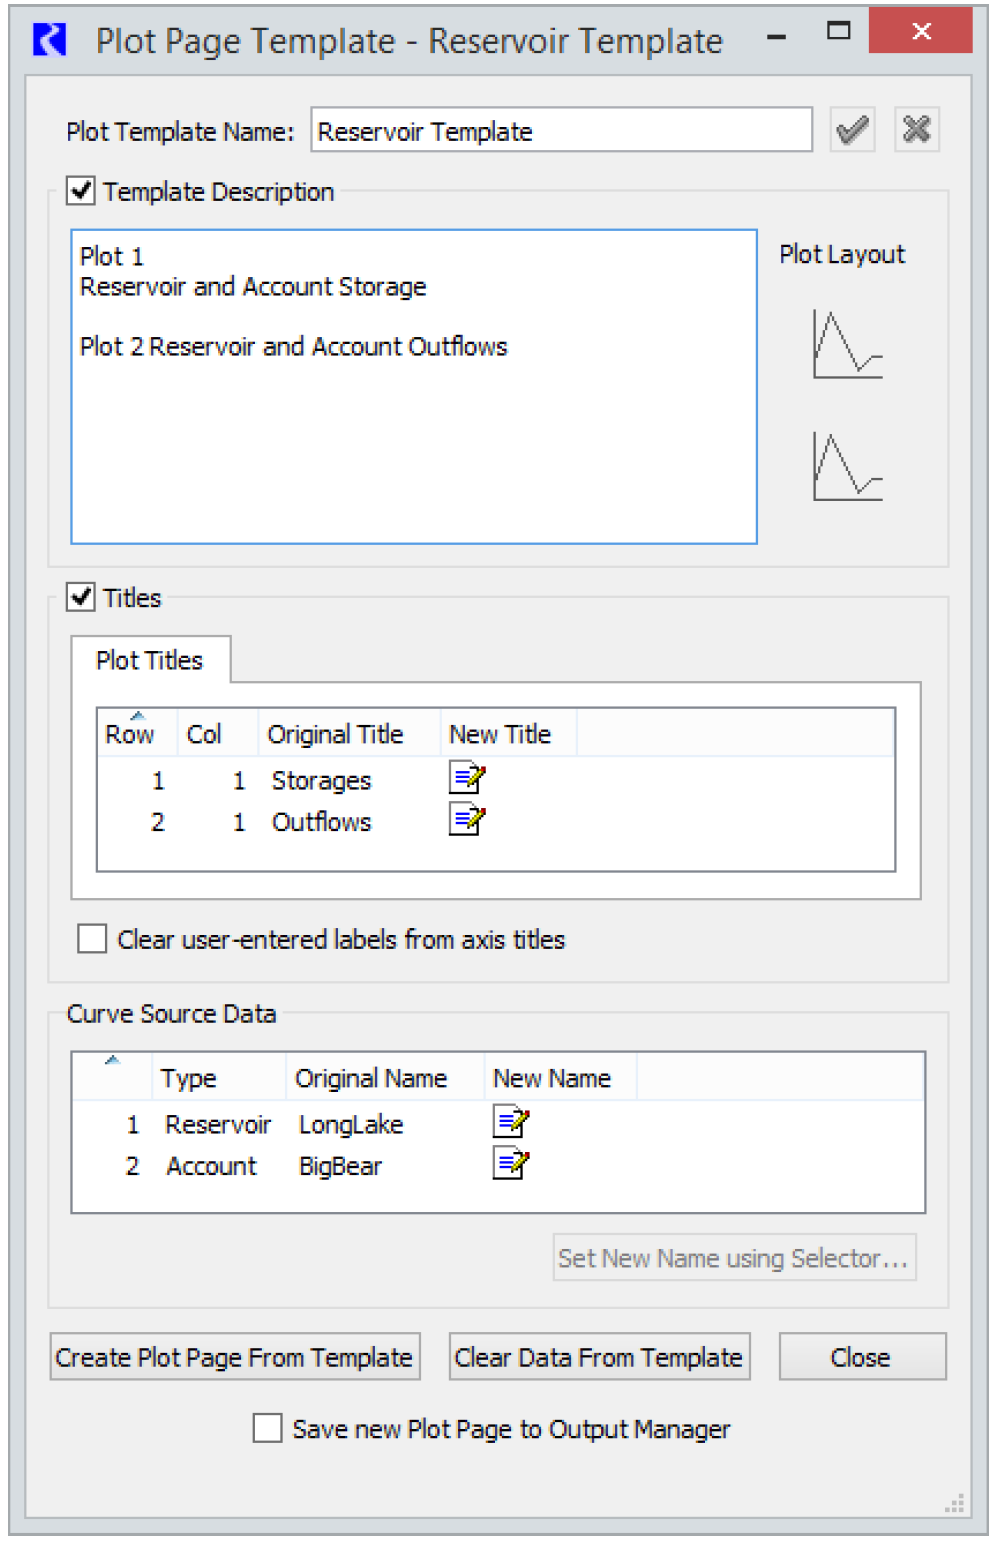
Plot Template Name
The Plot Template Name is shown. If you would like to change the name of the template, enter a new name and select the green check to confirm.
Template Description
This shows the description entered when the template was created. This description is not editable. The region also shows the layout for informational purposes. Tooltips on the graph icon show the original Title for each plot.
Titles
The titles for the original plots are shown. You can hide the whole region by clearing the Titles checkbox.
Edit titles as necessary by selecting the New Title cell and entering new text.
To clear any user-entered labels from the axes titles in new plots, check the Clear user-entered labels from axis titles box. If you want to keep user-entered labels for the axes, leave the box unchecked. Any unit labels for the axes will be recomputed based on the units for the newly plotted slots.
Curve Source Data
The Curve Source Data region is where you substitute new items for the originals. You can do this in either of the following ways.
• Select the New Name field and enter new text.
• Select a row and then select Set New Name using Selector This opens the Selector dialog preset to the appropriate type. For example, if you are substituting for a Reservoir, the selector will only allow you to select from Reservoirs.
Buttons
The buttons at the bottom of the window allow you to create the plot, clear the data (New Titles and New Names) from the template or close the dialog.
A final checkbox at the bottom, when checked, will open a Save As dialog allowing you to immediately save the generated plot to the Output Manager.
When you Create Plot Page From Template a Plot Page is created with the new data substituted for the old, see Figure 2.32. If you left any New Name fields blank, the Template’s original values will be used. Also, if your Template does not apply to certain data in the Plot Page, it will just be plotted as it was originally
Figure 2.32
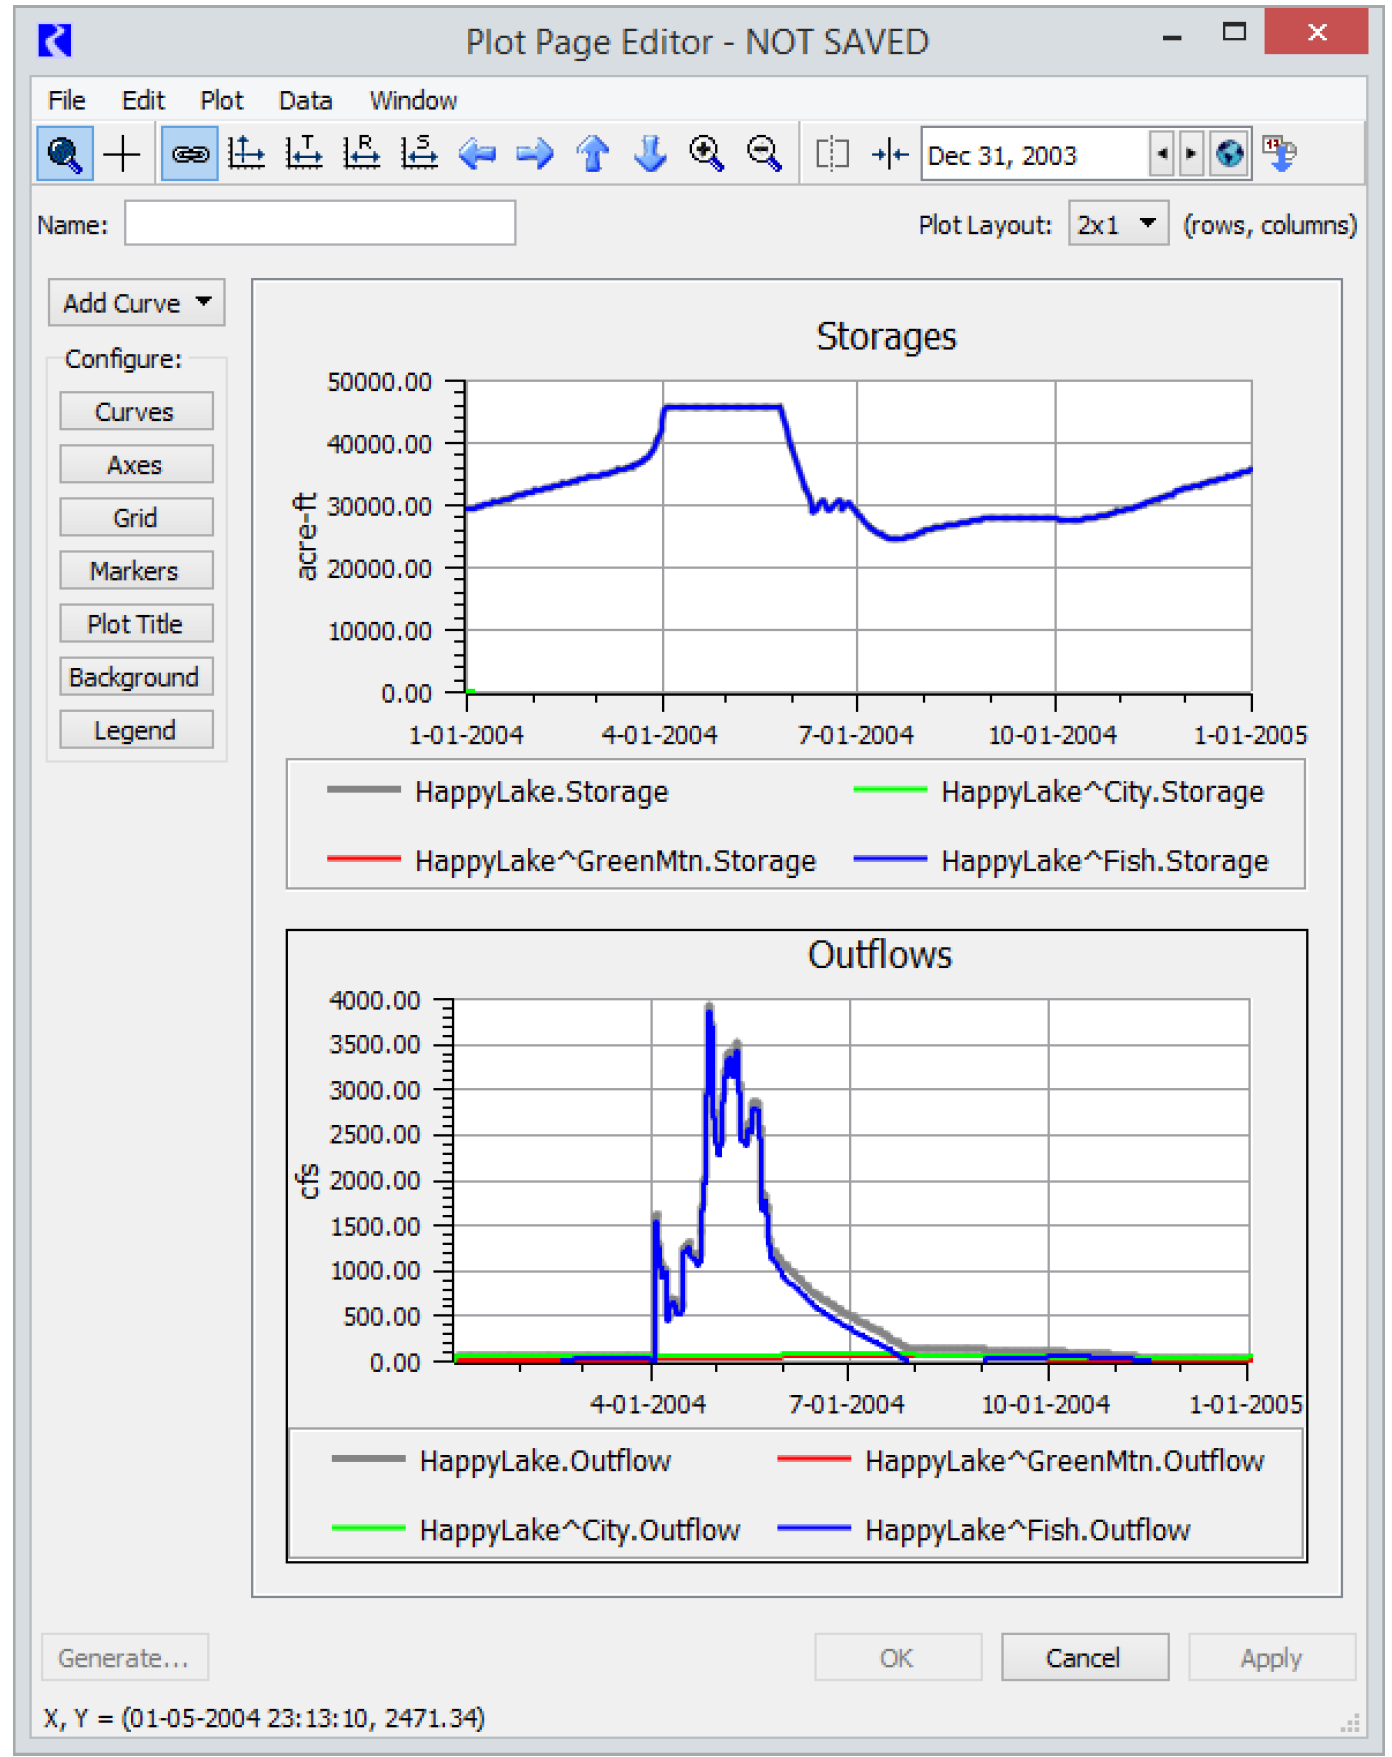
The Template remains open and has not changed. You can then specify new source data for the Template, Clear Data from Template or close the dialog.
In the generated Plot Page, if the source data does not exist, the Plot Page will be created with a placeholder. For example, in Figure 2.32, the Storages plot has no HappyLake^GreenMtnStorage, so there is a legend item, but no data is plotted. You can pick new slots for such curves or delete them using the menu shown by right-clicking the curve in the legend.
If no data can be plotted at all (for example you specified an object that does not exist on the workspace), the plot may be completely blank with no axis.
Also, the plots are zoomed as they were in the original plot, you may need to select Auto Scale  to see the new curves.
to see the new curves. The newly created Plot Page is a normal Plot Page that you can edit and/or save to the Output Manager as desired. It can also be saved as a Plot Template, possibly replacing the original template from which it was generated.
Revised: 01/04/2021