
RPL Debugger
RPL sets can be very large and complicated, and consequently it can be difficult to determine why a set is doing what it is doing. The RPL debugger is designed to help understand the behavior of RPL sets; with this tool the user can pause RPL execution, look at the values of RPL expressions as they are evaluated, and step through RPL execution. The following sections describe the RPL debugger including an overview, how to enable debugging, a tour of the debugger dialog, and suggested ways of using the debugger.
About RPL Debugging
The RPL Debugger utility provides the following functionality:
• Control execution at a fine granularity. Examples:
– Pause (interrupt) execution.
– Set a breakpoint which pauses execution.
– Continue execution.
– Step, i.e., execute the next line of code, optionally descending into called functions.
• Visualize the currently executing RPL logic and data when the program is interrupted, either because an error was encountered or because the user paused execution through the debugger. The RPL policy editors provide a debug cursor which provide visual indication of the current line (i.e., the next line to be executed) and a mechanism for displaying a textual representation of the current values of expressions.
• Visualize and traverse the call stack when the program is interrupted. This consists of a list of the names of the blocks and functions currently in the call stack with an indication of the current location in that stack.
• Manage collections of breakpoints, i.e., provide operations such as add, delete, temporarily disable.
RPL is used in several contexts within RiverWare; currently they are:
• Rulebased simulation (RBS)—Ruleset
• Object level user defined accounting methods—Method set
• Initialization Rule—Ruleset
• Iterative MRM—Ruleset
• Optimization Policy—Goal set
• Expression slots
Except for this last application (Expression slots), RPL policy is organized at the RPL group level into functions and blocks of RPL statements, variously called rules, goals, or methods. Statements can be nested and contain expressions, which might contain function calls. Expression slots and functions are defined by a single RPL expression.
Thus, for blocks of statements, the basic unit of execution in RPL is the statement; whereas, for functions and expression slots, it is the single defining expression.
This RPL policy organization is reflected in the locations at which execution can be paused:
• Before a statement in a rule, optimization goal, or user-defined accounting method is executed
• After all statements in a rule, optimization goal, or user-defined accounting method have executed
• Before a function’s body expression is evaluated
• After a function’s body expression is evaluated
• Before an expression slot’s expression has evaluated
• After an expression slot’s expression has evaluated
When execution is paused, the debugger allows the user to view the values to which expressions have evaluated up to that point. Each time a block of statements or an expression slot is executed, results from any previous evaluations are cleared, so one must pause after a statement’s execution to see the values to which its expressions last evaluated.
Enabling RPL Debugging
To enable this feature, use one of the following approaches:
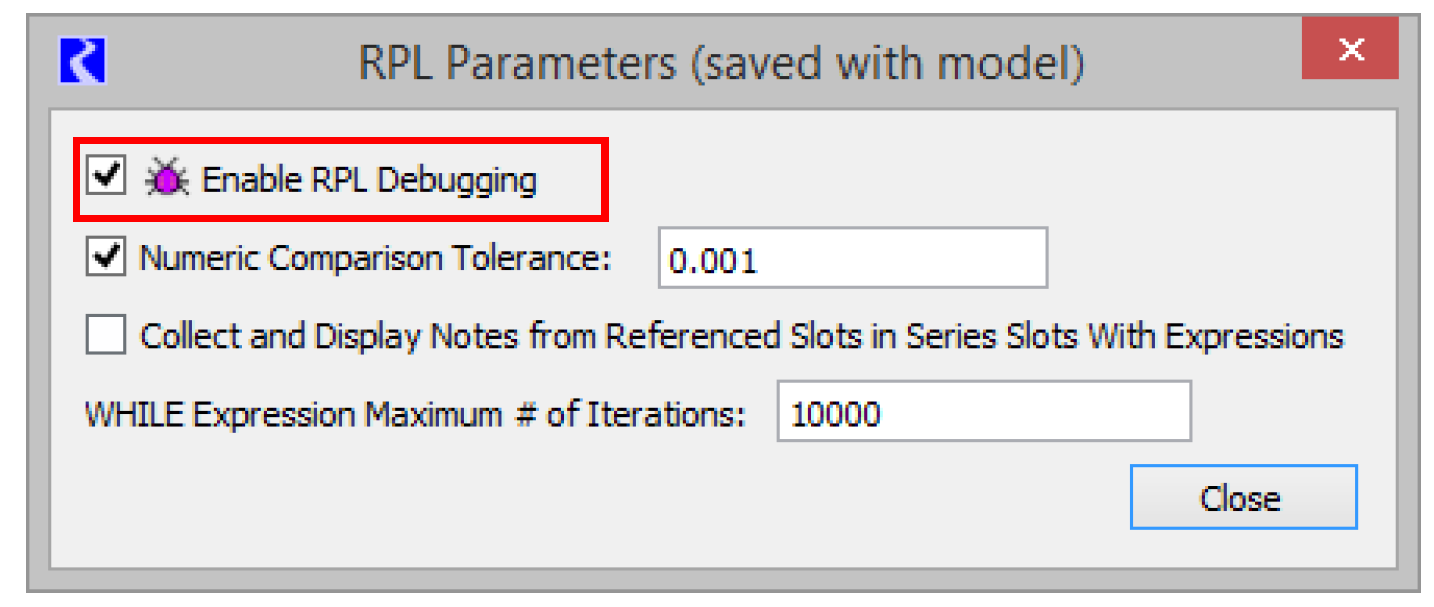
• In the RPL Parameter dialog (Policy, then RPL Parameters), select the Enable RPL debugging checkbox.
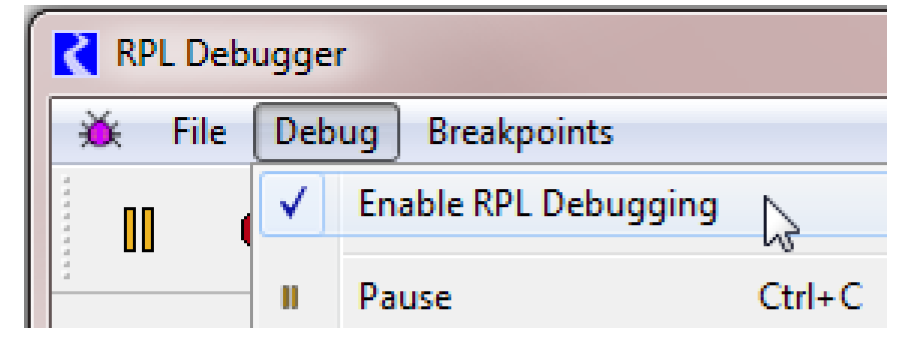
• From the RPL Debugger (Policy, then RPL Debugger), use the Debug, then Enable RPL Debugging menu checkbox.
This is a workspace-level toggle and applies to the execution of all RPL policy associated with the current model. This setting is saved with the model.
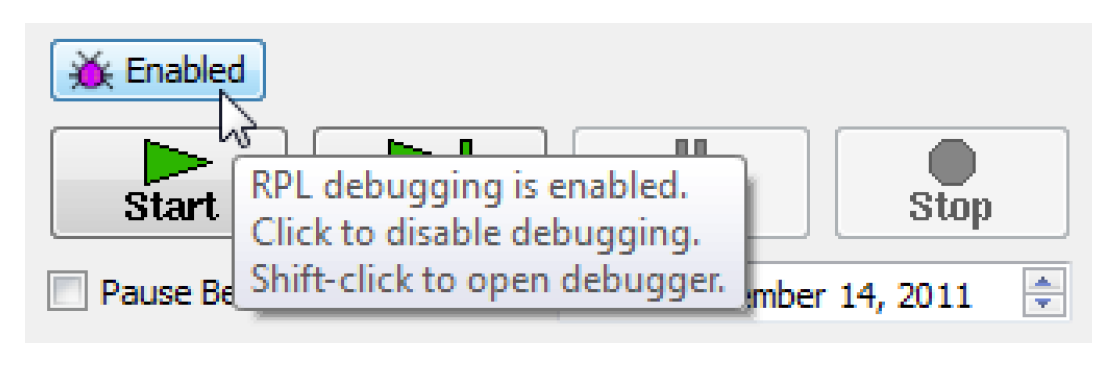
When debugging is first enabled, a button is added to the Run Control dialog to indicate the state of the RPL Debugger. Select the button to select or clear the state. Shift-Click the button to open the RPL Debugger. This button remains in place for that RiverWare session. To hide the button, use the View, then Show RPL Debugging button.
Note: Enabling debugging can have a significant negative impact on performance!
There are two distinct performance impacts of debugging:
• Retaining values on expressions. Normally, RPL execution is optimized for efficiency, and thus during execution values are reused where possible and intermediate results are not retained. To do so requires additional memory and time to copy intermediate results.
• Computational overhead. To support the interruption of RPL execution at each point at which a pause might occur, RiverWare must check if a pause is in fact appropriate for that location.
Since both of these impacts can be significant, by default RiverWare does not enable these processes. Rather the user only incurs the additional overhead of debugging when they have indicated that they would like interactive debugging as described above.
See RPL Debugger Scenario 1 for a scenario in which the user might want to disable and then enable debugging temporarily.
RPL Debugger Dialog
The RPL Debugger dialog is accessible as follows:
• From the Workspace Policy menu (Policy, then RPL Debugger)
• From any RPL dialog Block (Set, Rule, Goal, Method, Function, etc.), then Debugger menu
• Using the F8 shortcut when any RPL dialog is selected
This dialog displays information about RPL execution and allows the user to control RPL execution. Figure 4.6 shows the principle components of this dialog.
Figure 4.6
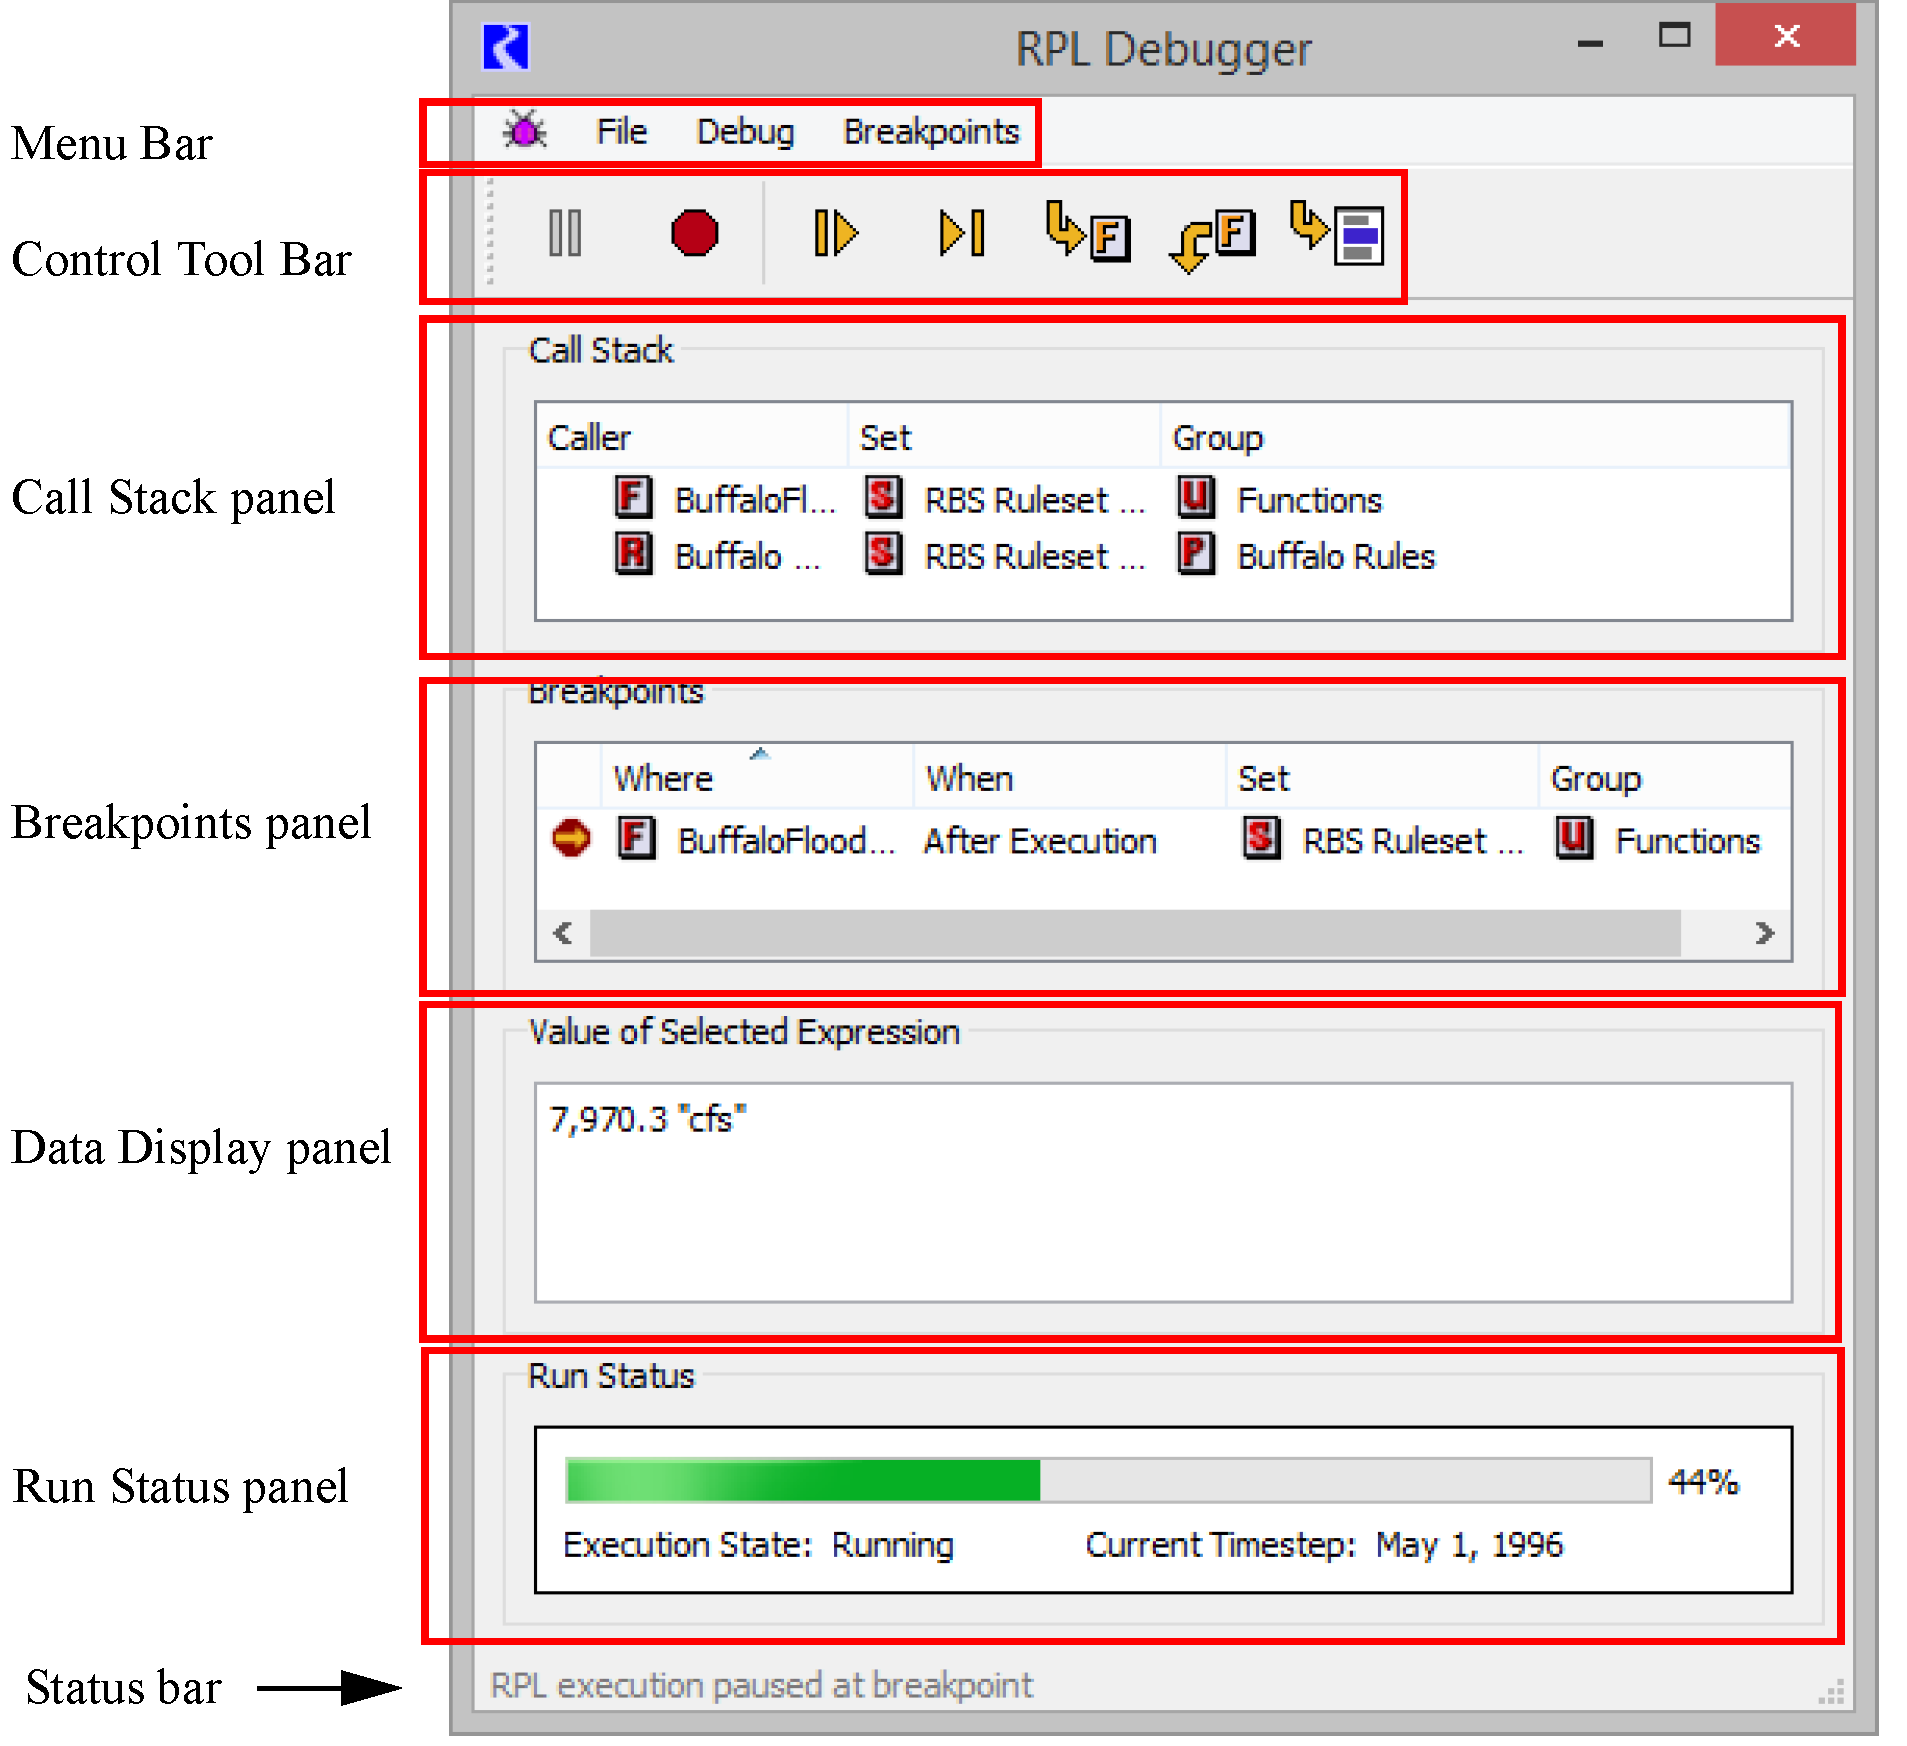
• Menu bar. Menu access to debugger functionality.
• Control toolbar. Buttons for controlling RPL execution.
• Call Stack panel. Describes the location at which RPL execution is paused (when it is paused).
• Breakpoints panel. Lists the locations at which the user has requested that execution regularly pause.
• Data Display panel. Displays the value to which the selected expression last evaluated.
• Error message panel. When an error occurs during RPL execution, a description of that error; see Error Handling for details.
• Run Status panel. Shows the overall run status including the current controller timestep.
• Status bar. Brief description of the state of the debugger.
Menu Bar
Table 4.1 describes the functionality available through the File and Breakpoints menus. See Control Toolbar and Debug Menu for details about Debug menu.
Menu | Sub-menu | Keyboard accelerator | Description |
|---|---|---|---|
File | Close | Ctrl+w | Close the RPL Debugger |
Breakpoints | Enable Breakpoint | F9 | Enable (or disable) the selected breakpoint |
Breakpoints | Delete Breakpoint | Shift+F9 | Delete the selected breakpoint |
Breakpoints | Delete All Breakpoints | Ctrl+Shift+F9 | Delete All Breakpoints |
Control Toolbar and Debug Menu
In addition to the existing mechanisms for controlling a run (e.g., the pause button of the run control dialog), through the debugger the user can control RPL execution. Table 4.2 describes the button controls in the control toolbar and Debug menu of the Debugger dialog.
Menu Item | Button | Keyboard accelerator | Description |
|---|---|---|---|
Enable RPL Debugging | Turn on or off the collection of RPL See Enabling RPL Debugging for debugging information. | ||
Pause |  | Ctrl+c | During RPL evaluation, pause at the next opportunity. When RPL execution is paused, the user can visualize the state of the system in the following ways: • Examine the value to which any RPL expression last evaluated. • Examine the current call stack. • Examine the workspace or otherwise interact with any of the RiverWare dialogs. Some of this functionality is available as well after a run has terminated. The user is strongly discouraged from making any changes to the model or policy (and is prevented from exiting RiverWare) while RPL execution is paused. |
Stop |  | Shift+F5 | Abort RPL execution. If in a run, stop the run at the next available opportunity. The user is not presented with the usual abort run notification message but a green diagnostic is posted. |
Continue |  | F5 | When execution is paused, continue execution until one of the following occurs: • A breakpoint is reached. • The user requests another pause or stop event. • RPL execution terminates normally. |
Step |  | F10 | When execution is paused, continue execution and pause at the next legal spot for pausing execution which is at an equal or lesser depth in the call stack. If paused at a statement, this will continue to the next statement. |
Step Into |  | F11 | When execution is paused, continue execution and pause at the next legal spot for pausing execution including any functions called. |
Step Out |  | Shift+F11 | When execution is paused within a function, continue execution and pause at the next legal spot for pausing execution which is at a lesser depth in the call stack (i.e., continue to the next pausable location in the calling function). |
Cont. to Sel. |  | F12 | When execution is paused, continue execution until the selected RPL expression is about to be executed (or execution is interrupted for some other reason, e.g., another breakpoint). This action is functionally equivalent to: set breakpoint before selection, continue, remove breakpoint |
Show Button Labels | Show the labels on the toolbar buttons. (shown above) |
The control toolbar can be repositioned within the dialog or detached and displayed outside of the dialog. By default, the buttons are unlabeled, but text labels can be displayed by selecting Debug, then Show Button Labels. All of the control actions are also available via the Debug menu or by keyboard shortcuts. For the most part, the shortcuts are the same as those used by Microsoft Visual Studio for the comparable action.
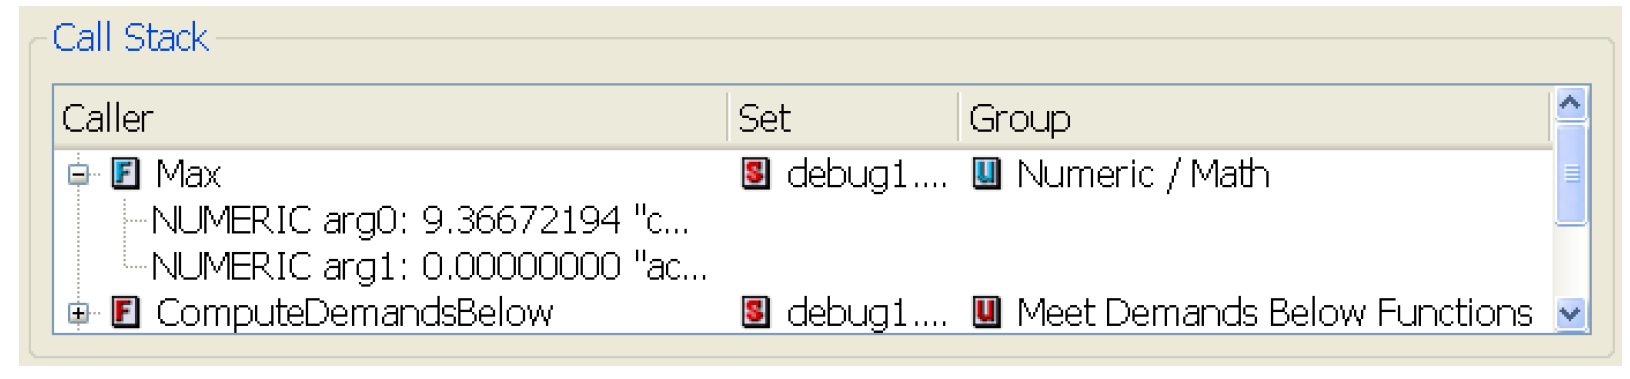
Call Stack Panel
When RPL execution is paused in the debugger, the Call Stack panel describes the current execution location. The display is a treeview list of the items which have are currently executing. Double-clicking an item in a row in this list opens the associated editor. For each item in the call chain, its Caller, Group, and Set are listed. For functions, the argument types, names, and values are displayed as optionally displayed children of that row. Figure 4.7 illustrates.
Figure 4.7
Breakpoints Panel
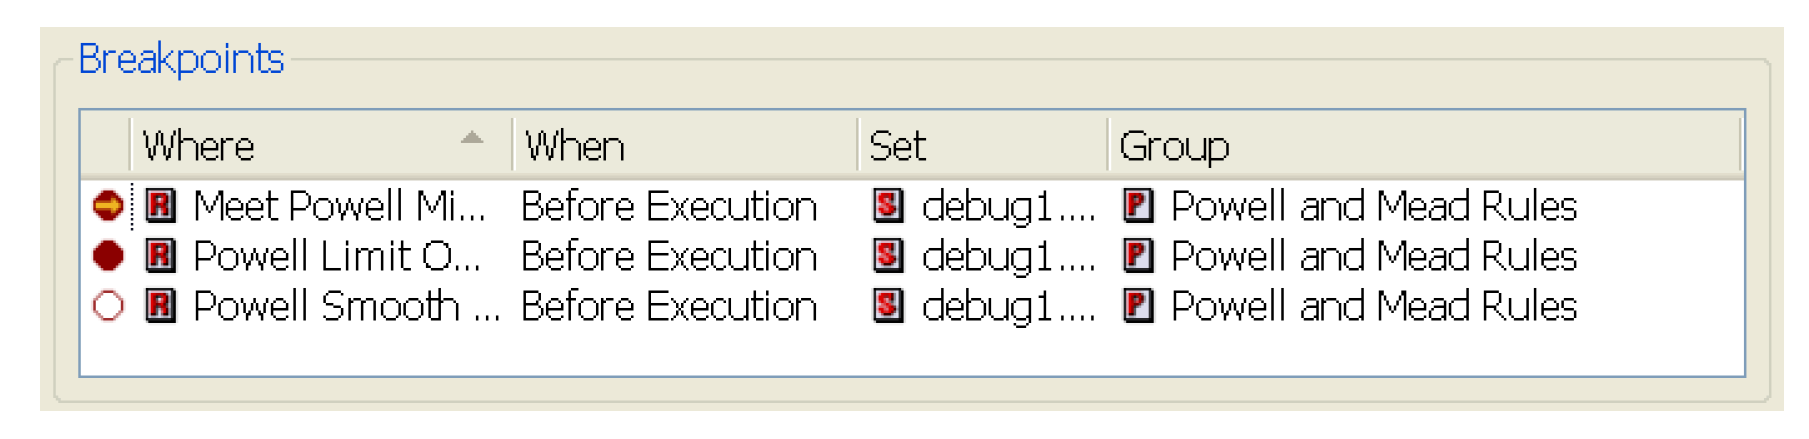
The Breakpoints panel lists locations at which the user has requested that execution regularly pause. Double-clicking a row opens the editor for that item. For each breakpoint, the panel displays the following:
• Icon. Red octagonal breakpoint indicator, filled indicates that it is enabled  , unfilled indicates disabled
  . Selecting the stop sign indicator will enable/disable the breakpoint.
, unfilled indicates disabled . Selecting the stop sign indicator will enable/disable the breakpoint.• Where. Name of the item containing the breakpoint. The breakpoint name includes an identifier which indicates the statement with which the breakpoint is associated. It is a hierarchical ID which looks like: <block/rule priority>.<statement index>.<statement index>.
E.g., for the screenshot below which has two statements, for the first statement in rule 9, the Where column says: “Green Valley Diversions (9.1)”.
• When. If it will break before or after execution of that item.
• Group. Group (where applicable) that contains that item.
• Set. Set (where applicable) that contains that item.
The list may be sorted based on any column; initially it is sorted based on the name of the item containing the breakpoint. Also the columns may be rearranged by dragging the column label.
When RPL execution pauses at a breakpoint, the associated row in the Breakpoints Panel is scrolled into view. While execution is paused at a breakpoint, the breakpoint indicator contains a yellow arrow (the debug cursor)  .
.
.Breakpoints can be created and deleted within the RPL editor for the corresponding item; see Sample Use Scenarios for details. Within the RPL Debugger dialog, they can be deleted and/or temporarily disabled/enabled using the Breakpoints menu. Also, selecting the stop sign indicator will enable/disable the breakpoint. Breakpoints are persistent (saved with the RPL item which contains the breakpoint).
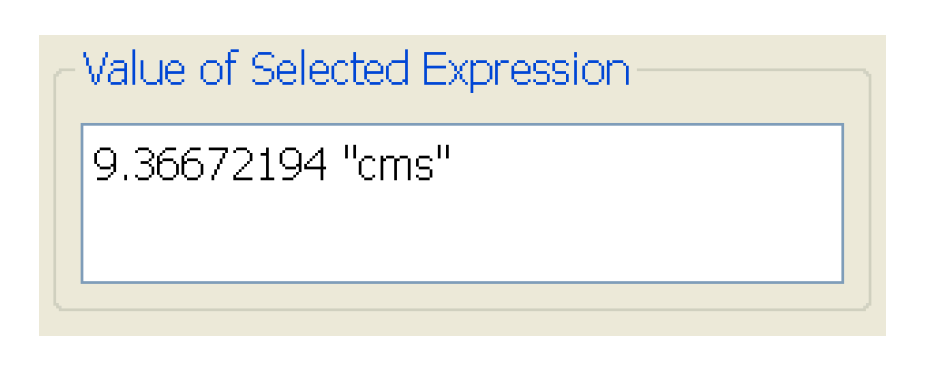
Value of Selected Expression Panel
When paused or after a run, the Value of Selected Expression panel displays the value of the selected RPL expression. See Displaying Data Values for details.
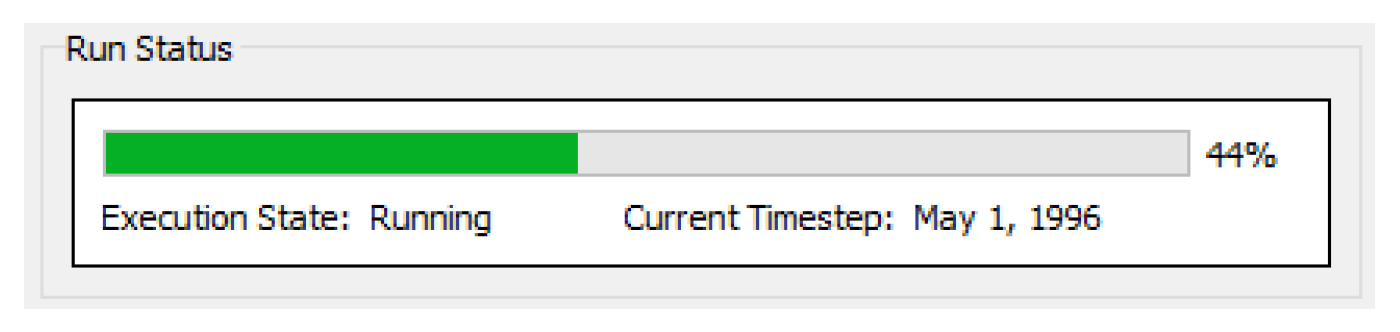
Run Status Panel
The Run Status panel at the bottom of the debugger shows the overall status of the run. This information is also shown on the Run Control / Run Status dialog. The panel in the debugger provides easy access to the current controller timestep.
Using the RPL Debugger
Following is a description of how to use the RPL Debugger. In general, the approach is: add breakpoints, start execution, execute to the breakpoint and pause, investigate values at that breakpoint, continue or step to the next location of interest, and continue looking at values and stepping/continue until satisfied. The process becomes more complicated when you wish to investigate the values at one timestep or location within a long run. See Sample Use Scenarios for a description of this scenario.
Adding Breakpoints to RPL Dialogs
As discussed earlier, RPL execution can be paused at the following locations:
• Before a statement in a rule, optimization goal, or user-defined accounting method is executed
• After all statements in a rule, optimization goal, or user-defined accounting method have executed
• Before a function’s body expression is evaluated
• After a function’s body expression is evaluated
• Before an expression slot’s expression has evaluated
• After an expression slot’s expression has evaluated
Setting a breakpoint at a particular location will cause execution to pause each time that location is reached. When debugging is enabled, RPL dialogs displaying a location at which RPL execution might pause (rule, function and expression slot dialogs) display a margin on the left in which debugging indicators are drawn. RPL frames in which it is not possible to pause RPL execution (e.g., rule execution constraint frames) never show a margin for debugging indicators.
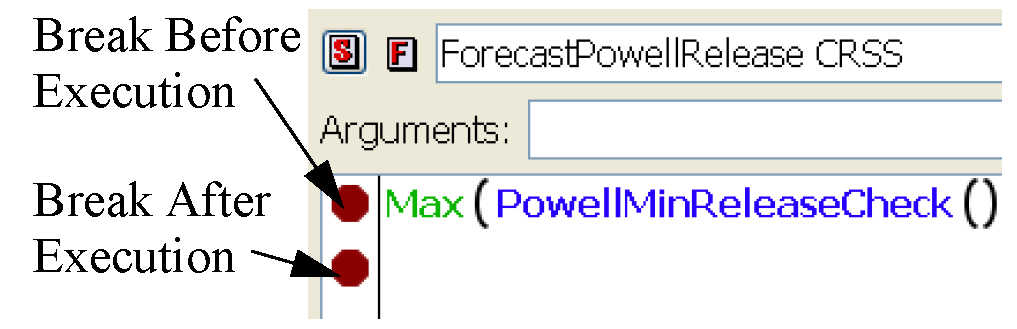
Selecting the margin adds a breakpoint (break before) at that location if there is not one already; disables it if there is an enabled one, and deletes it if there is a disabled breakpoint. That is, selecting the margin cycles through three states, enabled, disabled, and deleted. If the select location is below the statement or functions, then a break after breakpoint is added at that location.
Breakpoints may also be added/removed from the selected expression using the Rule/Methods/Goal(block), then Break Before/After Execution menu actions. When a RPL expression is selected, it is only possible to add a break point before that selection. In this case, RiverWare adds the breakpoint before the statement (assignment, if, ForEach, etc.) containing the selection. Otherwise, for the entire block, Break Before applies to the first statement and Break After applies to the last statement. The Break Before/After Execution menu items of the RPL editor dialogs are enabled and toggled based upon the RPL selection and contents of the dialog (as well as whether or not debugging is enabled).
Note: The debugging indicators are sized to match the font, which may be changed in the RPL Layout dialog.
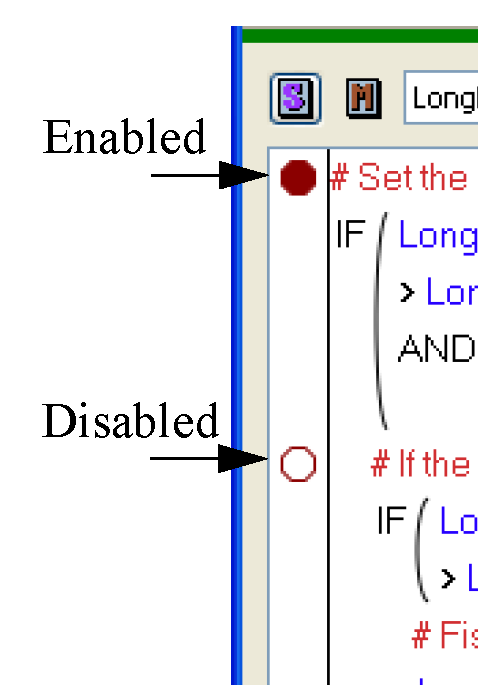
If there is a breakpoint associated with a given location, a solid red octagon is drawn in the debugging margin (unfilled red octagon for disabled breakpoints). For blocks, the breakpoint indicator is associated with a specific statement or appears just below the last statement (indicating a breakpoint which is activated after the last statement has executed). Figure 4.8 illustrates.
Figure 4.8
For functions, the breakpoint indicator appears in the function editor and appears at the top of the expression body for a before execution breakpoint and just below the body for an after execution breakpoint. Figure 4.9 illustrates.
Figure 4.9
Starting the Debugger
To start the debugger, initiate execution in the standard way depending on the set to be debugged. That is:
• Rulebased simulation ruleset: Start a rulebased simulation run.
• Optimization policy set: Start an optimization run.
• Object level user defined accounting method set: Start an accounting run.
• Initialization Rules: Start a simulation or rulebased simulation run.
• Iterative MRM Ruleset: Start an iterative MRM run.
• Expression slots: Start a run or evaluate the expression slot(s) manually.
The RPL execution will begin and the RPL debugger will pause when it hits a breakpoint or is paused.
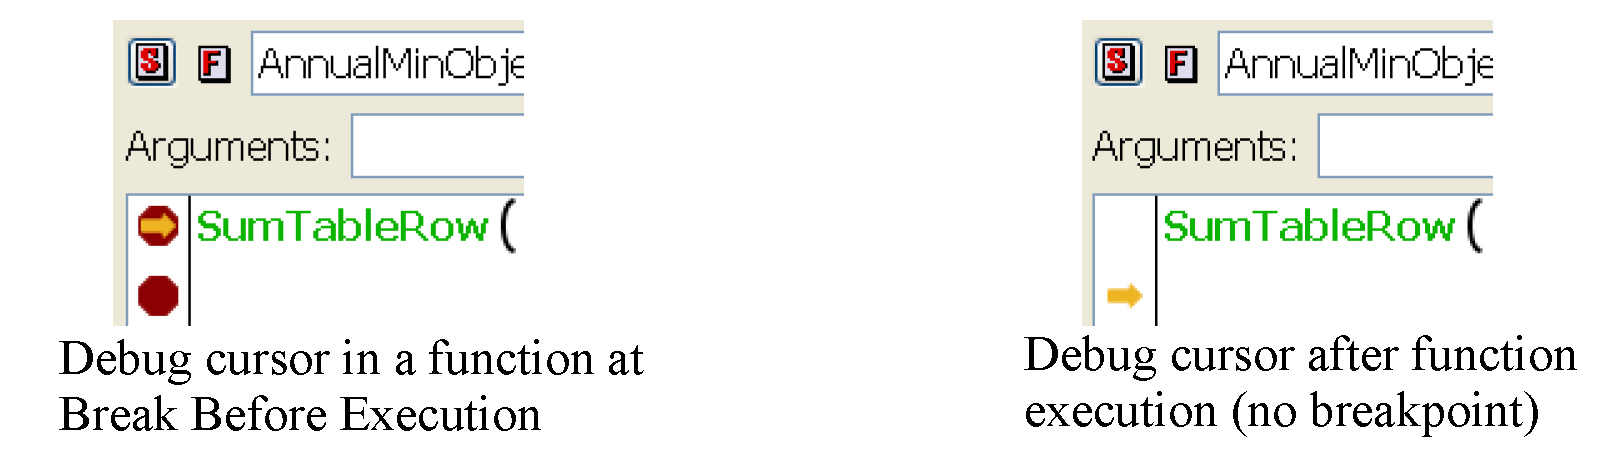
When RPL execution is paused, a yellow arrow called the debug cursor  , is shown in the RPL dialog margin to the left of the statement or expression at which execution is paused. Typically this indicates that the indicated statement/expression is just about to be evaluated.
, is shown in the RPL dialog margin to the left of the statement or expression at which execution is paused. Typically this indicates that the indicated statement/expression is just about to be evaluated. Note: When paused after execution of a function or the last statement of a block, the debug cursor will not be pointing to a specific function/statement but will appear at the bottom of the dialog, as shown in Figure 4.10.
Figure 4.10
Displaying Data Values
When RPL execution is paused in the debugger, the user can interact with most RiverWare dialogs to examine the current state of the system. The values of interest during a run are the values to which expressions (including sub-expressions, i.e., expressions within expressions) have evaluated, as well as the values assigned by assignment statements. In many debuggers, the user enters the variable for which they want to see the value. Since RPL expressions are not named, the user can not pick an expression for display by entering its name or by selecting it in a list of expression names; rather the most straightforward method is to select the expression in the RPL editor in which it is displayed. Once selected, there are two ways to look at the value of the selected RPL expression:
• Using the Value of Selected Expression panel in the debugger
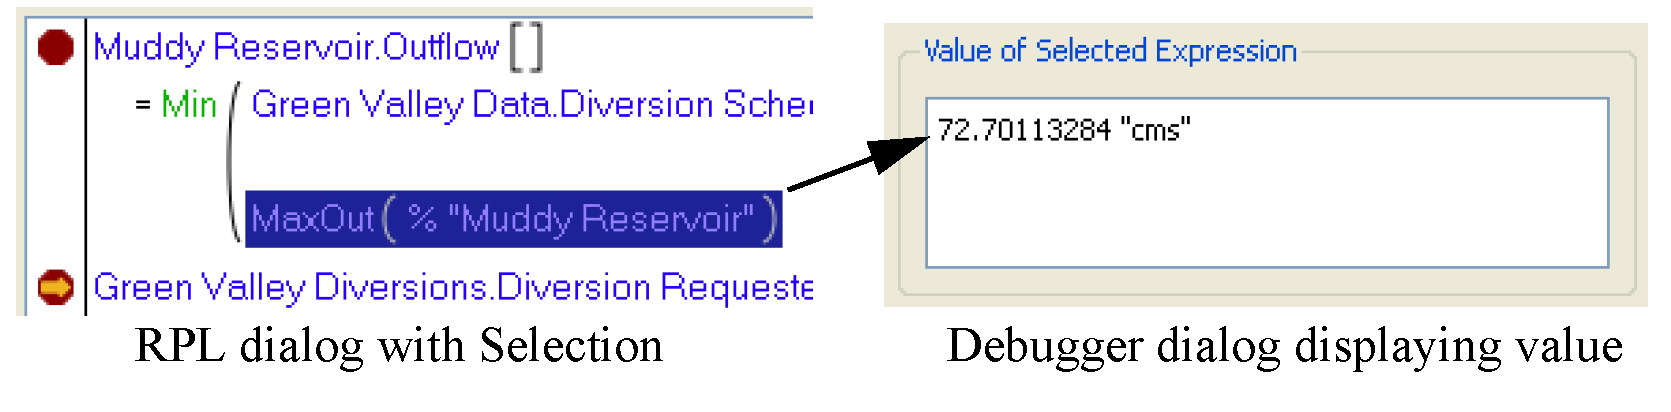
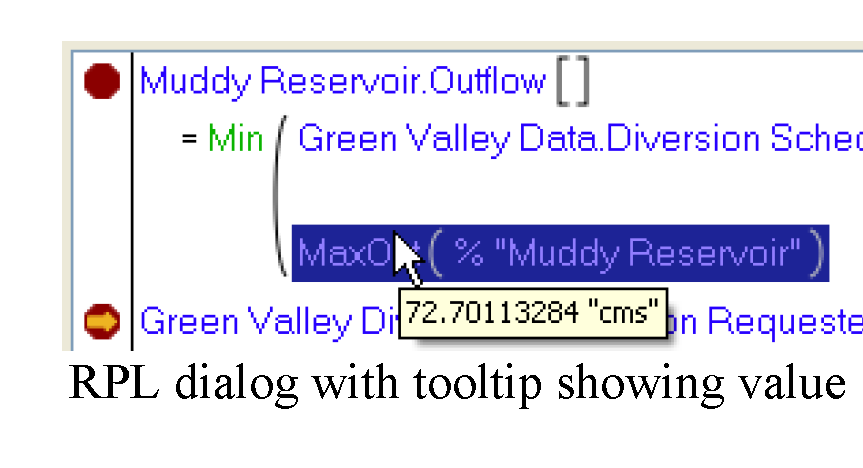
• Using tooltips on RPL dialogs. Tooltips are shown by hovering over the selected expression.
Data Value Units
The value displayed uses the settings in the Unit Schemes; see Unit Schemes in User Interface for details. Whenever a RPL value is displayed in the debugger or in tooltips, RiverWare uses the units defined in the scheme. But, for monthly and annual values, it is sometimes not known within the debugger for which timestep the value is associated. In that case, monthly values assume there are 31days in the month. Annual values assume 365 days in the year.
Stepping, Continuing, and Pausing
Once paused, the user can investigate the values of expressions and then continue on to other breakpoints, step, step into, step out, or continue to selection. These actions are available on the RPL debugger toolbar, menu choices, and keyboard accelerators; see Control Toolbar and Debug Menu for details.
Also remember that within a run, there are two types of stepping and pausing:
• From the RPL debugger and
• From the Run Control dialog.
For example, within a rulebased simulation run, you select Step on the Run Control to advance the timestep, use the RPL debugger to break in a rule, step through that rule in the RPL debugger and then select Continue on the RPL debugger. The timestep then finishes and the Run Control will pause before the next timestep.
Limitations
There are a few limitations that are imposed by the debugger:
1. Because you are in the middle of executing a RPL item, it would be problematic to delete an object or close RiverWare. Thus, when RPL execution is paused in the debugger, RiverWare prohibits many user actions, such as:
• Exiting RiverWare
• Closing a RPL set
• Clearing the workspace
• Loading a model
2. The debugger will not display the value of the entire left hand side of an assignment statement. Technically, the left hand side is not evaluated, it receives the value to which the right hand side evaluates, so it does not have a value to display. If you wish to see the value that will be assigned, highlight the entire right hand side. Note sub-expressions on the left hand side of an assignment are evaluated, and are available for display (after the statement has been executed).
3. As discussed earlier, enabling debugging incurs performance costs in both memory and CPU usage. The exact impact is highly model- and machine- dependent, but most user can expect to see less than a 25% slowdown in RPL execution time.
Error Handling
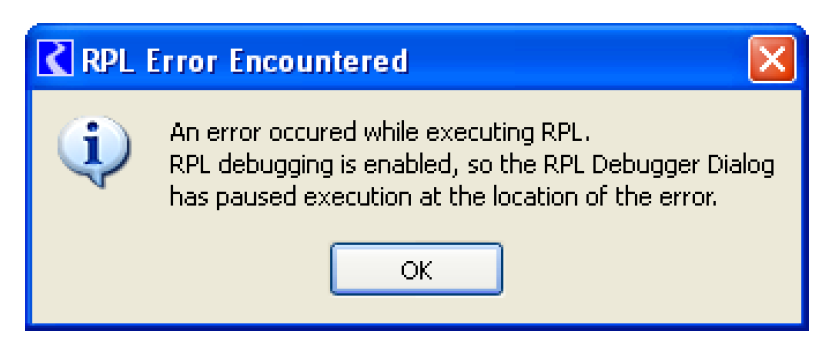
If an error occurs during RPL evaluation with debugging enabled, the user is presented with an informational dialog and execution is paused in the debugger. The RPL editor containing the location of the error is raised and the debugging cursor indicates the location of the error. This could be one of the following:
• A statement in a block
• The body of a function
• The expression of an expression slot.
RPL execution is paused as soon as the error occurs, and an informational dialog is presented to the user. This happens even before an error has been posted to diagnostics, however all of the relevant information concerning the error is displayed within the debugging dialog:
• The call stack contains the items being evaluated at the time of the error
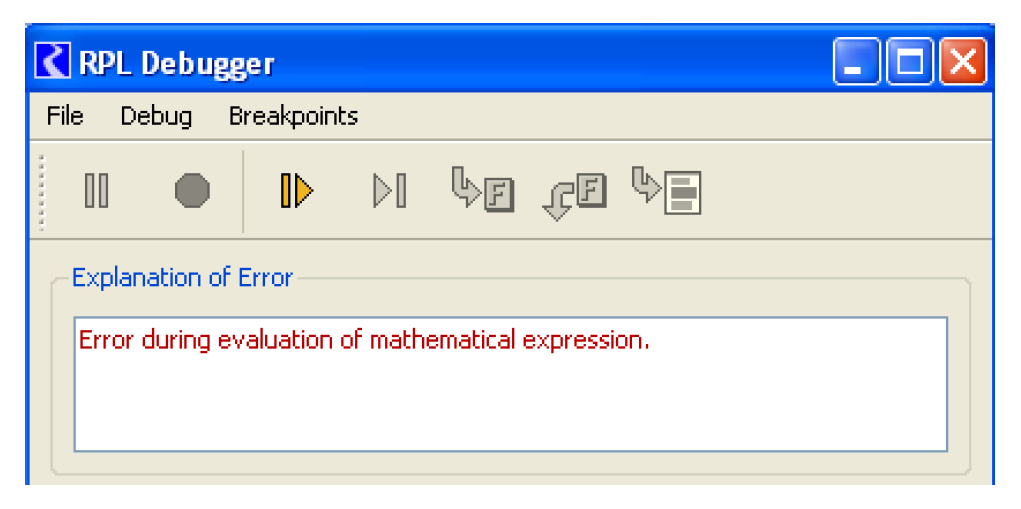
• A panel is displayed with the label Explanation of Error which provides an explanation of the error and a textual version of the RPL expression at which the error occurred. This panel is hidden unless there has been an error.
The only action possible through the debugger when the run has been aborted is to continue execution, which will post the error diagnostic and abort the run as usual. 
Sample Use Scenarios
In this section we present a few example scenarios that illustrate different ways to make use of the RPL debugger.
RPL Debugger Scenario 1
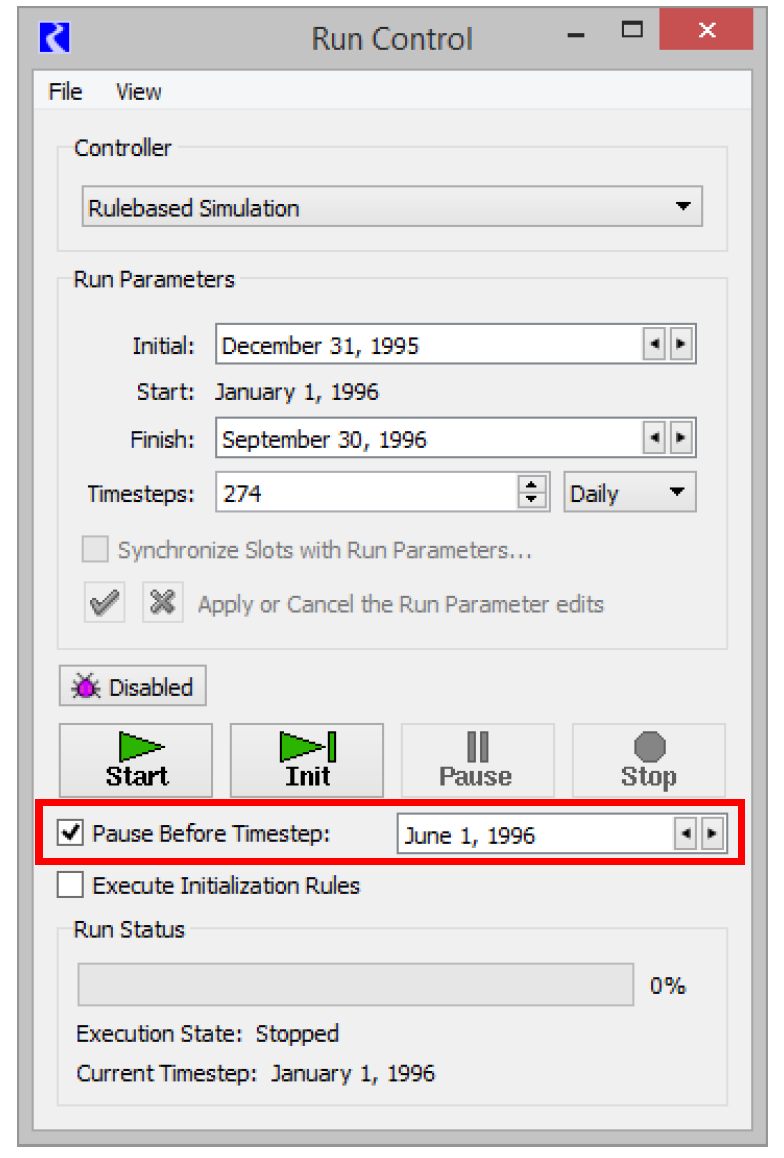
The Run Control dialog allows user to specify a timestep/goal at which to pause the run. This is useful for longer model runs when you wish to look at execution on a specific timestep. The following is a possible debugging scenario:
1. Disable RPL debugging; see Enabling RPL Debugging.
2. Configure the Run Control to pause before the desired date, as shown in Figure 4.11.
Figure 4.11
3. Start a run and let it run until it pauses at the timestep indicated.
4. Enable RPL debugging.
5. Set up breakpoints as needed. This could actually be done at any point. In the initial part of the run, RPL debugging is disabled, so the breakpoints have no effect.
6. Continue or step the run from the Run Control.
The run proceeds until a breakpoint is reached.
7. Examine RPL values as desired and use the debugger’s Step and Continue buttons to control RPL execution.
8. When finished, delete or disable breakpoints and continue in the RPL debugger and in the Run Control to finish. Or, select the Stop button in the debugger to stop RPL execution and end the run.
RPL Debugger Scenario 2
Because the debugger catches RPL errors and displays the exact location of the error, it can be used in the RPL development process to catch run time errors. For example, when running a model where you just made a lot of RPL changes and you wish to catch runtime errors, use the following steps.
1. Enable debugging but do not set any breakpoints.
2. Run the model or execute the policy.
The model runs, and if a RPL error occurs the RPL debugger will pause execution.
The debugger will display an explanation of the error and open the dialog indicating the location of the error; see Error Handling for details.
3. Determine what the error is by using debugging tools.
4. Select Continue in the debugger and the run will stop.
5. Fix the error in the RPL dialog.
Note: The error message is repeated in the diagnostics output.
Revised: 01/04/2021