
Release Notes Version 6.9
This document describes new features, enhancements, and changes in RiverWare Version 6.9.
Documentation Searching
A more accessible and faster search utility was added to the RiverWare documentation. To fully use the search utility, use the latest version of Adobe Acrobat Reader, DC. This free PDF reader is available from Adobe. Additional information on the search utility and a Quick Guide of the help system can be found HERE (HelpOverview.pdf).
Data Management Interface
Year Mapping Groups
A Year Mapping Group allows you to import data from the specified years in your database to years in your run. Previously this was limited to a run that began on January 1st and ended on December 31st. Now the run can start and finish on any day in the year. As before, only daily timestep models are supported. For more information, see “Year Mapping Groups” in Data Management Interface (DMI).
Objects
Control Point
A new method called Compute Aggregate Coeffs every Timestep was added to the Control Point's Variable Routing Coefficients category. The new method populates the Computed Routing Coefficients table slot at the start of every timestep. This was implemented as the existing Compute Aggregate Coefficients method re-computes the coefficients only when the flow is above the lowest threshold in all upstream reaches. Otherwise it copies the values in the Routing Coefficients slot. The new method computes the coefficients for any flow condition. For more information, see “Compute Aggregate Coeffs every Timestep” in Objects and Methods.
Soil Moisture Method Improvements
Enhancements were made to the soil moisture methods on the Agg Diversion Site and Water User as described below.
Agg Diversion Site
On the Agg Diversion Site, the following enhancements were made:
• Dispatch method names were modified with better names.
• A new dispatch method, “Process Sequential given Depletion Requested” in Objects and Methods, was added to Process Sequential given Depletion Requested.
Water User
On the Water User, the following enhancements were made:
• A new Return Flow method, Variable Efficiency with Soil Moisture (“Variable Efficiency with Soil Moisture” in Objects and Methods, was added to compute return flow using an efficiency based approach that also includes soil moisture storage. The Supplement Diversion including Soil Moisture was also modified to behave correctly when this new efficiency based return flow method is selected.
• With the Irrigation Requests with Soil Moisture method, a modification was made to compute the Depletion Requested at the beginning of timestep for the current through N future timesteps. This allows the water user to solve for a number of future timesteps, as defined on the Soil Moisture Future Timesteps slot.
• Dispatch method names on the Water User were modified with better names.
• A new dispatch methods was added to the Water User to solve given Depletion Requested. When the Irrigation Requests with Soil Moisture method is selected, the available dispatch methods are now:
– Solve (Stand Alone or Sequential) given Depletion Requested
– Solve (Stand Alone or Sequential) given Diversion
• Slots were added to the appropriate soil moisture methods to model
– Excess Effective Precipitation
– Consumptive Use from Delivered Flow
– Consumptive Use from Soil Moisture
– Consumptive Use from Supplemental
– Efficiency including Soil Moisture.
Optimization
With Reward Table Statement
A new statement type is available for Optimization goals: With Reward Table. The statement can be added within a Summation soft constraint set. It allows a piecewise linear reward function to be applied to satisfaction variables within the objective to maximize the satisfaction of the soft constraints. Conceptually this can be thought of as applying a penalty function on violations. For example, it could be used to minimize the sum of squared violations. Applying an appropriate reward function within a Summation objective tends to improve the solution quality by “smoothing out” violations at a smaller magnitude over longer time periods whereas the standard Summation solution tends to concentrate larger violations on a few time periods. The reward function is expressed in a table slot that is provided as an argument to the With Reward Table statement. For more information, see “With Reward Table” in Optimization.
Improved Percent Satisfaction Reporting
Previously there were cases in which the percent satisfaction reported for a goal could be higher than the actual percent satisfaction from the user’s perspective. This is because RiverWare skips the addition of a constraint to the optimization problem when it will not change the solution. This most often occurs when a lower priority constraint has the same left-hand-side as a higher priority constraint that was already frozen. In these cases, the satisfaction reporting would only report on the constraints that were formally added to the optimization problem at that priority; it would not account for the constraints that were omitted. Thus it was possible for a goal to report 100% satisfaction even though, from the users perspective, there were constraints at that priority that were violated. The percent satisfaction reporting for these cases has been improved in the following manner:
• For Summation soft constraint objectives, RiverWare now reports the average satisfaction as if the skipped constraint(s) were included, i.e., percent satisfaction is defined from the user’s perspective.
• For Maximin and Repeated Maximin soft constraint objectives, if a constraint was skipped and would have been violated at that priority, the satisfaction will be flagged with a tilde (~) to indicate that the satisfaction from the user’s perspective is actually lower than what is being reported. For example a satisfaction reported as ~100% will indicate that there were actually violations at that priority.
This improved satisfaction reporting applies to diagnostic messages, the Priority-oriented Optimization Solution Analysis Tool (POSAT) and optimization analysis CSV files exported from POSAT.
Tailwater Base Value Infeasibility Fixed
In some cases, Tailwater Elevation values calculated in Simulation were causing an infeasibility in Optimization. This occurred for the Opt Linked or Input method when an upstream Power Reservoir Tailwater Base Value was linked to a downstream Pool Elevation, and the upstream reservoir dispatched in Simulation while the downstream reservoir did not dispatch. The resulting Tailwater Base Values were based on earlier time step Tailwater Elevation values and, due to the link, resulted in Pool Elevation values downstream that were inconsistent with the flows. This behavior has been modified for the Opt Linked or Input and Opt Base Value Only methods in the Optimization Tailwater category.
Output: Charts, Model Reports, and Plotting
Charts
For more information on any of these Chart enhancements, see “Chart” in Output Utilities and Data Visualization.
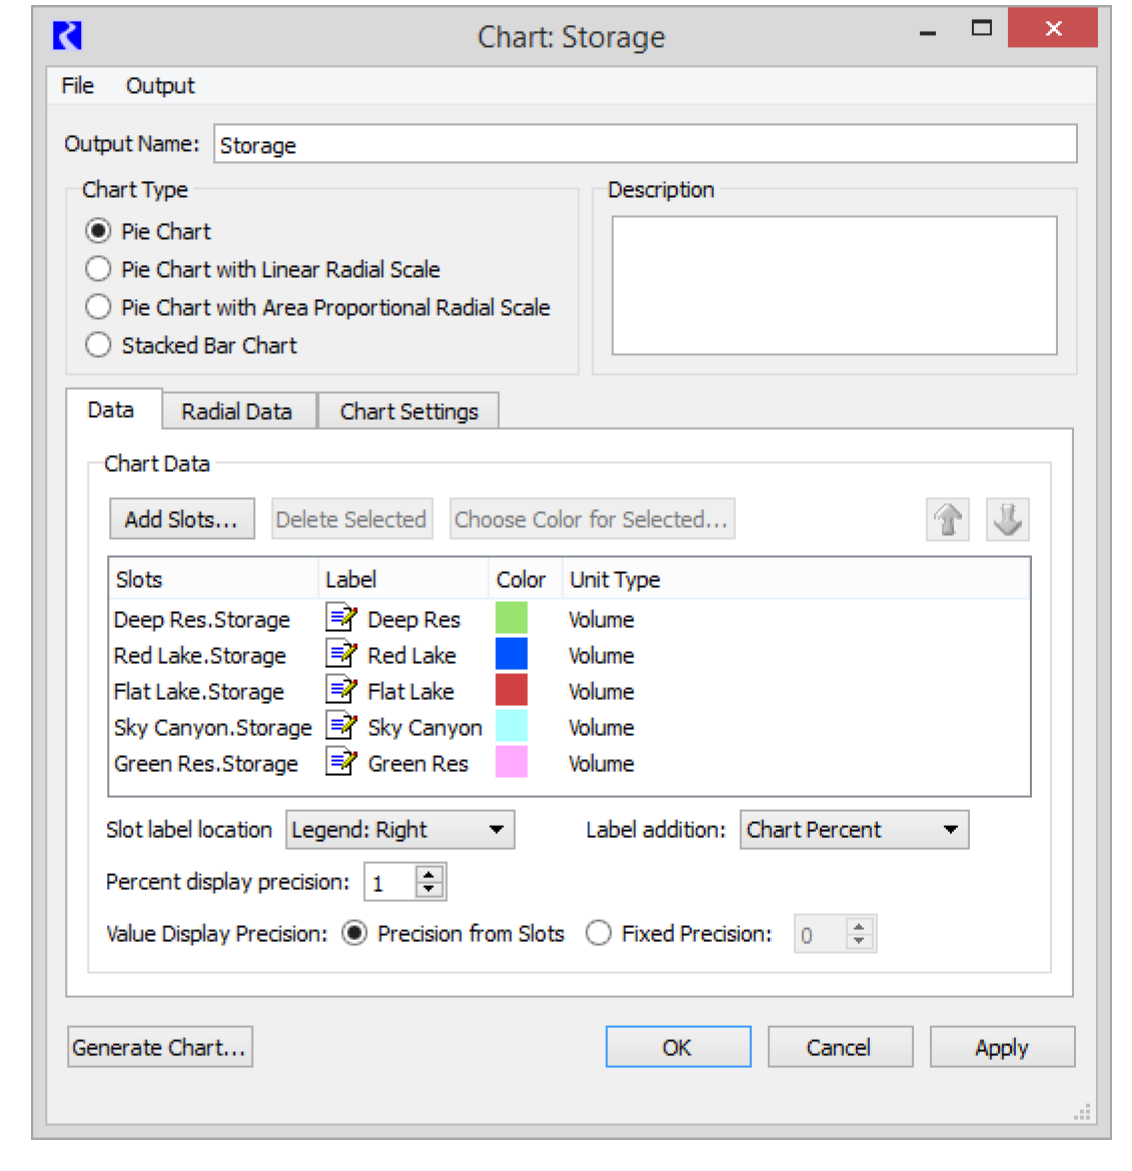
Configuration Dialog Reorganization
The Chart configuration dialog was reorganized into three tabs to reduce the overall size of the dialog. The tabs are Data, Radial Data, and Chart Settings.
Stacked Bar Chart
A new stacked bar chart type was implemented as shown in the screenshot to the right. This new type of chart shows negative values much better than the existing pie chart.
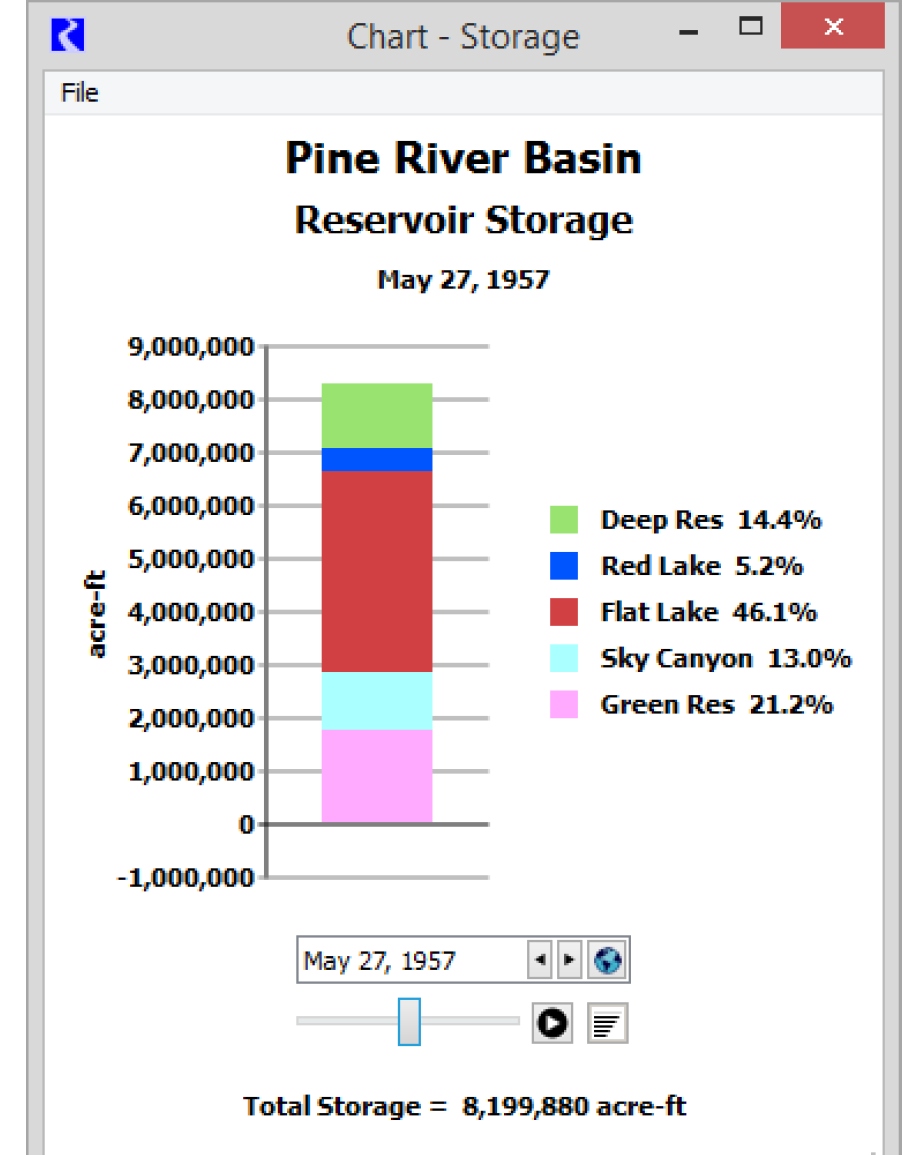
Labels or Legend Location
For charts, you can now choose to label items using a separate legend. For each chart, you choose from the following labeling options:
• Legend: Right (shown)
• Legend: Below
• Legend: Lower Left
• Legend: Lower Right
• Label Pie Slices (for pie charts only)
Model Reports
Model Reports, “Model Report” in Output Utilities and Data Visualization, allow you to generate a customized HTML document describing various aspects of a model including the configuration, RPL policy, slots, and plots. The model report utility was enhanced as follows:
• Two new slot items were added:
– Scalar Slot Grid: shows as grid of scalar values with objects as rows and slot names as columns.
– Periodic Slot Table: shows a table of periodic slots, where columns are distinct Periodic Slots. All periodic slots have the same period, but possibly different sets of intervals.
• The Slot item for slots computed by RPL expression now shows the expression formula in addition to a time series plot for series or the value for scalar slots.
• A new item Link Table was added to show a table of the physical links.
• A new item RPL Rule/Goal was added to show individual RPL Rules or Goals added.
Plotting
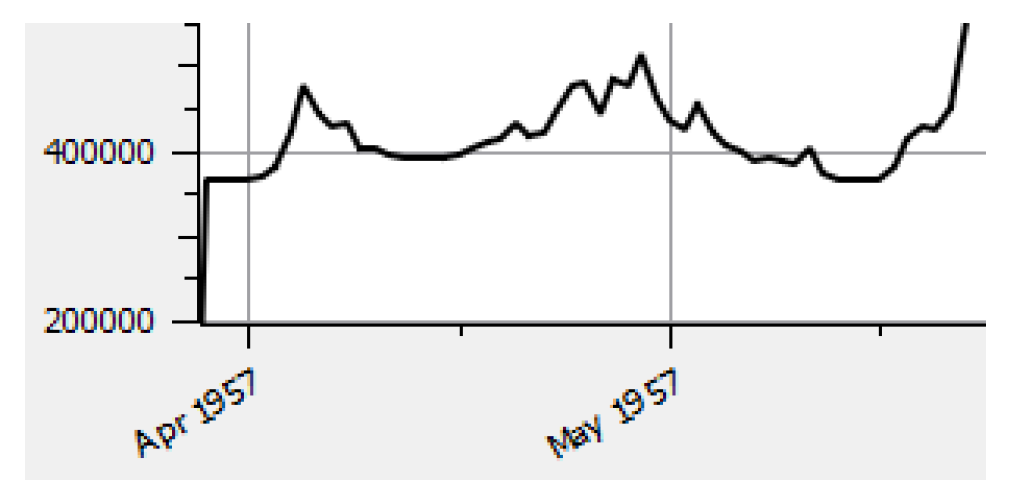
Axis Label Rotation
On plot axis, you can now rotate text labels, individually on all four axes. Rotation is supported in both directions to 30, 45, and 90 degrees. The screenshot to the right shows the dates rotated 30 degrees counterclockwise.
Date Time Formats
For axes that have Date/Time units, you can now configure the format of the Date/Time. This is supported with three distinct format selection algorithms: Automatic, Fixed and Varied. For example, the screenshots to the right and above right shows a Fixed Month Year configuration.
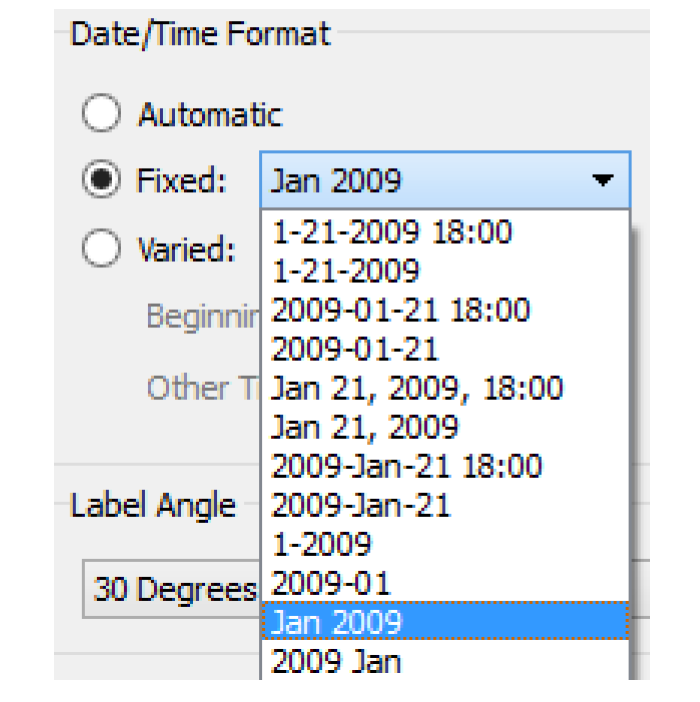
See “Plot Page Settings” in Output Utilities and Data Visualization for more information.
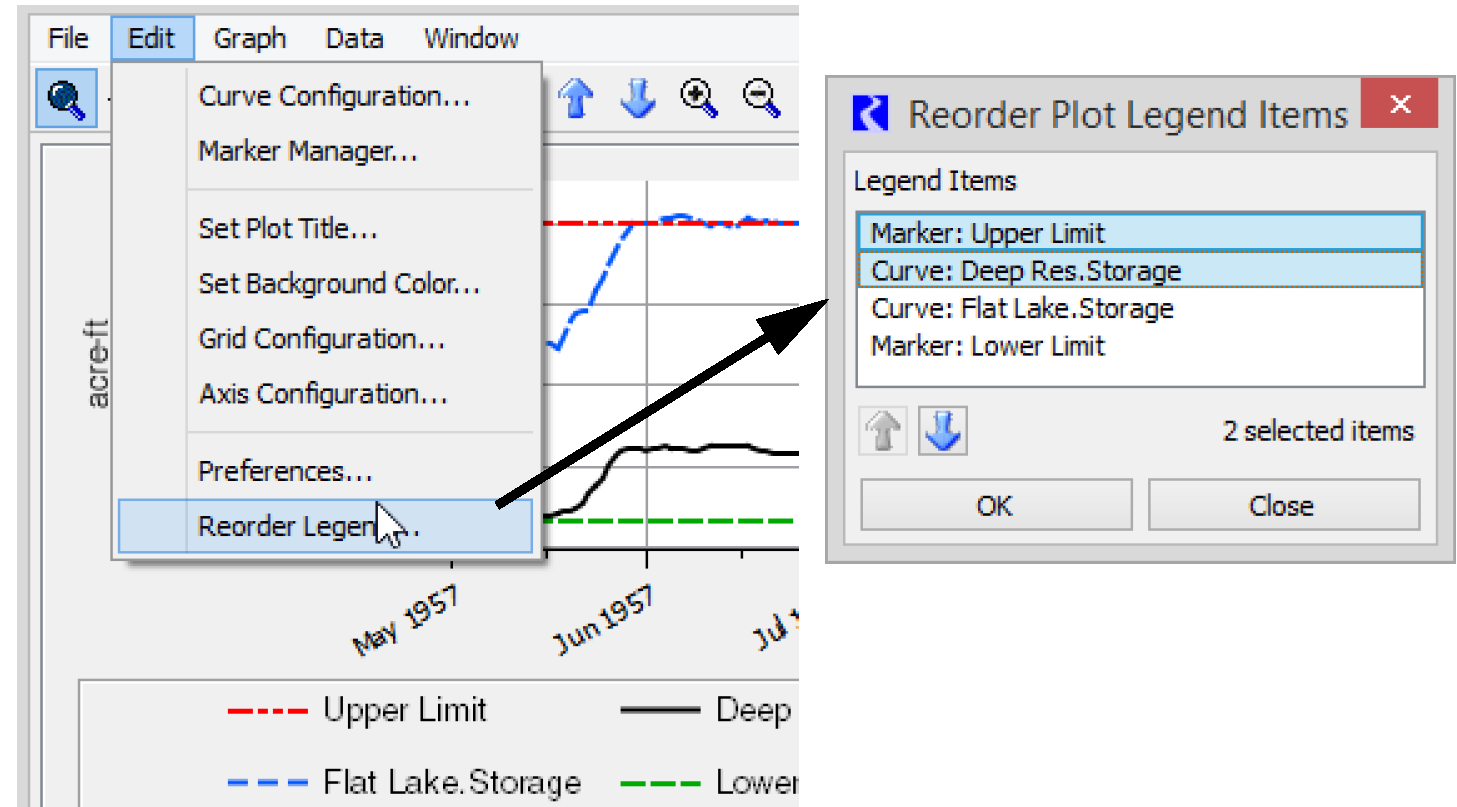
Legend Reorder
Plot legend items, for slot curves and markers, can now be reordered. A Reorder Legend... menu item appears in the Edit menu and in the context menu for slot curve and marker legend items.
Script Management
Set Dataset File Action
A new action, SetDatasetFile, was added to the Script Manager. This action sets the file path for the specified DSS or Excel Dataset. More information can be found “Set Dataset File” in Automation Tools.
SCT
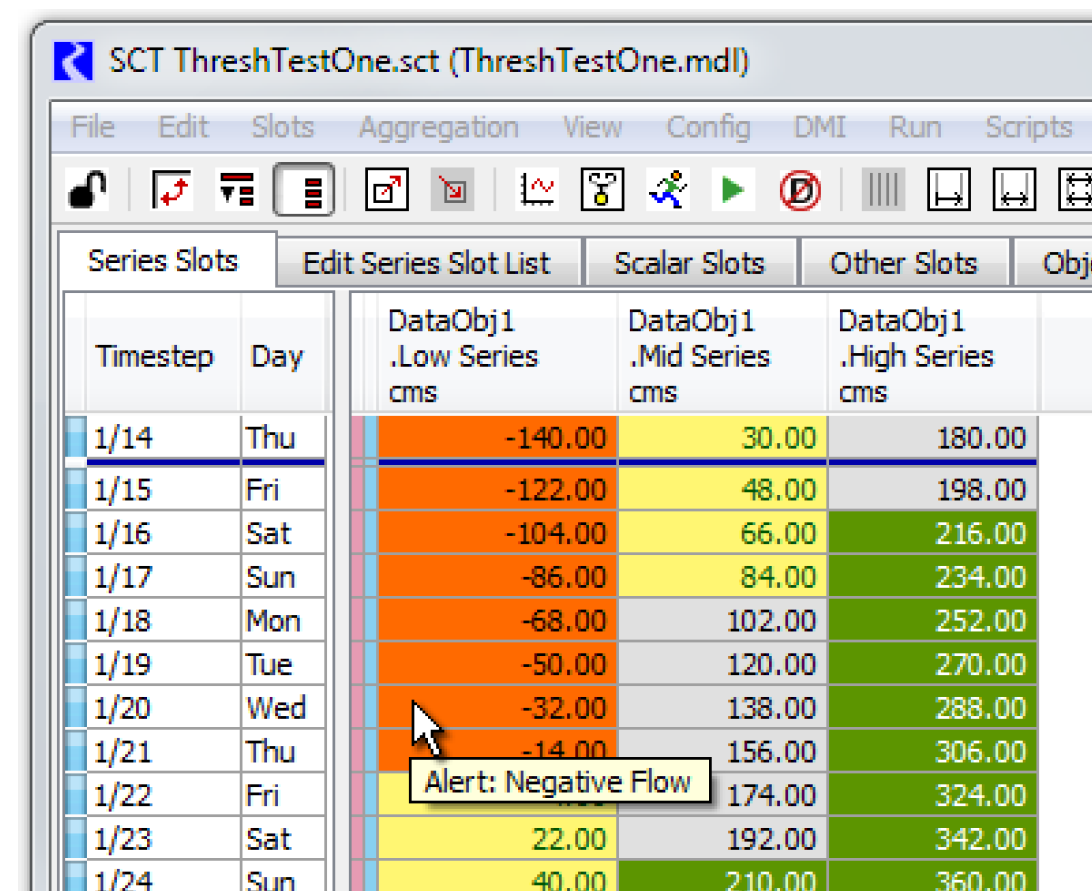
Color Alerts / Conditional Formatting
The System Control Table (SCT) was enhanced to support coloring of individual cells based on the numeric value compared to user defined intervals. The set of value intervals and the associated cell colors can be specified individually for each series slot in the SCT. Each interval can be associated with a custom color specification (a foreground/background color pair) or the default color indicating flag value. Following is a sample screenshot showing four different color definitions.
For more information, see “Configure Color Alerts” in User Interface.
Water Quality
Total Dissolved Gas (TDG) modeling
Water Quality methods have been added to Reservoirs, Reaches and Computational Subbasins to model Total Dissolved Gas (TDG) in both Simulation and Optimization. High TDG concentrations can reduce the population of some fish species. These effects are most pronounced in the tailwater of reservoirs during spill operations. The TDG concentrations are increased by spills; the turbulent nature of the spill creates air bubbles that are then forced deep into the tailwater. The deep water has higher pressure which cause gases in the bubbles to dissolve in the water. Once dissolved, the gas propagates downstream.
For more information, see “Total Dissolved Gas Methodology” in Water Quality.
Workspace
Import Cluster Configuration
The grouping of simulation objects into Object Clusters can now be replicated from one RiverWare model to another RiverWare model.
Export the objects including the clusters from one model and then import them into another more. The workspace Import Objects operation now supports two modes of operation for Object Cluster Import. The choices are:
• Import member objects and cluster configuration
• Import cluster configuration only
Improved Zooming
Better zooming has been implemented on the Simulation and Geospatial workspace views. Simulation object icons and their attached labels are scaled only when zooming out to see a broader view of the model.When zooming in beyond the standard zoom level of 100%, icons and labels remain zoomed at 100%. This allows you to see more detail around closely clustered objects without showing large pixelated object icons.
Closed Bug Reports
The following bugs have been closed for this release. For more information on any bug, see the CADSWES website. The bugs are listed in order by bug number:
ta
5404 | 5608 | 5700 | 5704 | 5705 | 5706 | 5708 |
5709 | 5711 | 5712 | 5715 | 5717 | 5719 | 5721 |
5723 | 5726 | 5728 | 5730 | 5731 | 5732 | 5734 |
5736 |
Revised: 11/11/2019