
Release Notes Version 4.2
Special Attention Notes
• If the text or graphics in this file are not clear, you may need to print this document. Resolution should improve on the printed page.
• RiverWare now uses new plotting for both the Windows and Solaris platforms. The plotting tool was developed at CADSWES using the new Qt GUI package. Detailed documentation of the new plot tool is included in the online help (not in this file). CADSWES is open to any suggestions or questions that you may have concerning the new plotting tool.
RiverWare for Windows 2000 and Windows XP
RiverWare is now available and supported for Windows 2000 and Windows XP (it will also run on NT but CADSWES is supporting Windows 2000 and XP). The user should be aware of the following differences that exist in RiverWare for Windows:
Differences in RiverWare for Windows
• Middle-mouse features such as QuickLink or rearranging the rows in the run analysis dialog are activated with the combination (pressed in this order): Alt + right mouse button + left mouse button. In Windows, the mouse configuration can also be changed so that middle mouse button actions are executed with the right mouse button (this would avoid the awkward sequence mentioned above).
• QuickLink can also be activated using the right-mouse button.
• The Windows DMI executable can be a DOS batch file or any other windows executable that can be run directly from a command shell.
Problems/Bugs in RiverWare for Windows
• The Locator View window often gets in a bad state when you resize the main workspace.
• It is possible that the objects may get shifted off the workspace if the workspace window is resized in certain ways. In order to make the objects visible again, you must save the model then reload it. Reloading the model will shift the model so that all objects are visible on the workspace.
Saving Model Files and Rulesets
• When saving model files or ruleset files that you intend to move between windows and unix systems, always save with the .gz extension. This saves the model/ruleset in a binary format that is the same on windows and unix.
New Plotting
• RiverWare now uses new plotting for both the Windows and Solaris platforms. The plotting tool was developed at CADSWES using the new Qt GUI package. Detailed documentation of the new plot tool is included in the online help (not in this file). CADSWES is open to any suggestions or questions that you may have concerning the new plotting tool.
General RiverWare
SCT
Enabling and Disabling Dispatching
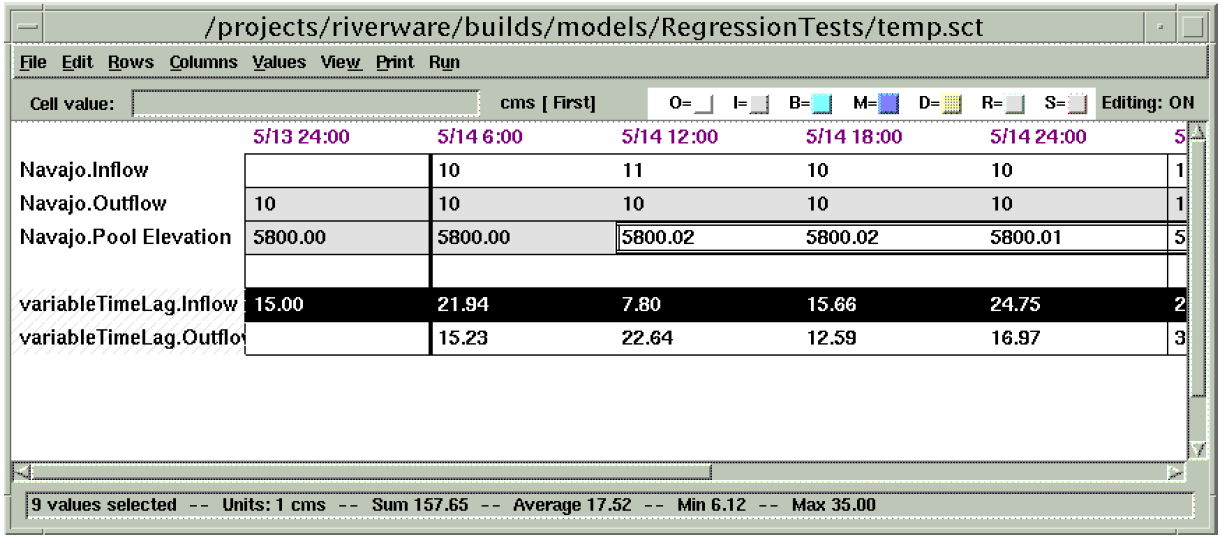
Object dispatching can now be enabled or disabled directly from the SCT dialog. Previously, this could only be done through the Model Run Analysis dialog. To enable or disable dispatching, select a slot and select Rows Enable Dispatching or Rows Disable Dispatching. This will enable/disable dispatching for the object to which the selected slot belongs. When dispatching is disabled, the selected slot and all other slots on the object will have red cross-hatching over the name.
Slot Statistics
The SCT dialog now shows simple statistical calculations for a group of selected values. If the user highlights/selects a group of cells, the window at the bottom of the SCT will show the number of values selected, the units, sum, average, min and max (see dialog below for an example).
Note: To view the details of this screenshot, you may need to print this page
Qt Integration for Graphical User Interface
RiverWare is in the process of moving from Galaxy as the graphical user interface (GUI) to Qt. Qt is a more current and supported GUI that will allow RiverWare to move forward with user interface enhancements. In addition, it is a more stable, usable and better supported product (Galaxy really isn’t supported at all anymore). Hopefully this transition will be relatively transparent to the user. However, new dialogs developed in Qt will have a slightly different look than the existing Galaxy dialogs. Two examples of this are the new Periodic Slot and Scalar Slot (discussed below). The overall plan is to develop new dialogs in Qt and move existing dialogs from Galaxy to Qt as the opportunities arise. The transition is expected to span a few years.
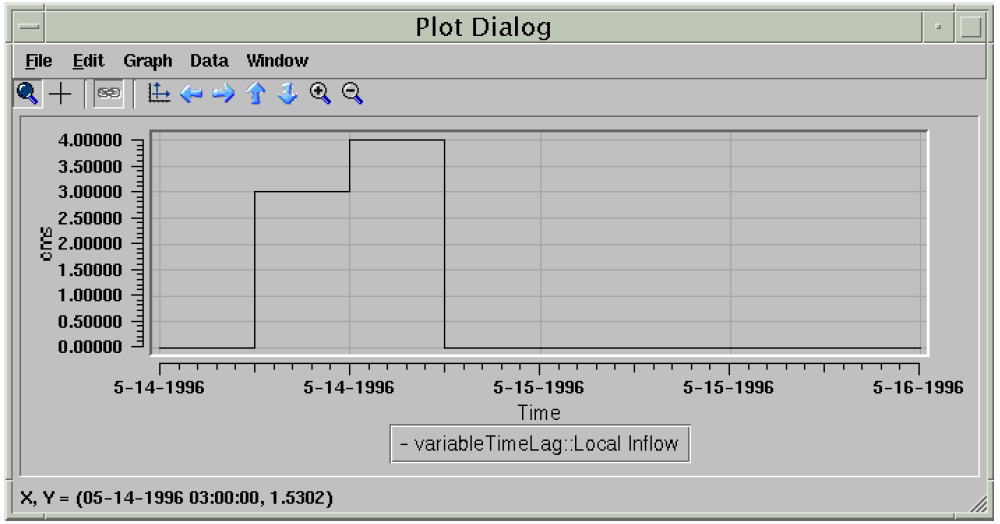
New Plot Dialog
RiverWare now uses new plotting for both the Windows and Solaris platforms. The plotting tool was developed at CADSWES using the new Qt GUI package. Detailed documentation of the new plot tool is included in the online help (not in this file). CADSWES is open to any suggestions or questions that you may have concerning the new plotting tool. Below is an example of the plotting dialog.
Periodic Slot
A new type of RiverWare slot has been added (to simulation objects as well as data objects) to represent periodic data. By periodic data, we mean a sequence of data which repeats at regular time intervals. An example might be a set of evaporation coefficients for a reservoir. The rate of evaporation varies with such factors as temperature and wind speed, factors which vary seasonally. It is natural to assume that this variation is the same for each year, leading to a data set such as the following:
Evaporation Coefficient | |
|---|---|
January | 1 |
February | 3 |
March | 6 |
April | 15 |
May | 28 |
June | 26 |
July | 20 |
August | 11 |
September | 5 |
October | 9 |
November | 11 |
December | 6 |
Each value represents the evaporation coefficient which applies at any time in the given month. Thus if a computation of evaporation requires the evaporation coefficient for 10 a.m. May 16, 2002, its value would be 28.
Prior to this release, RiverWare did not support natural entry of, or access to, this sort of data. If a method required a certain input value at each timestep, then these values must be put in a time series whose range is that of the run. Thus for the case of periodically repeating data, such as these evaporation coefficients, the user would have to repeatedly enter the same data, once for each year of the run. For a ten year run, the user must enter 120 values instead of 12. If the evaporation coefficient estimate changed for one month, the user would have to change 10 values instead of 1. Even worse, if the timestep were daily, the user would have to enter 3,660 values instead of 12.
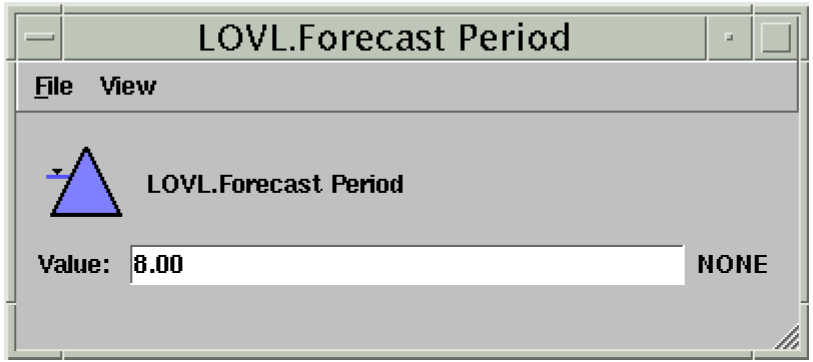
However, with the introduction of the new Periodic Slot this process becomes much simpler. Below is an example of a new Periodic Slot called Operating Level Table.
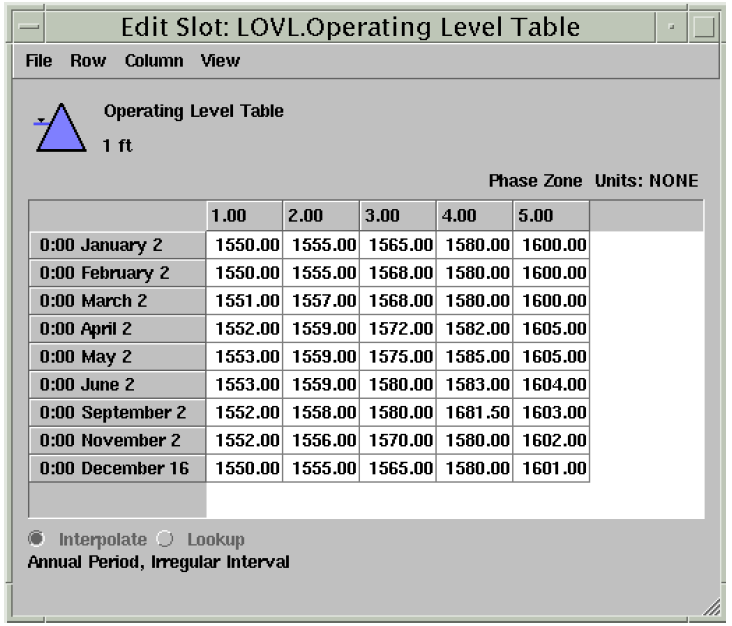
In this example, the period identified by this slot is one year. This means that the data contained within this slot is repeated every year. Periodic slots are allowed to have periods of either one year, one month, one day, 12 hours, or 6 hours. The period is configurable by the user through the View Configure dialog:
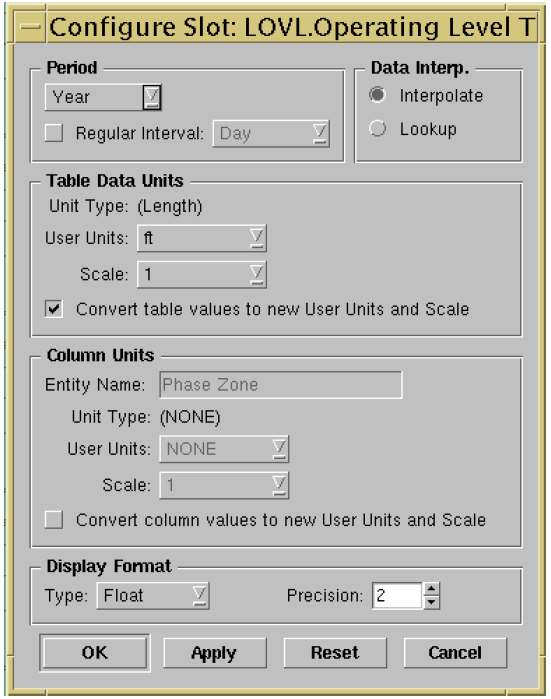
In addition to identifying a period, the user can identify an interval for the data. The interval defines the data increment for the period. In the evaporation coefficient example above, the period is one year and the interval is one month. This means there is a data point for every month which is repeated every year. The valid intervals depend on the period selected. In general, they can vary from one hour to one month.
If the data interval is not a fixed interval, the Periodic Slot is said to have an irregular interval. This means that the period is not broken up into even intervals. This is controlled by de-selecting the Regular Interval checkbox in the configuration dialog. It the period does not have a regular interval, it is up to the user to create the intervals for the Periodic Slot. This is done by adding rows and then specifying dates for each row. The screen shot of the Operating Level Table above is an example of an irregular period.
Periodic Slots can have a single or multiple columns. The column headers can have units that represent some physical feature of the data. For example, in the evaporation coefficient table above, the evaporation coefficients may also depend on the pool elevation of the reservoir. If this were the case, the slot would be two-dimensional with dates for the rows and pool elevations for the columns, the table data (the evaporation coefficients) would exist in the body of the table. The user can configure the number of columns, the name of the columns, the values associated with each column, and the units associated with the column values.
Another configurable feature of the Periodic Slot is the method of data interpretation. When a Periodic Slot is accessed for a date that falls within a given interval (as opposed to exactly on the date which defines the interval) the slot can either perform a lookup or an interpolation. For the evaporation coefficient example above, if a computation of evaporation requires the evaporation coefficient for 10 a.m. May 16, 2002, its value would be 28 if the Periodic Slot were set for lookup mode. If however, the Period Slot were configured for interpolation, the evaporation value for 10 a.m. May 16, 2002 would be around 27 (approximately half way between the value of 28 given for May and 26 given for June).
Periodic slots may exist on simulation objects or the user may create them on data objects. If created on a data object, the Periodic Slot is fully configurable by the user. If however, the Periodic Slot exists on a specific object for a specific method, it may be pre-configured to for either regular/irregular interval or interpolate/lookup data interpretation. If pre-configured, these options may not be configurable by the user.
There are three ways of accessing the Periodic slot from the RiverWare Policy Language:
• <object.slot> []
Accesses the given periodic slot at the current timestep, returns a numeric value.
• <object.slot> [ <date/time expression> ]
Accesses the given periodic slot at the given timestep, returns a numeric value.
• <object.slot> [ <date/time expression>, <numeric expression> ]
Accesses the given periodic slot at the given date and secondary dimension value, returns a numeric value.
Also, there are predefined functions that are design to perform certain operations on periodic slots (see the Rulebased Simulation online help).
Scalar Slot
A new type of RiverWare slot, the Scalar Slot, has been added to represent a single piece of numeric data. This is analagous to a 1-row, 1-column table. A screen shot of the new Scalar Slot is shown below.
Simulation Objects
The following enhancements to the RiverWare simulation objects are described briefly. The user is encouraged to consult the Simulation Objects Documentation in the online help for more detailed descriptions of the enhancements to the objects and their methods.
Groundwater Storage Object
Current Storage Linear Flow
The Current Storage Linear Flow method calculates Outflow as a linear function of the Average Storage at the current timestep. This is similar to the previously existing Linear Flow method, except that outflow is based on the average storage over the current timestep as opposed to the instantaneous, beginning of timestep storage. Therefore, this method avoids the artificial one timestep lag caused by the Linear Flow method.
Lagged Linear Flow
The Lagged Linear Flow method calculates Outflow as a linear function of a previous (specified by a lag time), instantaneous storage value. This method is identical to the Linear Flow method except that the user controls which previous storage is used to calculate the current outflow. A user input lag time that represents an integer number of timesteps is used to specify the lag between storage and outflow.
Impulse Response Outflow
The Impulse Response method computes Outflow using a set of impulse response coefficients. The current outflow is a result of several previous inflows multiplied by their corresponding coefficients (where the number of previous inflows used is equal to the number of coefficients specified). This is analagous to the impulse response methods on the Reach and Water User objects.
Impulse Response Components
A new method category, Impulse Response Components, is available whenever the Impulse Response Outflow method is selected in the GW Outflow Calc category. The Multiple Response Components method in this category allows the user to track multiple responses to the inflow impulse. If using this method, and linking the response components, then the Outflow slot should not be linked to any object. This would be “creating” water because the response components are a subset of the total outflow. Likewise, it the Outflow slot is linked, then the response components should not be linked to any object that is not a data object.
Inflow from Groundwater Slot
A new slot called Inflow from Groundwater was added to the groundwater object. This slot is used to account for inflows to the groundwater object that may come from other linked groundwater objects. Water coming in through the Inflow from Groundwater slot will be included in the mass balance, but will not be considered when determining the Outflow using either the Impulse Response Outflow method or the Current Storage Linear Flow method.
Water User
Input Diversion Requests
Input Diversion Requests is a new method in the Diversion and Depletion Requests category. When Diversion Requested is input, Depletion Requested is calculated as the Diversion Requested multiplied by the Minimum Efficiency.
Input Depletion Requests
When this method is selected, and Depletion Requested is input by the user, Diversion Requested is computed as the Depletion Requested divided by the Minimum Efficiency. If the computed value is larger than the Max Flow Capacity, then Diversion Requested is reset to the Max Flow Capacity.
Pump Back Return Flows
Pump Back Return Flows is a method in the Return Flow Calc category on Water Users. This method is only available if the Impulse Response method is selected in the Return Flow Routing category. Return Flow is calculated as a function of diversion, consumptive use requirement, irrigated area, and incidental depletions. If there are pumped back flows, this water is added into the return flow and removed from the routed return flow. This is meant to model a physical system where return flows are pumped from a routed location, reapplied to an irrigated area, and then allowed to return again (after a specified depletion).
Reach Object
Time Lag Downstream Only Dispatch Method
A new dispatch method was added to the Reach object that forces the reach to always solve in a downstream direction when using time lag routing. This method is active only when the Local Inflow Downstream Only method is selected in the Local Inflow Solution Direction category. Previously, when time lag routing was selected, the reach would solve in either direction depending on whether or not it had an inflow or outflow value. This often resulted in unnecessary resolving. If users have models that use the time lag routing method, and the reaches are always solving in the downstream direction, it is recommended that they take advantage of this new dispatch method.
Leakage Slot Added
A new slot, Leakage, was added to the Seepage and Riparian CU Loss method. This method exists in the Seepage Calc category and is available only when No Routing is the routing method and Local Inflow Downstream Only is selected in the Local Inflow Solution Direction category. If Leakage is input or set by a rule, it is used in the seepage calculations. Otherwise, Leakage is calculated by the method as it was prior to this release.
Reservoir Objects
Surcharge Release Calculation Category
A new method category, called Surcharge Release Calculation, was added to the Storage Reservoir and Level Power Reservoir. The methods in this category are used to model the Kansas City and Southwest Division Army Corps of Engineers’ algorithms for mandatory (surcharge) releases. If the reservoir’s pool elevation exceeds the top of the flood pool, then the reservoir is in surcharge operations and must make releases to bring the reservoir back down to the flood pool. The computed surcharge releases are stored in the Surcharge Release slot and are included in the reservoir’s outflow. These methods are still in the testing phase and should not be used by anyone except the Army Corps of Engineers. However, these methods were designed to be generic so in the future they can be used by anyone who needs to model surcharge releases.
Surcharge Release Flag
A Surcharge Release flag was added to the list of special flags that can bet set on a series slot. This flag can only be set on the Surcharge Release slot. When set, it will act as a known value (even though it will not really have a value before dispatching - this is similar to the Maximum Capacity flag) allowing the reservoir to dispatch with the solveMB_givenInflowSurchargeRelease dispatch method. The flag can either be set through the open slot dialog or by a rule (see the Rulebased Simulation section below for more information about setting flags with rules).
Control Point Object
A new object was added to the RiverWare Object Palette called the Control Point object. This object is used for the Flood Control methods that will be added to the new Computational Subbasin. These flood control methods have yet to be added to RiverWare. For now, the Control Point computes Outflow as the sum of Inflow and Local Inflow whenever Inflow is known.

Forecast Hydrology Methods
Several new methods were added to the Reach, Reservoir, and Control Point objects to compute inflow forecasts. These methods assume a period of perfect knowledge where the hydrologic/local inflows are equal to a known inflow value. After the period of perfect knowledge, the inflow values for the remaining timesteps in the forecast period are computed (based on the method selected). All of these method execute at the beginning of each controller timestep. That way, for each timestep there is an inflow forecast that extends out into the future. As the controller timesteps move forward, the forecast is always being updated.
Forecast Hydrology on Reservoir Objects
In order to enable the forecasting methods on reservoir objects, the Forecast Hydrologic Inflow method must be selected in the hydrologicInflowCalculationCategory. This causes the instantiation of a new method category called Generate Forecast Hydrology. There are four methods available in this category: No Forecast (this is the default method which does nothing), Geometric Recession, Exponential Recession, and Coefficient and Exponent Forecast Inflow. All of these methods are based on a period of perfect knowledge followed by a period of forecasting. The Geometric Recession method computes the forecasted flow as a fraction of the previous forecasted flow value. The Exponential Recession method computes the forecasted flow based on the first order, exponential decay equation. The Coefficient and Exponent Forecast Inflow method assumes a one timestep period of perfect knowledge. The remaining timesteps in the forecast period are computed using the current and previous known inflow values using the following formula (starting at i = 1):
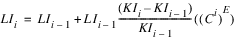
where KIi is the Known Inflow at timestep i, LIi is the Local Inflow at timestep i, C is a coefficient and E is an exponent. The counter i represents the timestep beyond the current timestep. So, i = 1 is the current timestep + 1, i = 2 is the current timestep + 2, etc. The coefficient, C, and exponent, E, are the values in the Forecast Inflow Parameters slot.
Forecast Hydrology on Reach
On Reach objects, users can select the forecast hydrology methods through the Generate Local Inflows category. This category is only available when either Input Local Inflow or Local Inflow Downstream Only is selected in the Local Inflow Solution Direction category. There are four methods available in the Generated Local Inflows category: No Forecast Local Inflow (this is the default method which does nothing), Geometric Recession, Exponential Recession, and Coefficient and Exponent Forecast Inflow. These methods are analagous to the forecasting methods on the Reservoir object (see the above section for descriptions).
Forecast Hydrology on Control Point
On Control Point objects, the forecasting methods are accessed by selecting Forecast Local Inflows in the Local Inflow Calculation category. This adds the Generate Forecast Inflows category. There are three methods available in the Generated Forecast Inflows category: No Forecast Local Inflow (this is the default method which does nothing), Geometric Recession, and Exponential Recession. These methods are analagous to the forecasting methods on the Reservoir object (see the above section for descriptions).
Rulebased Simulation
New Palette Functions
Following is a brief description of the new rules palette functions (Predefined Functions) available for use in the RiverWare Policy Language for writing rules. Details on the use of these function and the syntax involved are available in the Rulebased Simulation documentation online.
SolveSlopeStorageGivenInflowHW
The SolveSlopeStorageGivenInflowHW function solves a Slope Power Reservoir when inflow and pool elevation are known. The function returns a LIST with two values: the resulting outflow and the resulting storage. This function works the same as the analagous dispatch method on the Slope Power Reservoir. Therefore, this function will return the same results for outflow and storage as if the object simulated/dispatched with the same inflow and pool elevation values.
SolveSlopeStorageGivenInflowOutflow
The SolveSlopeStorageGivenInflowOutflow function solves a Slope Power Reservoir when inflow and outflow are known. The function returns a LIST with two values: the resulting pool elevation and the resulting storage. This function works the same as the analagous dispatch method on the Slope Power Reservoir. Therefore, this function will return the same results for pool elevation and storage as if the object simulated/dispatched with the same inflow and outflow values.
GetColMapVal
This function is given a Periodic Slot, a date, and a value with the units of the Periodic Slot’s data. It performs an inverse lookup to return the column map (secondary value) which corresponds to the given table value.
GetLinkedObj
When given a SLOT, this function returns a LIST of the objects which contain the slots to which the given slot is linked. An empty LIST is returned if the slot is not linked to any other slots.
AccountNamesByAccountType
When given an OBJECT and a STRING representing an account type (one of “Storage”, “PassThrough”, “Diversion” or “ALL”), this function returns a LIST of the accounts of the indicated type on the given object.
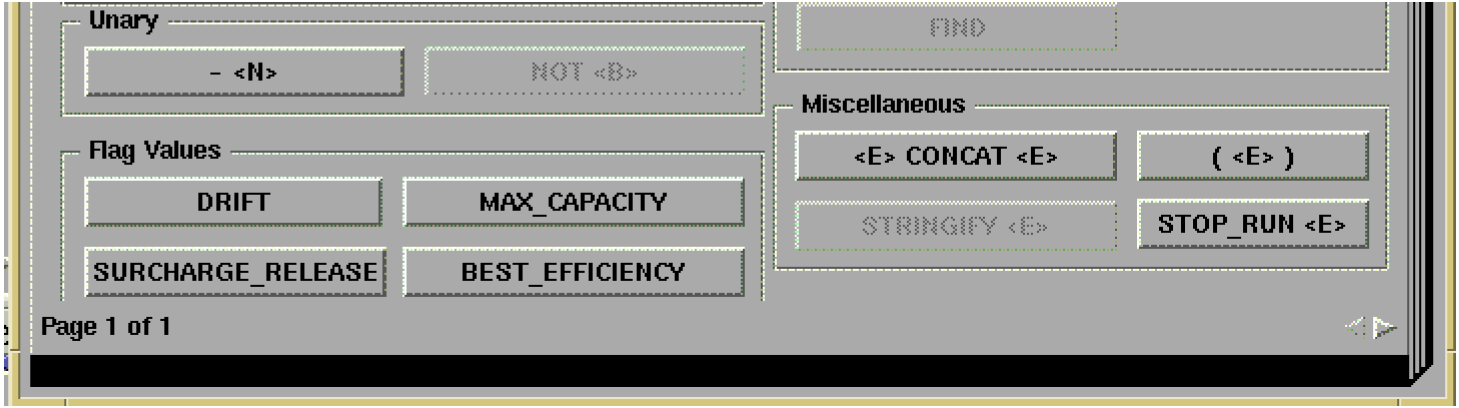
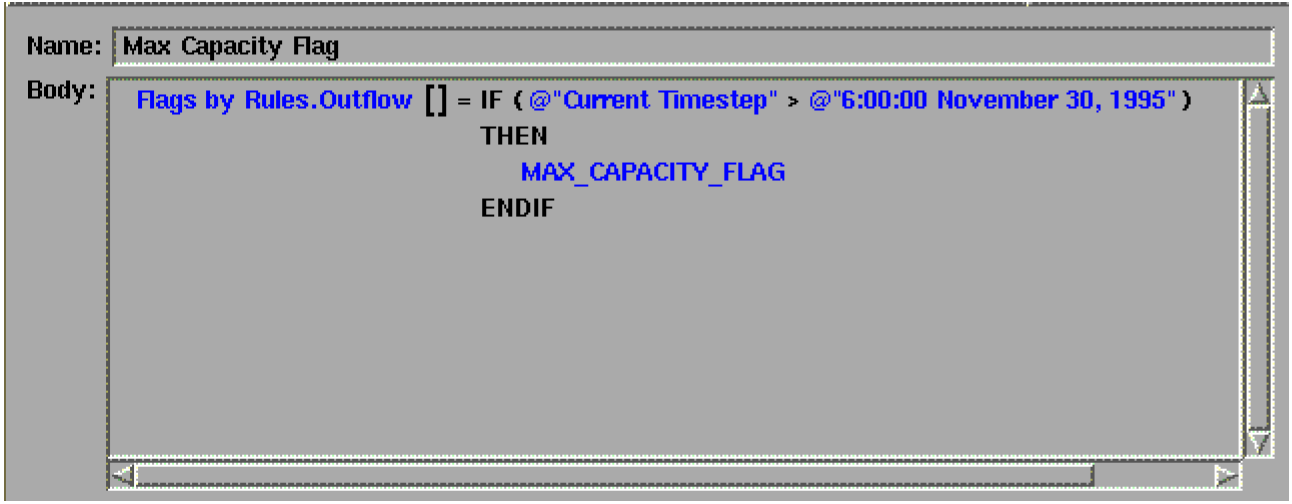
Setting Flags with Rules
The RiverWare Policy Language has been enhanced to allow rules to set special flags on series slots. The only flags which may be set are those which have the semantics “considered known (when the object is selecting a dispatch method) but are actually computed by the object at dispatch time”. These include the Surcharge Release, Max Capacity (for both Outflow and Energy), Best Efficiency and Drift. Each flag now has its own palette button for rule building. Below is a screen shot of the flag value buttons at the lower left corner of the palette. Also an example of a rule that sets a flags is given.
Performance Improvement to Hypothetical Simulation Functions
We Improved the performance of RPL hypothetical simulation functions by limiting the amount of information which is copied from objects on the workspace to the clones of them which are used for hypothetical simulation. In the past, the hypothetical simulation functions made no assumptions about which data would be needed from the objects in the subbasin under consideration, so it was all copied over when these objects were cloned. This approach does not scale well as the number of timesteps in the run is increased. We now make an educated guess about which data will be used by the hypothetical simulation and only clone the relevant portion.
This enhancement should be a big improvement to models that use the hypothetical simulation functions and have a large number of timesteps. Since we are making an educated guess about how much information to copy to the clones, existing models could be affected if our guess is incorrect. Let CADSWES know as soon as possible if it seems like the hypothetical simulation functions were working correctly for previous releases but not for this release.
Accounting
Nambe Falls Loss Calculation
A new method, called Nambe Falls Loss Calculation, was added to the Storage Account Gain Loss category. This method is intended to replace the Nambe Falls portion of the Daily Program formerly used to model the upper Rio Grande system. This method is very specific and should only be used in the Rio Grande model.
Exporting Data from Object Account Summary Dialog
Export All Slots (Display Precision) and Export All Slots (Model Precision) operations are now available from the Object Account Summary dialog box "File" menu. The displayed slot sums (across the selected set of Accounts on a specific SimObj) are output to a text file: one column per Slot, one row per timestep. Also, comments appear at the beginning of the file indicating the Object Name, the number of Accounts represented in the sums, and information about the various Slots (one Slot per comment row) - including the Slot Name, Unit Type, and Units of the data used for that Slot. (The Unit Type and Units will depend on the user’s current setting for the Flow / Volume toggle in the Object Account Summary dialog box).
Optimization
• The optimization controller has been upgraded from using CPLEX version 6.6 to version 8.0. The new version of CPLEX requires that a different license manager be installed by optimization users. Some of the new functions in CPLEX replace code developed in the past by CADSWES. Now that the new version is in place, additional incremental improvements in the use of new CPLEX functions and a new C++ interface can be explored.
Bugs Fixed
The following is a list of the bugs which were fixed for this release. If you wish to view the details for a specific bug, please browse to http://cadswes.colorado.edu/users/gnats-query.html and search our bug database. You will need a RiverWare user login and password.
1480 | 1840 | 1877 | 1892 | 1903 | 1929 | 1983 |
2009 | 2036 | 2044 | 2059 | 2117 | 2126 | 2129 |
2152 | 2162 | 2169 | 2252 | 2264 | 2278 | 2339 |
2377 | 2398 | 2399 | 2411 | 2432 | 2433 | 2448 |
2468 | 2493 | 2558 | 2587 | 2613 | 2616 | 2623 |
2624 | 2644 | 2651 | 2658 | 2681 | 2688 | 2692 |
2701 | 2845 | 2891 | 2973 | 3057 | 3061 | 3073 |
3076 | 3079 | 3080 | 3081 | 3082 | 3084 | 3085 |
3086 | 3087 | 3088 | 3092 | 3093 | 3095 | 3098 |
3103 | 3104 | 3107 | 3109 | 3112 | 3113 | 3117 |
3118 | 3120 | 3121 | 3124 | 3126 | 3128 | 3129 |
3130 | 3131 | 3132 | 3134 | 3135 | 3136 | 3139 |
3140 | 3141 | 3143 | 3145 | 3146 | 3148 | 3149 |
3150 | 3151 | 3152 | 3154 | 3155 | 3158 | 3159 |
3160 | 3162 | 3163 | 3165 | 3166 | 3168 | 3169 |
3170 | 3171 | 3172 | 3173 | 3174 | 3175 | 3176 |
3177 | 3179 | 3180 | 3181 | 3182 | 3183 | 3184 |
3185 | 3186 | 3187 | 3188 | 3190 | 3192 | 3193 |
3194 | 3197 | 3198 | 3199 | 3200 | 3205 | 3207 |
3208 | 3209 | 3212 | 3213 | 3214 | 3220 | 3221 |
3223 | 3224 |
Revised: 11/11/2019