
Plotting
The following changes were made to Plotting.
Default Plot Curve Settings
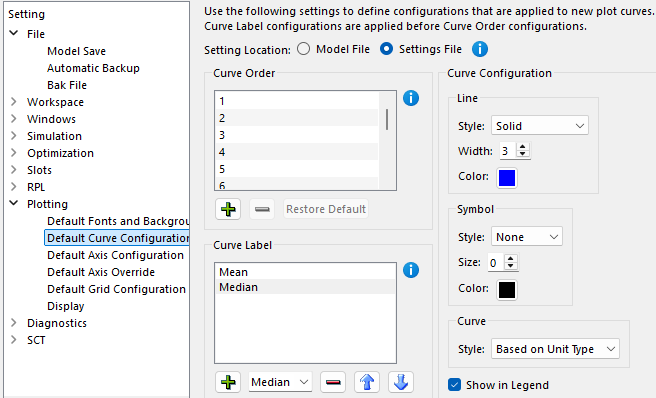
Previously, the only control over default plot curve configuration was the ability to specify the default settings for adding a single curve. When you added multiple curves to a plot with a single operation, they used an internally defined list of colors to distinguish the curves without any user control over the initial formatting. Now in the Settings Manager, you can define the default configuration for multiple curves that are added in a single operation based on the order in which they are added. In addition to specifying the color, you can also specify the line style, width and symbol.
Also, an option was added to specify the default curve configuration based on the Curve Label. When used, any curve with a label that ends with the specified text will be given the specified configuration by default. For example, any slot name ending with “Mean” may be given the specified curve configuration when initially added to a plot.
These new default settings apply only when curves are initially added to a plot. As before, any curve’s configuration can be edited after it has been added to a plot.
The Default Curve Configuration settings can now be saved either as a model file setting or in the settings file. Previously they were always saved in the settings file (applied for all models).
See Configuration Defaults in Output Utilities and Data Visualization for more details.
Figure 1.12 Settings Manager Showing Default Curve Configuration
Axis Configuration Limited to Axes in Use
Previously the Plot Page Editor allowed for configuration of axes that were not in use (did not have any curves assigned to them). This typically applied to the right y-axis and upper x-axis. Now axis configuration is restricted to axes that currently have a curve assigned to them. This applies for both the single plot axis configuration and the Configure Multiple Plots and Curves axis configuration. This change addresses issue RW-6388.
Revised: 12/01/2025