
Diagnostics
Output Window
Filter Statistics
A Show Filter Statistics option was added to the Settings menu. When enabled, a single-line filter statistics panel appears below the message list. This indicates the total number of diagnostics messages and how many are shown and hidden due to message filtering.
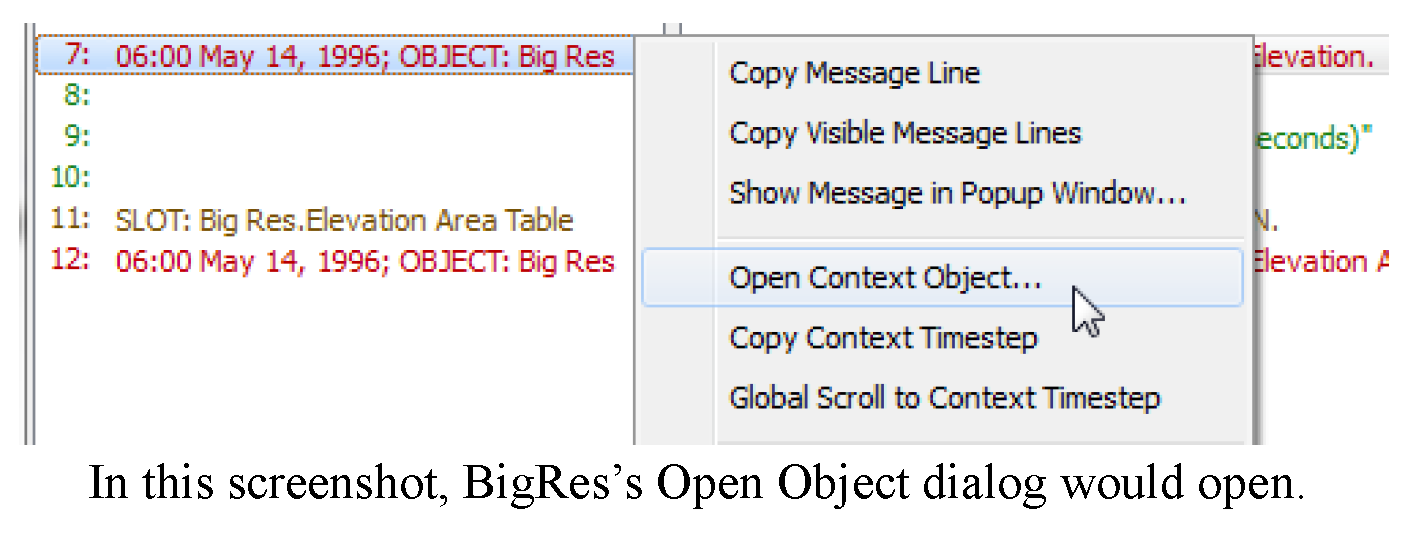
Open Dialogs from Context
The Diagnostics Output Window now supports the following three right-click context menu operations:
• Open Context Object: Open the dialog for the listed Object, Account, Slot, RPL Set, Rule, Goal, or Group.
• Copy Context Timestep: Copy the datetime to the clipboard
• Global Scroll to Context Timestep: Global scroll to the datetime
The Diagnostic Output Window's Message Popup Dialog previously supported an Open Selected Named Item... button which opened up the dialog for that object, account or slot. This capability was extended to support RPL Objects (Sets, Groups, Blocks, User-defined Functions).
For more information, see Diagnostic Output Window in Debugging and Analysis.
Performance Improvements
Performance has been improved when running with the diagnostics output window open. Also, during filtering operations that are expected to take more than four seconds, a progress bar and abort button are shown.
Tool Tips are Wrapped
In the diagnostics output, long diagnostic messages are shown as a wrapped tooltip when mousing over individual messages.
Dispatch Solution Diagnostics
Diagnostics were added in the Dispatch Management Controller category. After a method executes (and does not abort) one of the following two messages is posted, as appropriate:
• The dispatch method “Solve Given Inflow” successfully solved.
• The dispatch method “Solve Given Inflow” executed but did not solve.
This enables you to better diagnose when a dispatch method completes.
Revised: 01/11/2023