
Plot series slots
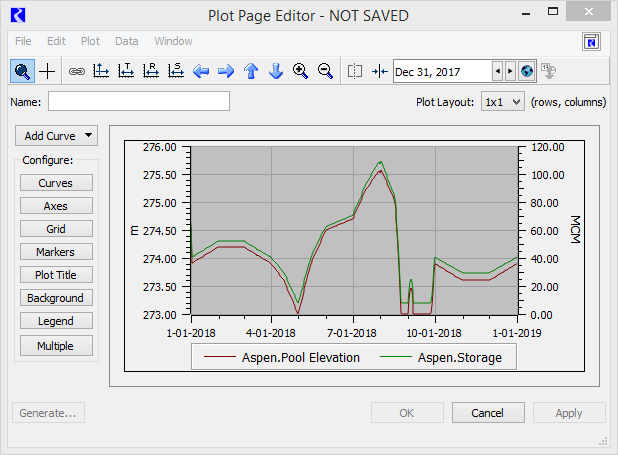
Use this procedure to display a plot of one or more slots directly from the SCT. If you select multiple slots, they are plotted together on the same plot. The slots are plotted over the full timestep range of the SCT.
1. Go to the Series Slots tab.
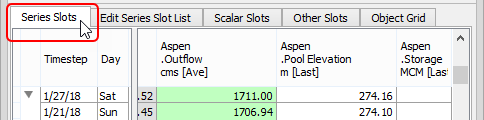
2. Select the slots to plot.
Note: You can select any number of slots, as long as no more than two unit types are represented within your selection.
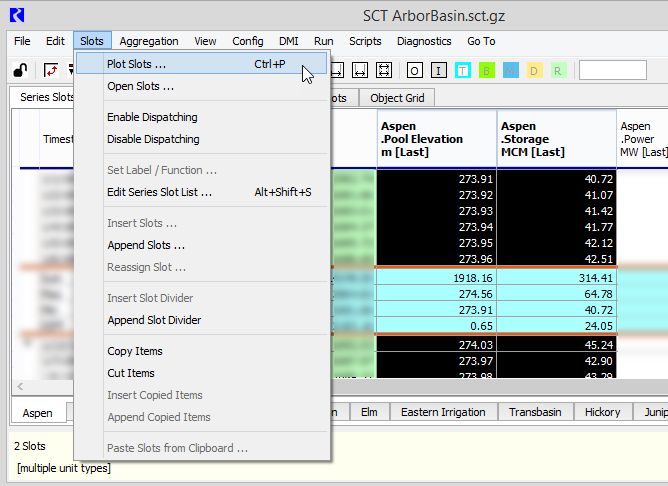
3. On the SCT menu, select Slots, then Plot Slots; alternatively, press Ctrl+P.
The slots are plotted in the Plot Page Editor window.
Related topics
Revised: 07/05/2022