
General RiverWare
SCT
Enabling and Disabling Dispatching
Object dispatching can now be enabled or disabled directly from the SCT dialog. Previously, this could only be done through the Model Run Analysis dialog. To enable or disable dispatching, select a slot and select Rows Enable Dispatching or Rows Disable Dispatching. This will enable/disable dispatching for the object to which the selected slot belongs. When dispatching is disabled, the selected slot and all other slots on the object will have red cross-hatching over the name.
Slot Statistics
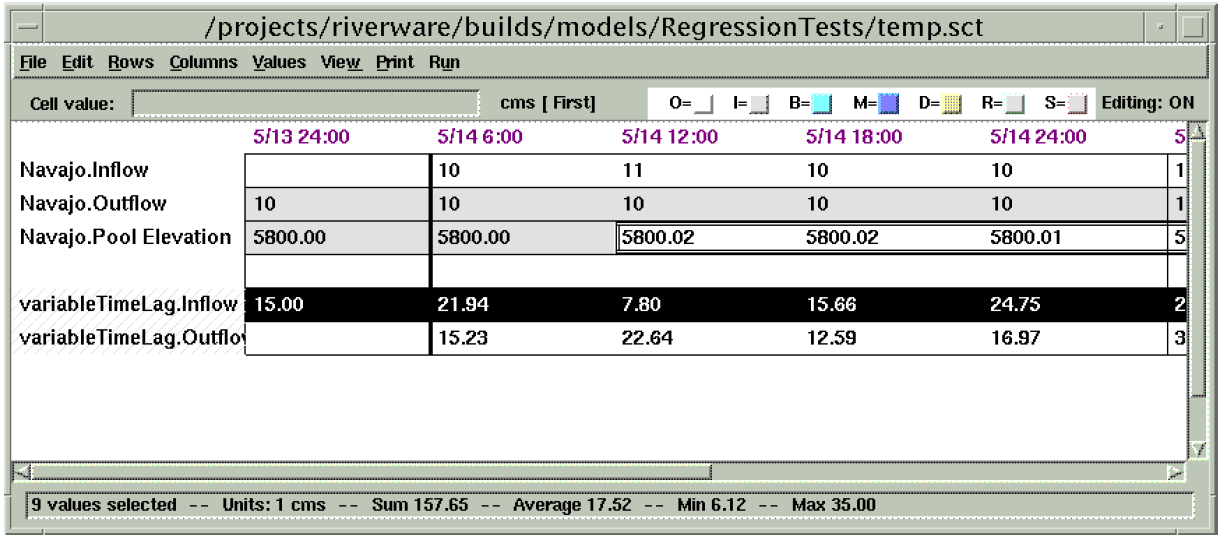
The SCT dialog now shows simple statistical calculations for a group of selected values. If the user highlights/selects a group of cells, the window at the bottom of the SCT will show the number of values selected, the units, sum, average, min and max (see dialog below for an example).
Note: To view the details of this screenshot, you may need to print this page
Qt Integration for Graphical User Interface
RiverWare is in the process of moving from Galaxy as the graphical user interface (GUI) to Qt. Qt is a more current and supported GUI that will allow RiverWare to move forward with user interface enhancements. In addition, it is a more stable, usable and better supported product (Galaxy really isn’t supported at all anymore). Hopefully this transition will be relatively transparent to the user. However, new dialogs developed in Qt will have a slightly different look than the existing Galaxy dialogs. Two examples of this are the new Periodic Slot and Scalar Slot (discussed below). The overall plan is to develop new dialogs in Qt and move existing dialogs from Galaxy to Qt as the opportunities arise. The transition is expected to span a few years.
New Plot Dialog
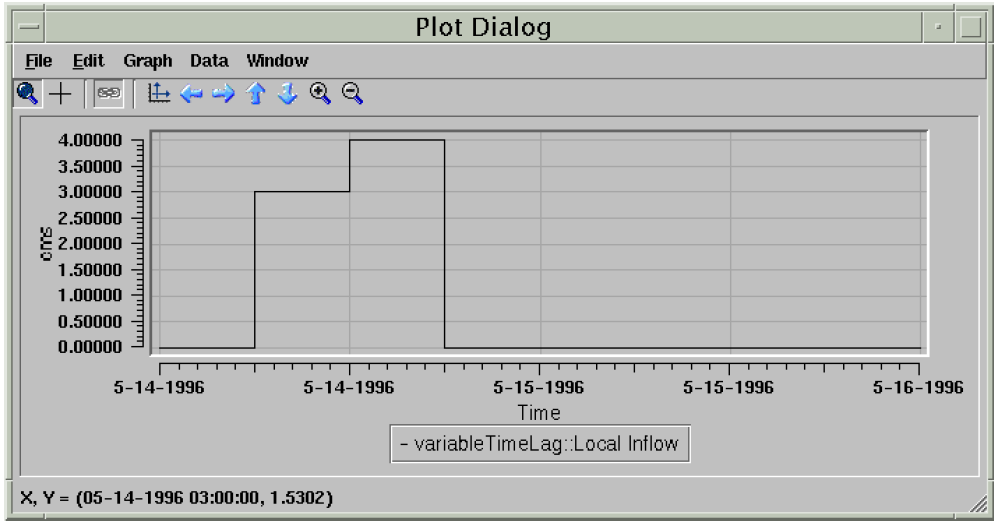
RiverWare now uses new plotting for both the Windows and Solaris platforms. The plotting tool was developed at CADSWES using the new Qt GUI package. Detailed documentation of the new plot tool is included in the online help (not in this file). CADSWES is open to any suggestions or questions that you may have concerning the new plotting tool. Below is an example of the plotting dialog.
Periodic Slot
A new type of RiverWare slot has been added (to simulation objects as well as data objects) to represent periodic data. By periodic data, we mean a sequence of data which repeats at regular time intervals. An example might be a set of evaporation coefficients for a reservoir. The rate of evaporation varies with such factors as temperature and wind speed, factors which vary seasonally. It is natural to assume that this variation is the same for each year, leading to a data set such as the following:
Evaporation Coefficient | |
|---|---|
January | 1 |
February | 3 |
March | 6 |
April | 15 |
May | 28 |
June | 26 |
July | 20 |
August | 11 |
September | 5 |
October | 9 |
November | 11 |
December | 6 |
Each value represents the evaporation coefficient which applies at any time in the given month. Thus if a computation of evaporation requires the evaporation coefficient for 10 a.m. May 16, 2002, its value would be 28.
Prior to this release, RiverWare did not support natural entry of, or access to, this sort of data. If a method required a certain input value at each timestep, then these values must be put in a time series whose range is that of the run. Thus for the case of periodically repeating data, such as these evaporation coefficients, the user would have to repeatedly enter the same data, once for each year of the run. For a ten year run, the user must enter 120 values instead of 12. If the evaporation coefficient estimate changed for one month, the user would have to change 10 values instead of 1. Even worse, if the timestep were daily, the user would have to enter 3,660 values instead of 12.
However, with the introduction of the new Periodic Slot this process becomes much simpler. Below is an example of a new Periodic Slot called Operating Level Table.
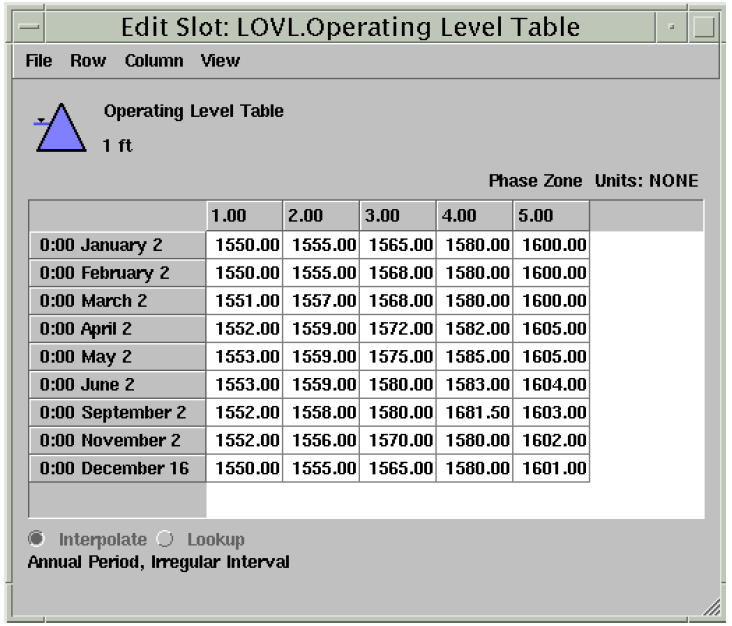
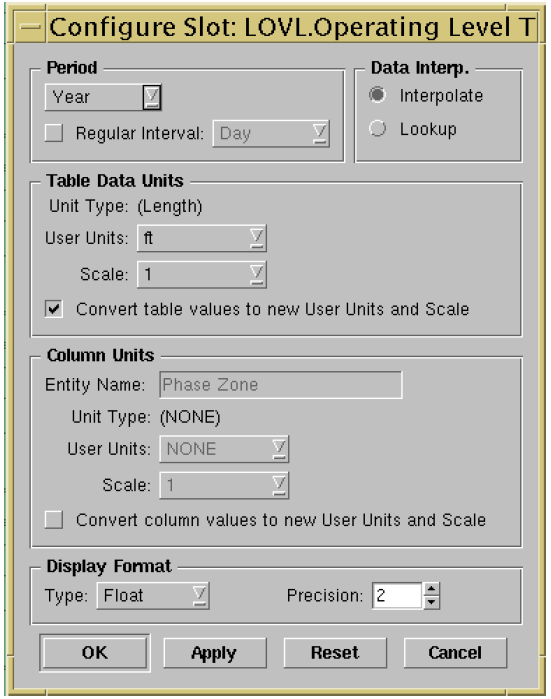
In this example, the period identified by this slot is one year. This means that the data contained within this slot is repeated every year. Periodic slots are allowed to have periods of either one year, one month, one day, 12 hours, or 6 hours. The period is configurable by the user through the View Configure dialog:
In addition to identifying a period, the user can identify an interval for the data. The interval defines the data increment for the period. In the evaporation coefficient example above, the period is one year and the interval is one month. This means there is a data point for every month which is repeated every year. The valid intervals depend on the period selected. In general, they can vary from one hour to one month.
If the data interval is not a fixed interval, the Periodic Slot is said to have an irregular interval. This means that the period is not broken up into even intervals. This is controlled by de-selecting the Regular Interval checkbox in the configuration dialog. It the period does not have a regular interval, it is up to the user to create the intervals for the Periodic Slot. This is done by adding rows and then specifying dates for each row. The screen shot of the Operating Level Table above is an example of an irregular period.
Periodic Slots can have a single or multiple columns. The column headers can have units that represent some physical feature of the data. For example, in the evaporation coefficient table above, the evaporation coefficients may also depend on the pool elevation of the reservoir. If this were the case, the slot would be two-dimensional with dates for the rows and pool elevations for the columns, the table data (the evaporation coefficients) would exist in the body of the table. The user can configure the number of columns, the name of the columns, the values associated with each column, and the units associated with the column values.
Another configurable feature of the Periodic Slot is the method of data interpretation. When a Periodic Slot is accessed for a date that falls within a given interval (as opposed to exactly on the date which defines the interval) the slot can either perform a lookup or an interpolation. For the evaporation coefficient example above, if a computation of evaporation requires the evaporation coefficient for 10 a.m. May 16, 2002, its value would be 28 if the Periodic Slot were set for lookup mode. If however, the Period Slot were configured for interpolation, the evaporation value for 10 a.m. May 16, 2002 would be around 27 (approximately half way between the value of 28 given for May and 26 given for June).
Periodic slots may exist on simulation objects or the user may create them on data objects. If created on a data object, the Periodic Slot is fully configurable by the user. If however, the Periodic Slot exists on a specific object for a specific method, it may be pre-configured to for either regular/irregular interval or interpolate/lookup data interpretation. If pre-configured, these options may not be configurable by the user.
There are three ways of accessing the Periodic slot from the RiverWare Policy Language:
• <object.slot> []
Accesses the given periodic slot at the current timestep, returns a numeric value.
• <object.slot> [ <date/time expression> ]
Accesses the given periodic slot at the given timestep, returns a numeric value.
• <object.slot> [ <date/time expression>, <numeric expression> ]
Accesses the given periodic slot at the given date and secondary dimension value, returns a numeric value.
Also, there are predefined functions that are design to perform certain operations on periodic slots (see the Rulebased Simulation online help).
Scalar Slot
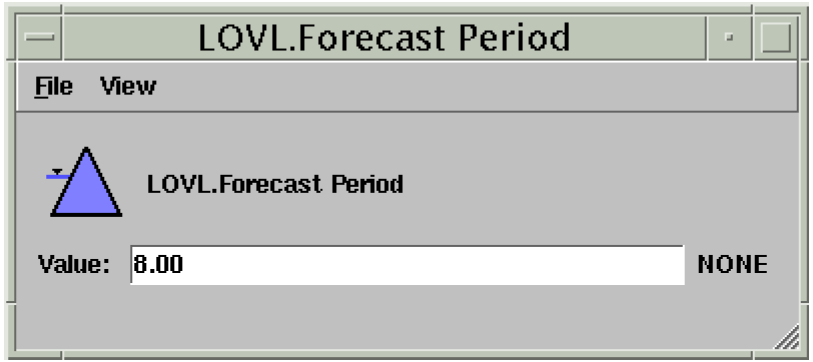
A new type of RiverWare slot, the Scalar Slot, has been added to represent a single piece of numeric data. This is analagous to a 1-row, 1-column table. A screen shot of the new Scalar Slot is shown below.
Revised: 07/05/2022