
Output: Model Reports, Output Canvas and Plotting
Model Reports
Model Reports, described Model Report in Output Utilities and Data Visualization, allow you to generate a customized HTML document describing various aspects of a model including the configuration, RPL policy, slots, and plots. The following improvements have been added to Model Reports:
• A control was added to show or hide the table of contents section.
• Level 5 Font Configuration settings were added. This provides an additional level of model report header font customization.
• Heading text was always bold, even when a normal font style (weight) was specified. This has been fixed so that now you can have any combination of weights and italics.
• Series data with a unit type of DateTime are now displayed correctly in a Model Report and Tabular Series Slot Reports.
Output Canvas
The Output Canvas, described Output Canvas in Output Utilities and Data Visualization, allows for visualization of outputs in spatially distributed teacups and flow lines. The following improvements have been added to the Output Canvas:
Trapezoidal Teacups
Settings have been added to a Teacup Group allowing you to specify the Teacup Geometry. You can choose from the following shapes:
• Rectangular
• Trapezoidal, Congruent (shown to the right)
• Trapezoidal, Constant Top and Bottom Widths
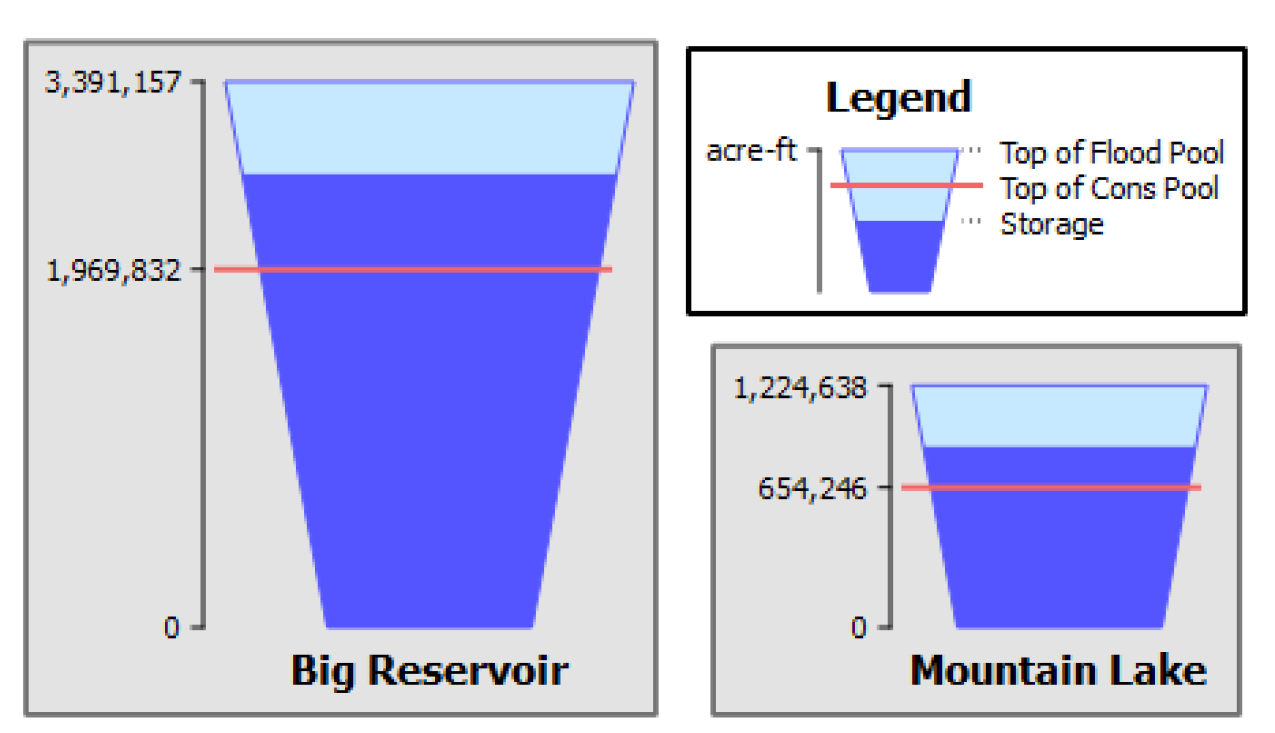
For more information, see Teacup Configuration in Output Utilities and Data Visualization.
Additional Settings
Show Gap: A configuration setting was added to optionally show or hide a side gap between the inner current rectangle/trapezoid and the outer maximum rectangle/trapezoid.
Overflow pattern: When the current value is larger than the maximum value (i.e. overflow), a distinct dotted pattern fill is now shown. Previously, the overflow value was drawn larger than the maximum value, but was indistinguishable in certain cases on the new trapezoidal teacups. The new dotted pattern is now shown for all teacups.
Plotting - Appearance
In the plotting utility, curves are shown using anti-aliasing so that the curves appear smoother. In addition, the border and padding around the plot area was removed to simplify the appearance of the plots.
Revised: 06/04/2022