
Output and Plotting
Model Report
The Model Report output device provides a way to create an HTML document describing many aspects of a model. It was enhanced to provide additional content and formatting options as follows:
• RPL Groups: Show the contents of a RPL Group including a RPL Report Group. The contents of the subsections vary with object type, for blocks and rules it includes images of the frames (e.g., rule statements, function body). See Report Groups for more information on Report Groups.
• RPL Set: Show all items in a RPL Set including the set description, if there is one. The same information is displayed as for a RPL Group item, but for all groups, plus the set description and settings.
• Accounting slots: Show accounting slots in report output.
• Subbasins: Show information on subbasins.
• Series Slot Plots: Show a plot of series slot data.
• Timestamp: Include a timestamp in the output file name, e.g., MyReport.11-19-2012.html.
• Fonts and Text Size: Control the fonts and appearance of text used within the report. This includes the body, title, and four heading fonts.
• Preview Tab: The preview panel was improved to be more functional with forward and back navigation buttons.
• Log Tab: A Log tab was added to display information and warnings that are posted during report generation.
For more information on Model Reports click Model Report in Output Utilities and Data Visualization.
Plotting
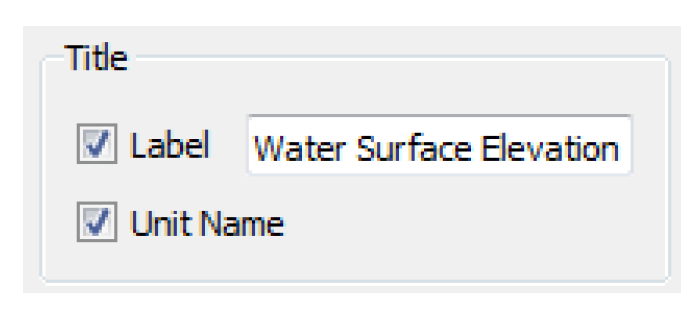
Axis Labels and Precision
In the plotting utility, the axis configuration dialog was modified so that you can optionally enter a label for an axis and optionally specify a unit label. This separates the two concepts and allows axis titles to be, for example, Elevation, Elevation: ft, or just ft, depending on your preference. Separating these concepts allows for better behavior of the axis labels when units are changed.
Further, the precision displayed on the axis for a plot can now be:
• Determined by Plotted Slots: The most precise slot’s precision is used for the axis precision. (Default)
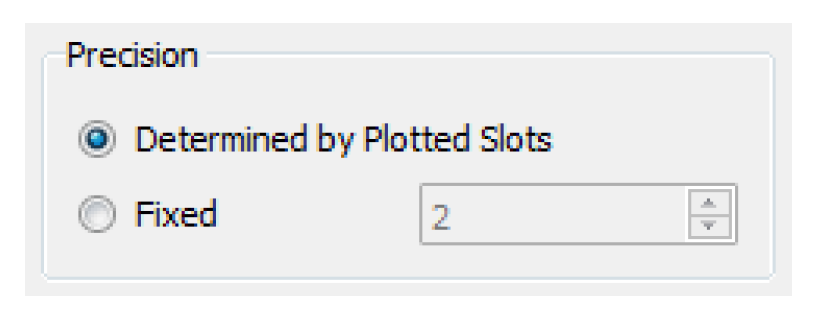
• Fixed: You define the precision in the axis configuration.
AutoScale includes markers
The Plot Dialog's Auto-Scale feature scales and translates the plot to include the entire range of data including plot markers. Previously, markers were ignored in the scale computation.
Pie Chart Precision
Controls were added to the Pie Chart configuration to give you control over the precision of numbers displayed. Two options are available:
• Display precision of the slots for the display of their values.
• Display a fixed specified precision.
Revised: 06/04/2022