
GPAT Graphs Event
The GPAT Graphs event takes Excel files with series data from RiverWare or other data sources and generates graphs in an Excel output file. The graphs are generated according to the configurations defined in the GPAT Graphs configuration file, which is created in GPAT and referenced in the GPAT Graphs Configuration dialog box.
Note: The Graphical Policy Analysis Tool (GPAT) is an add-in to Excel; therefore, for the event to function, Excel must be installed on your computer, and the GPAT add-in must be installed in Excel.
GPAT Graphs Configuration Dialog Box
This dialog box opens when you open a GPAT Graphs event on the RiverSMART workspace.
Note: The input Excel data files and output Excel file with graphs are configured in RiverSMART; therefore, they are not included in this dialog box.
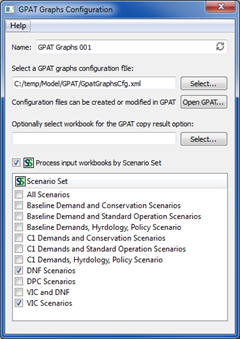
Name
Enter a user-defined unique name for the GPAT Graphs event.
Select a GPAT graphs configuration file
The GPAT Graphs configuration file is an XML-based file that specifies the graphs to generate. To specify this file, either enter the path in the text box, or select Select and navigate to the file. The file is created in GPAT and defines graph configurations created in the GPAT interface.
Open GPAT
If GPAT is installed in Excel on your computer, the Open GPAT button opens the GPAT interface, allowing you to create or modify GPAT Graphs configuration files. If you specify a configuration file, GPAT is opened with the configuration file already loaded.
Optionally select workbook for the GPAT copy result option
Optional field. Allows you to enter or select an Excel workbook for the copy result option in GPAT. If graphs that use the copy result option have been saved in the GPAT Graphs configuration file, you must select the workbook to which results will be copied; otherwise, this field is not applicable.
Process input workbooks by Scenario Set
Optional field. Allows input workbooks from selected scenario sets to be processed together into graphs in an output workbook.
Scenario Set list
This list is displayed only if the Process input workbooks by Scenario Set option is selected. It lists all scenario sets defined for the study in the Scenario Set Manager.
Select the check boxes of the scenario sets you want to process. Each selected scenario set is processed separately by the GPAT Graphs event, as follows:
1. The input workbook for each scenario in the set is located, and these are passed as inputs to GPAT.
2. GPAT creates the graphs specified in the selected configuration file using the input data from the scenarios in the set.
3. GPAT writes the graphs and associated data to the scenario set folder using the linked output workbook name.
4. If you have selected more than one scenario set, processing moves to the next set and its scenarios are processed into graphs and written to an output workbook in its scenario set folder.
Source Excel Data Workbooks
In RiverSMART, you can link one or more Excel workbooks as source data for the GPAT Graphs event. The requirements for the source data workbook are as follows:
• Rows represent timesteps.
• The first column of a worksheet includes the timestep names.
• The first row of a worksheet includes the column names.
In RiverWare, you can generate workbooks of this type directly by specifying an Excel output device through the Output Manager or by specifying the creation of Excel files in the Output frame of the Multiple Run Management Configuration dialog box. You can also convert RiverWare output files (.rdf) to Excel files using the RDF To Excel event or the RDF To Excel standalone tool distributed by CADSWES.
Note: For the graphs to be generated successfully by the GPAT Graphs event, column and worksheet names specified in the saved graph configurations in the GPAT Graphs configuration file must be present in the source data workbooks.
Output Excel Workbook
You specify the output Excel workbook by creating an output link from the GPAT Graphs event on the RiverSMART workspace.
Each time the GPAT Graphs event is run, it creates a single workbook that includes all the graphs generated according to the specified graphs configuration file. Each graph has a data worksheet, which includes the data for the graph, and an adjacent graph worksheet, which includes the Excel plot. If an existing workbook is specified as the output workbook, additional graph worksheets are added to the workbook; existing worksheets in the workbook are not deleted.
The event creates a log file in the Working\ folder, in a subfolder named for the processed scenario or scenario set. The log file includes informational messages, warnings, and error messages generated during the graph creation process.
Revised: 08/02/2021