
Output: Charts, Model Reports, and Plotting
Charts
For more information on any of these Chart enhancements, see Chart in Output Utilities and Data Visualization.
Configuration Dialog Reorganization
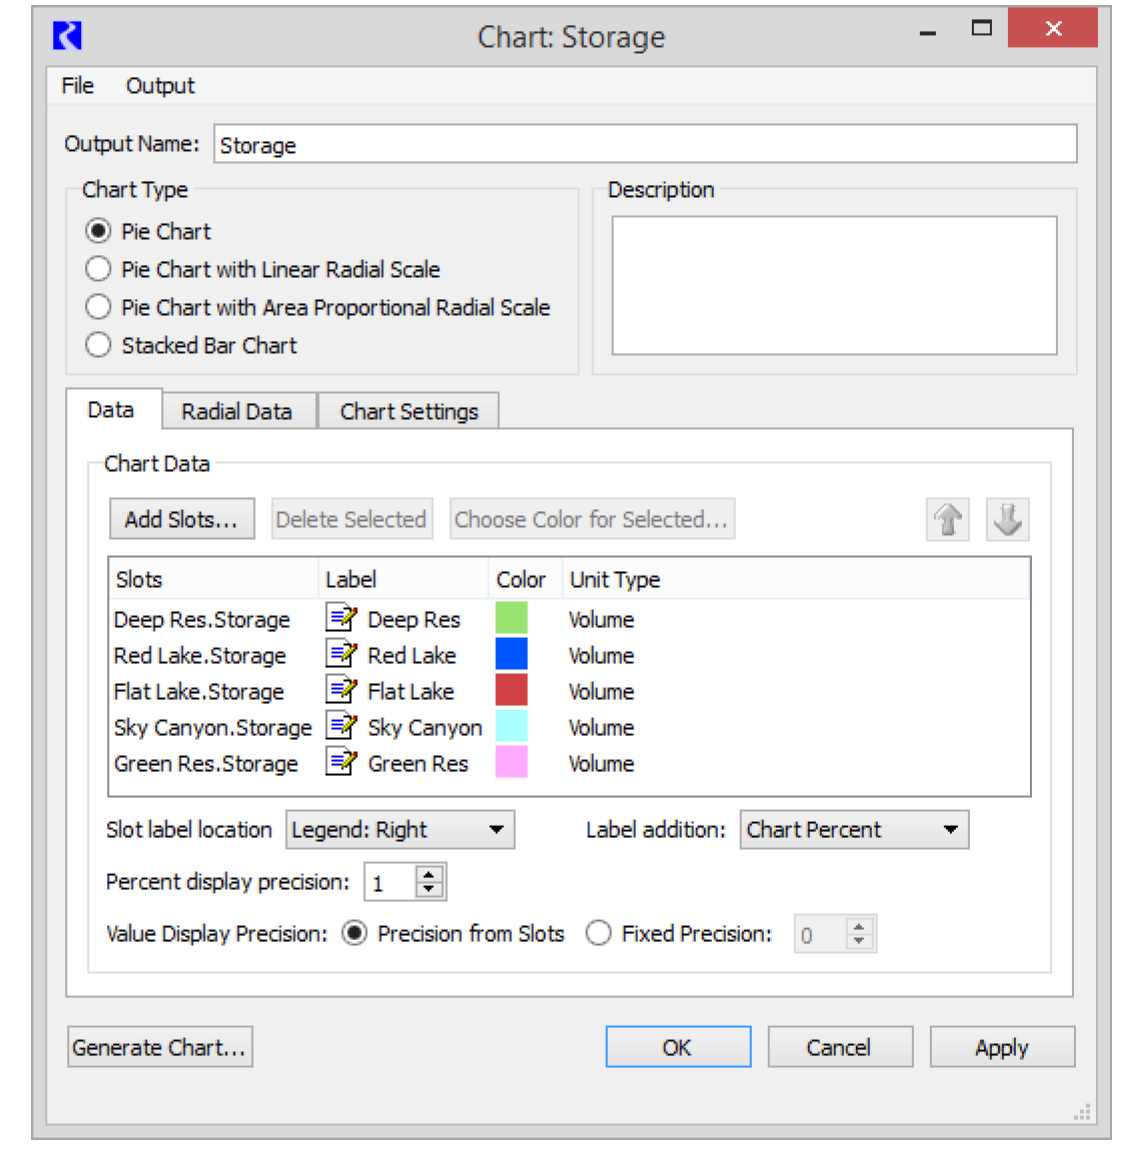
The Chart configuration dialog was reorganized into three tabs to reduce the overall size of the dialog. The tabs are Data, Radial Data, and Chart Settings.
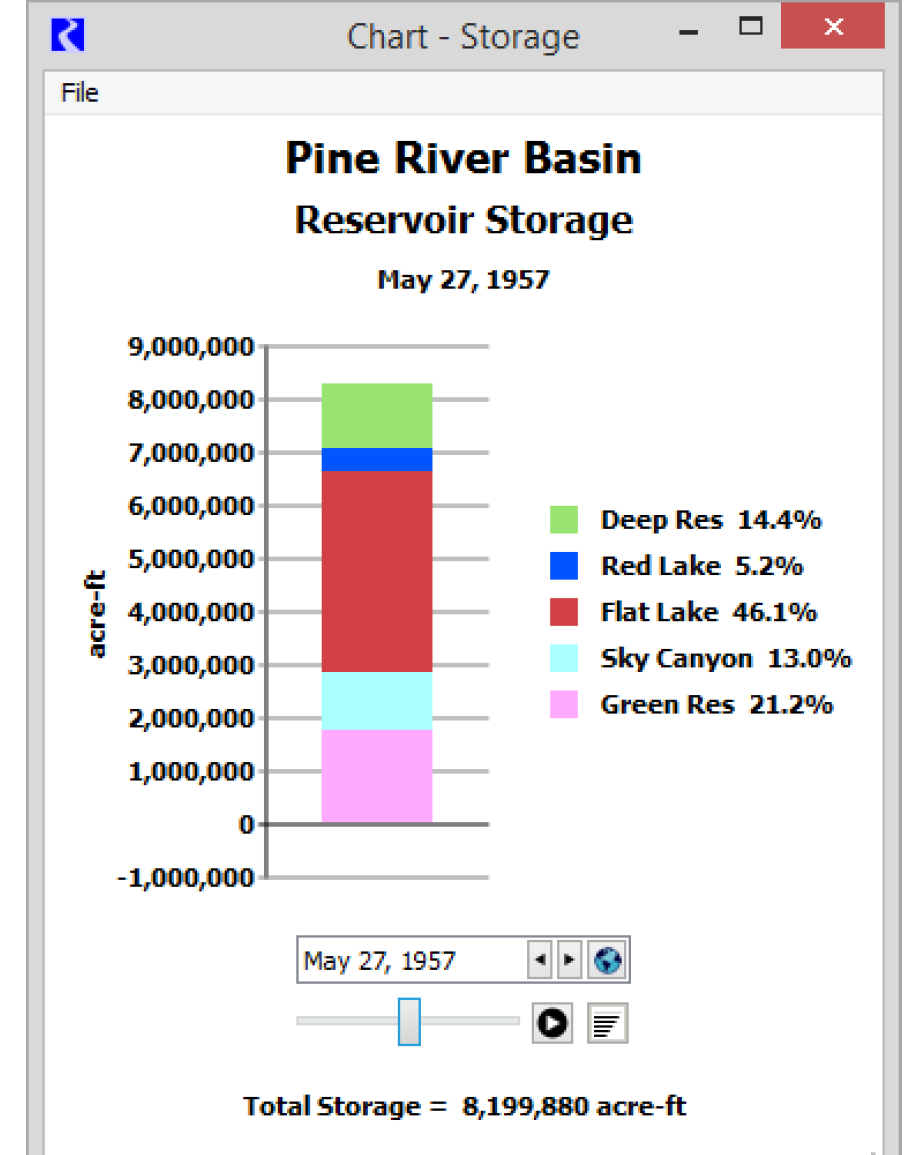
Stacked Bar Chart
A new stacked bar chart type was implemented as shown in the screenshot to the right. This new type of chart shows negative values much better than the existing pie chart.
Labels or Legend Location
For charts, you can now choose to label items using a separate legend. For each chart, you choose from the following labeling options:
• Legend: Right (shown)
• Legend: Below
• Legend: Lower Left
• Legend: Lower Right
• Label Pie Slices (for pie charts only)
Model Reports
Model Reports, Model Report in Output Utilities and Data Visualization, allow you to generate a customized HTML document describing various aspects of a model including the configuration, RPL policy, slots, and plots. The model report utility was enhanced as follows:
• Two new slot items were added:
– Scalar Slot Grid: shows as grid of scalar values with objects as rows and slot names as columns.
– Periodic Slot Table: shows a table of periodic slots, where columns are distinct Periodic Slots. All periodic slots have the same period, but possibly different sets of intervals.
• The Slot item for slots computed by RPL expression now shows the expression formula in addition to a time series plot for series or the value for scalar slots.
• A new item Link Table was added to show a table of the physical links.
• A new item RPL Rule/Goal was added to show individual RPL Rules or Goals added.
Plotting
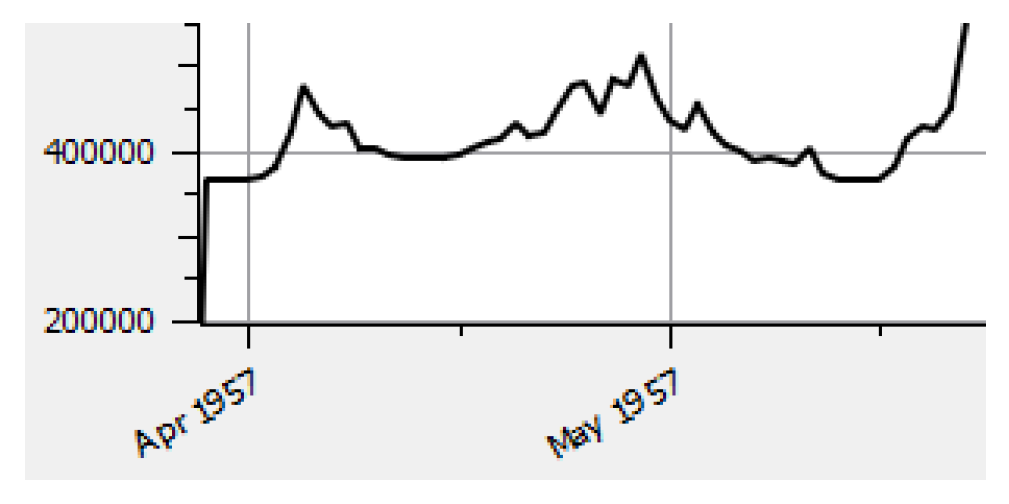
Axis Label Rotation
On plot axis, you can now rotate text labels, individually on all four axes. Rotation is supported in both directions to 30, 45, and 90 degrees. The screenshot to the right shows the dates rotated 30 degrees counterclockwise.
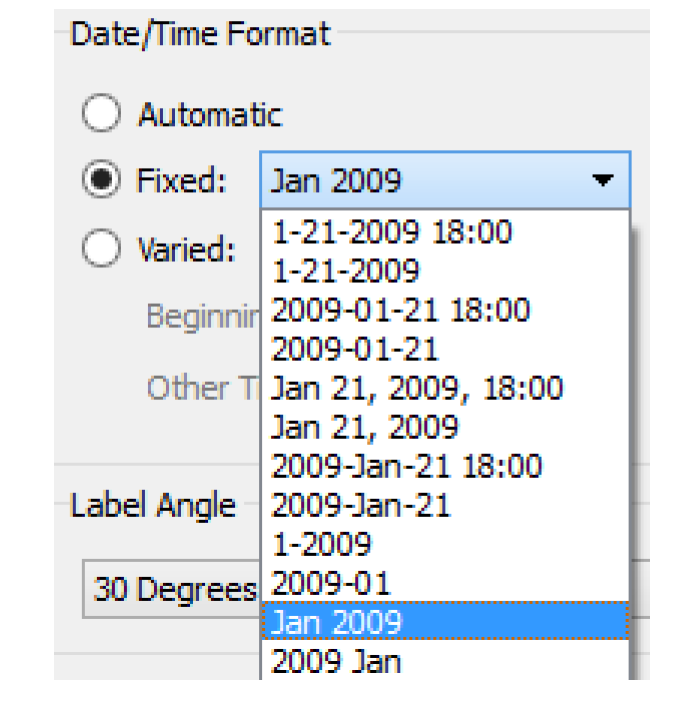
Date Time Formats
For axes that have Date/Time units, you can now configure the format of the Date/Time. This is supported with three distinct format selection algorithms: Automatic, Fixed and Varied. For example, the screenshots to the right and above right shows a Fixed Month Year configuration.
See Plot Page Settings in Output Utilities and Data Visualization for more information.
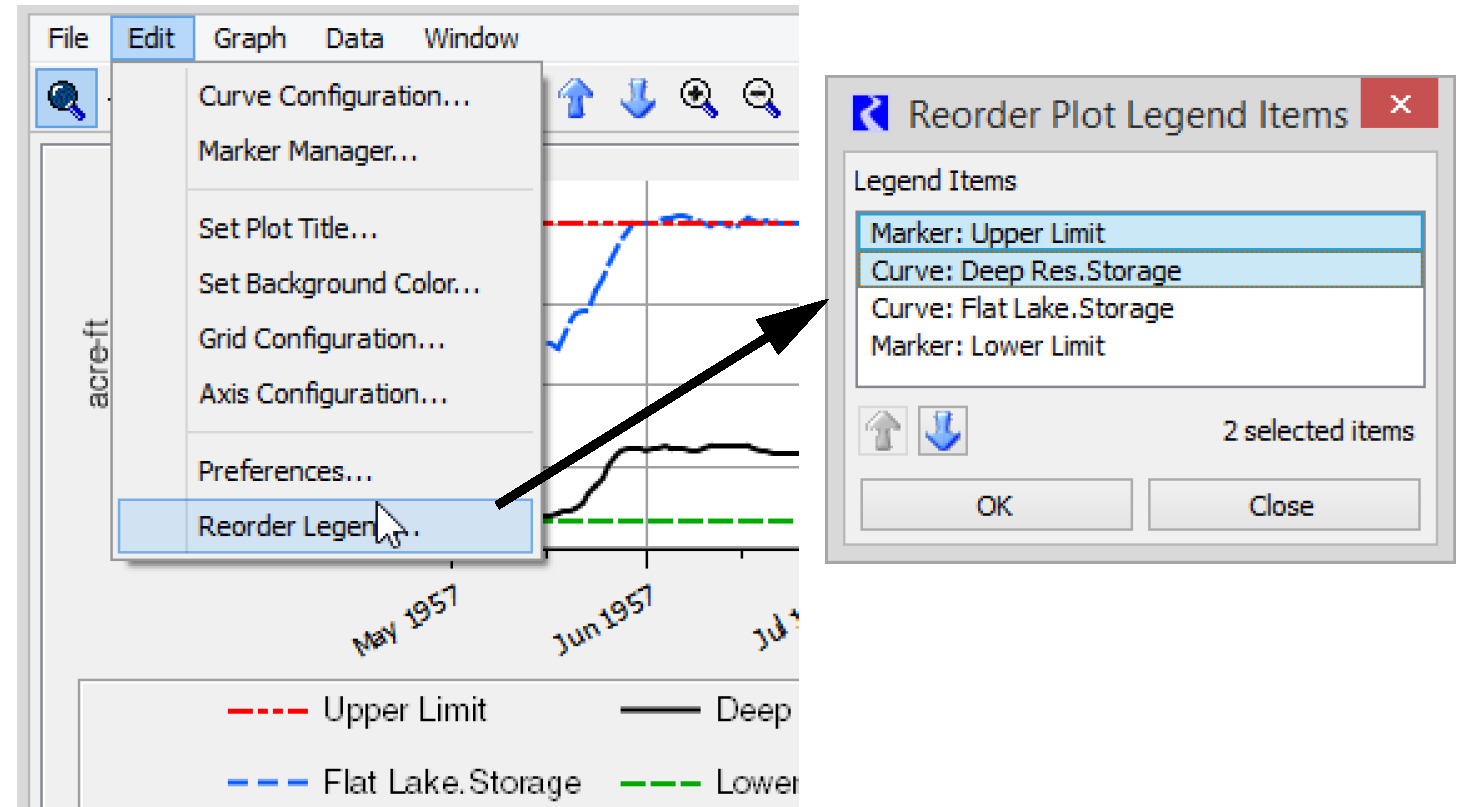
Legend Reorder
Plot legend items, for slot curves and markers, can now be reordered. A Reorder Legend... menu item appears in the Edit menu and in the context menu for slot curve and marker legend items.
Revised: 08/02/2021