
Output, Plotting, and Model Reports
Model Reports
Model Reports Model Report in Output Utilities and Data Visualization allow you to generate a customized HTML document describing various aspects of a model including the configuration, RPL policy, slots, and plots.
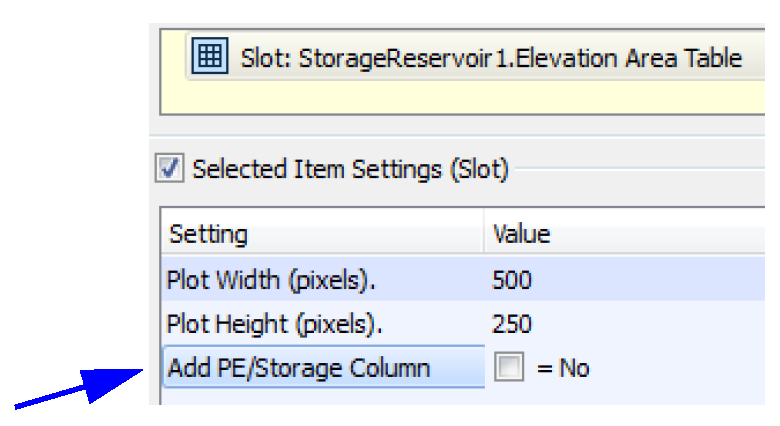
Optional PE/Storage column
The Model Report’s Slot item displays a table slot’s values as delimited data in the HTML report. For slots like the Elevation Area Table slot (Pool Elevation vs Area), it also shows a column of Storage values that corresponds to each Pool Elevation. This Storage was unconditionally shown. Now there is a setting in the Slot item to specify if you want to see this extra column of data. Use the Add PE/Storage Column to disable showing the extra information.
Output Canvas and Teacups
An Output Canvas is a new output device which shows spatially distributed output information. In the initial implementation, you can create Teacups that show, for example, the current reservoir storage against the reservoir’s full storage. On the teacups you can show marker lines representing important levels and text providing slot values or other useful information. In addition, you can add a legend to annotate the teacups and images representing a map or photos of the reservoir. You can animate the teacups as they change through the run period and export the canvas to an image file.
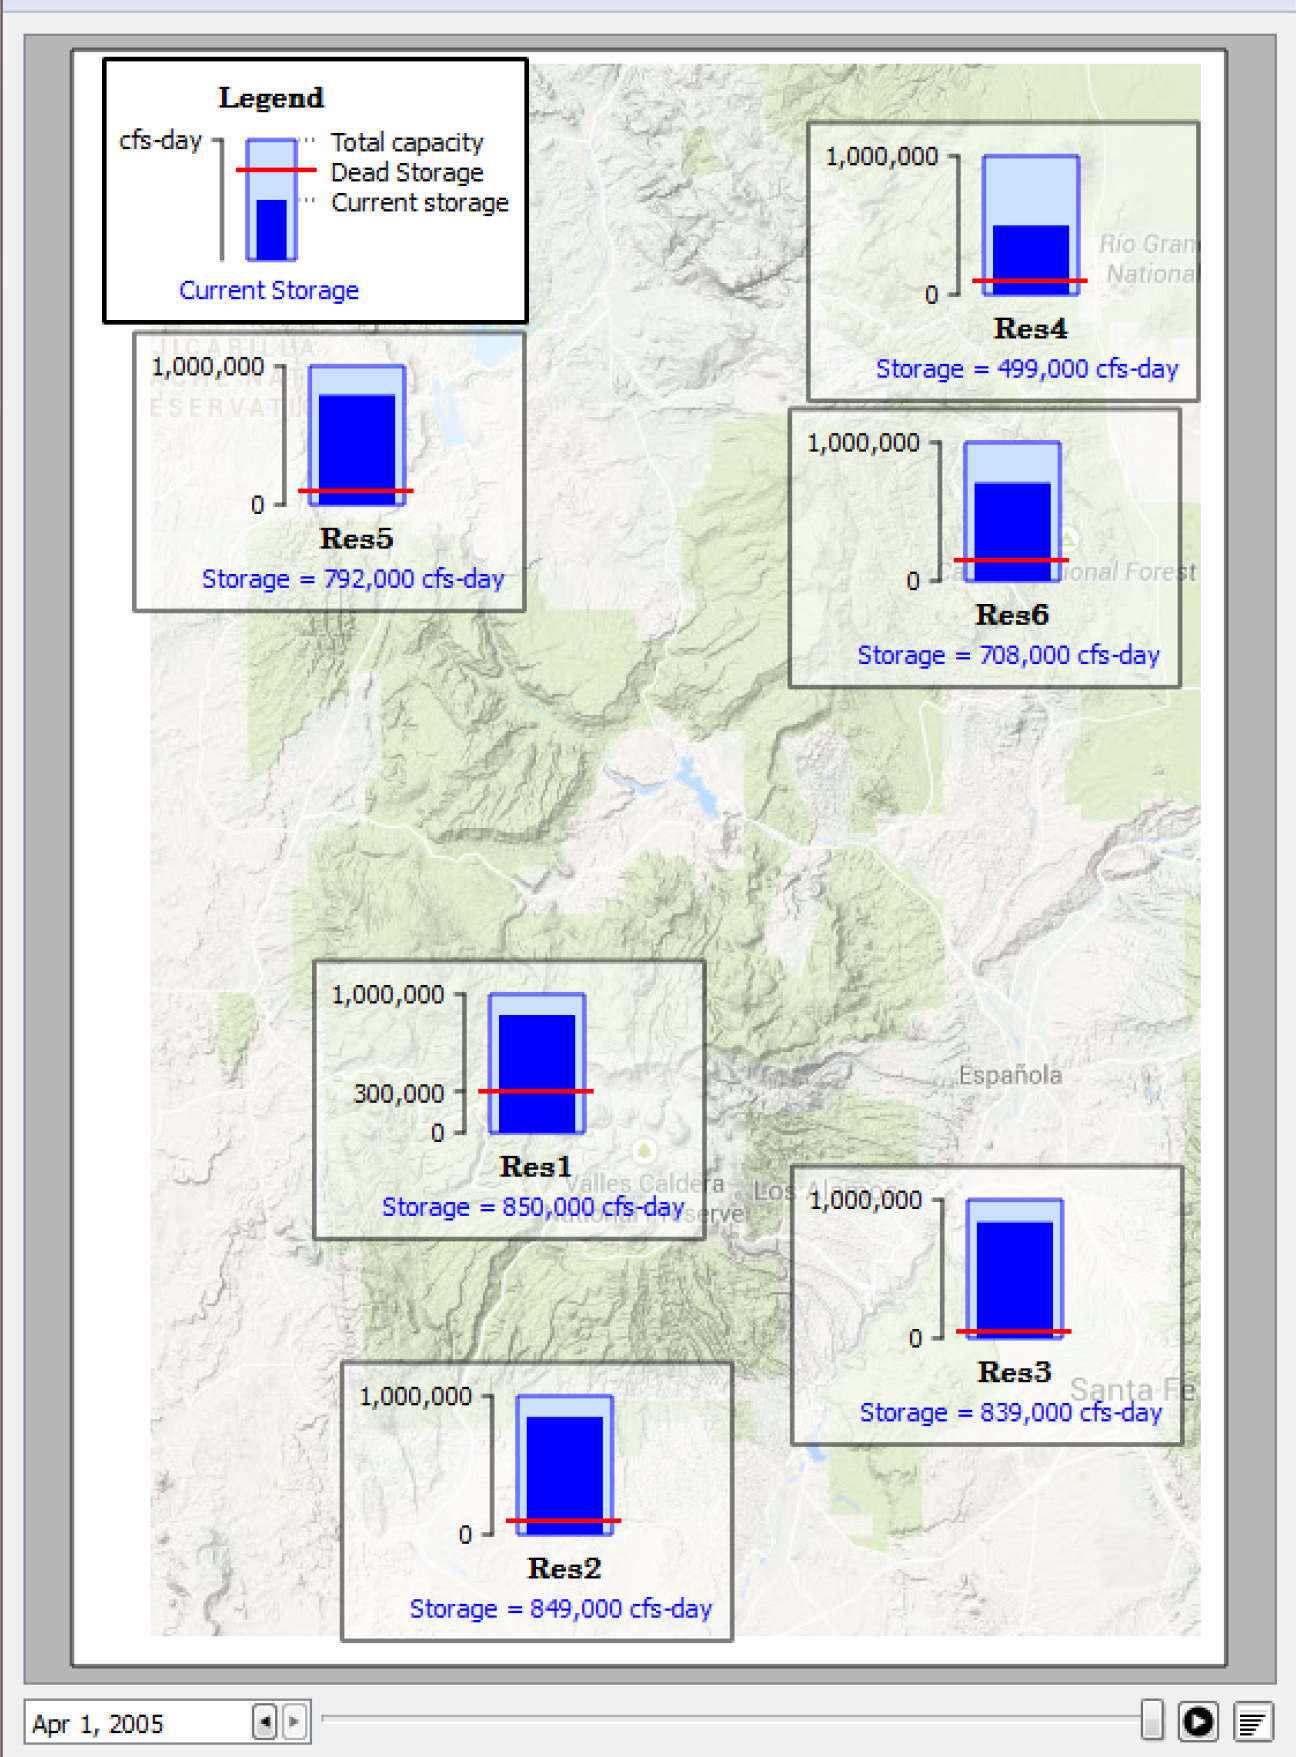
For more information, see Output Canvas in Output Utilities and Data Visualization.
Plotting
Show Markers in the Legend
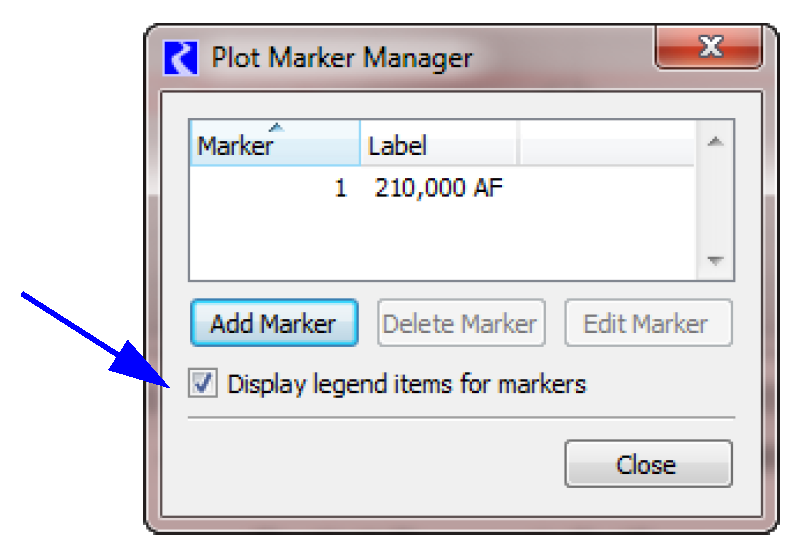
You can now show Markers as an item in the legend. In the Plot Marker Manager, shown to the right, use the Display legend items for markers check box.
Toggle off curves on a graph
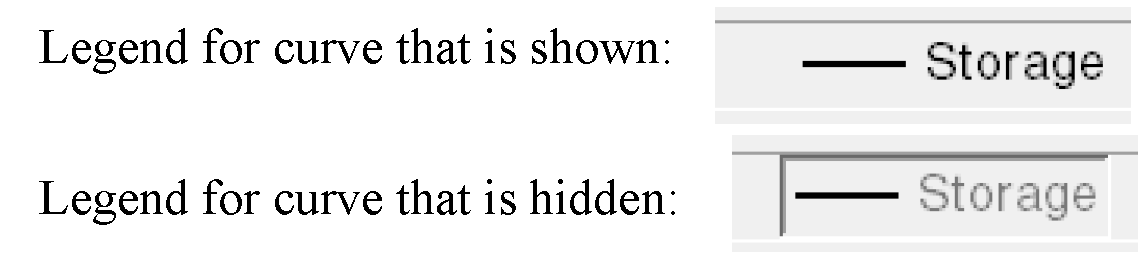
In the graph legend, you can now left-click on an item to temporarily hide the curve. When hidden, the legend item is shown in a disabled state. When the plot is saved, this disabled setting is preserved for future use in the same session, but not saved to the model file. When you open a saved model, all curves are shown regardless.
Finally, as part of the above change, the context menus on the legend items have been moved from the left-click to the right-click. This is more standard and intuitive.
Plot Print Preview and Margin Settings
A plot print preview was added as an option from the File Print Preview menu. Within this preview, you can also configure the page layout including page margins. Use the page setup button to access the margins:
For more information, see Print Preview in Output Utilities and Data Visualization.
Revised: 08/02/2021