
Plotting and Output
Model Report
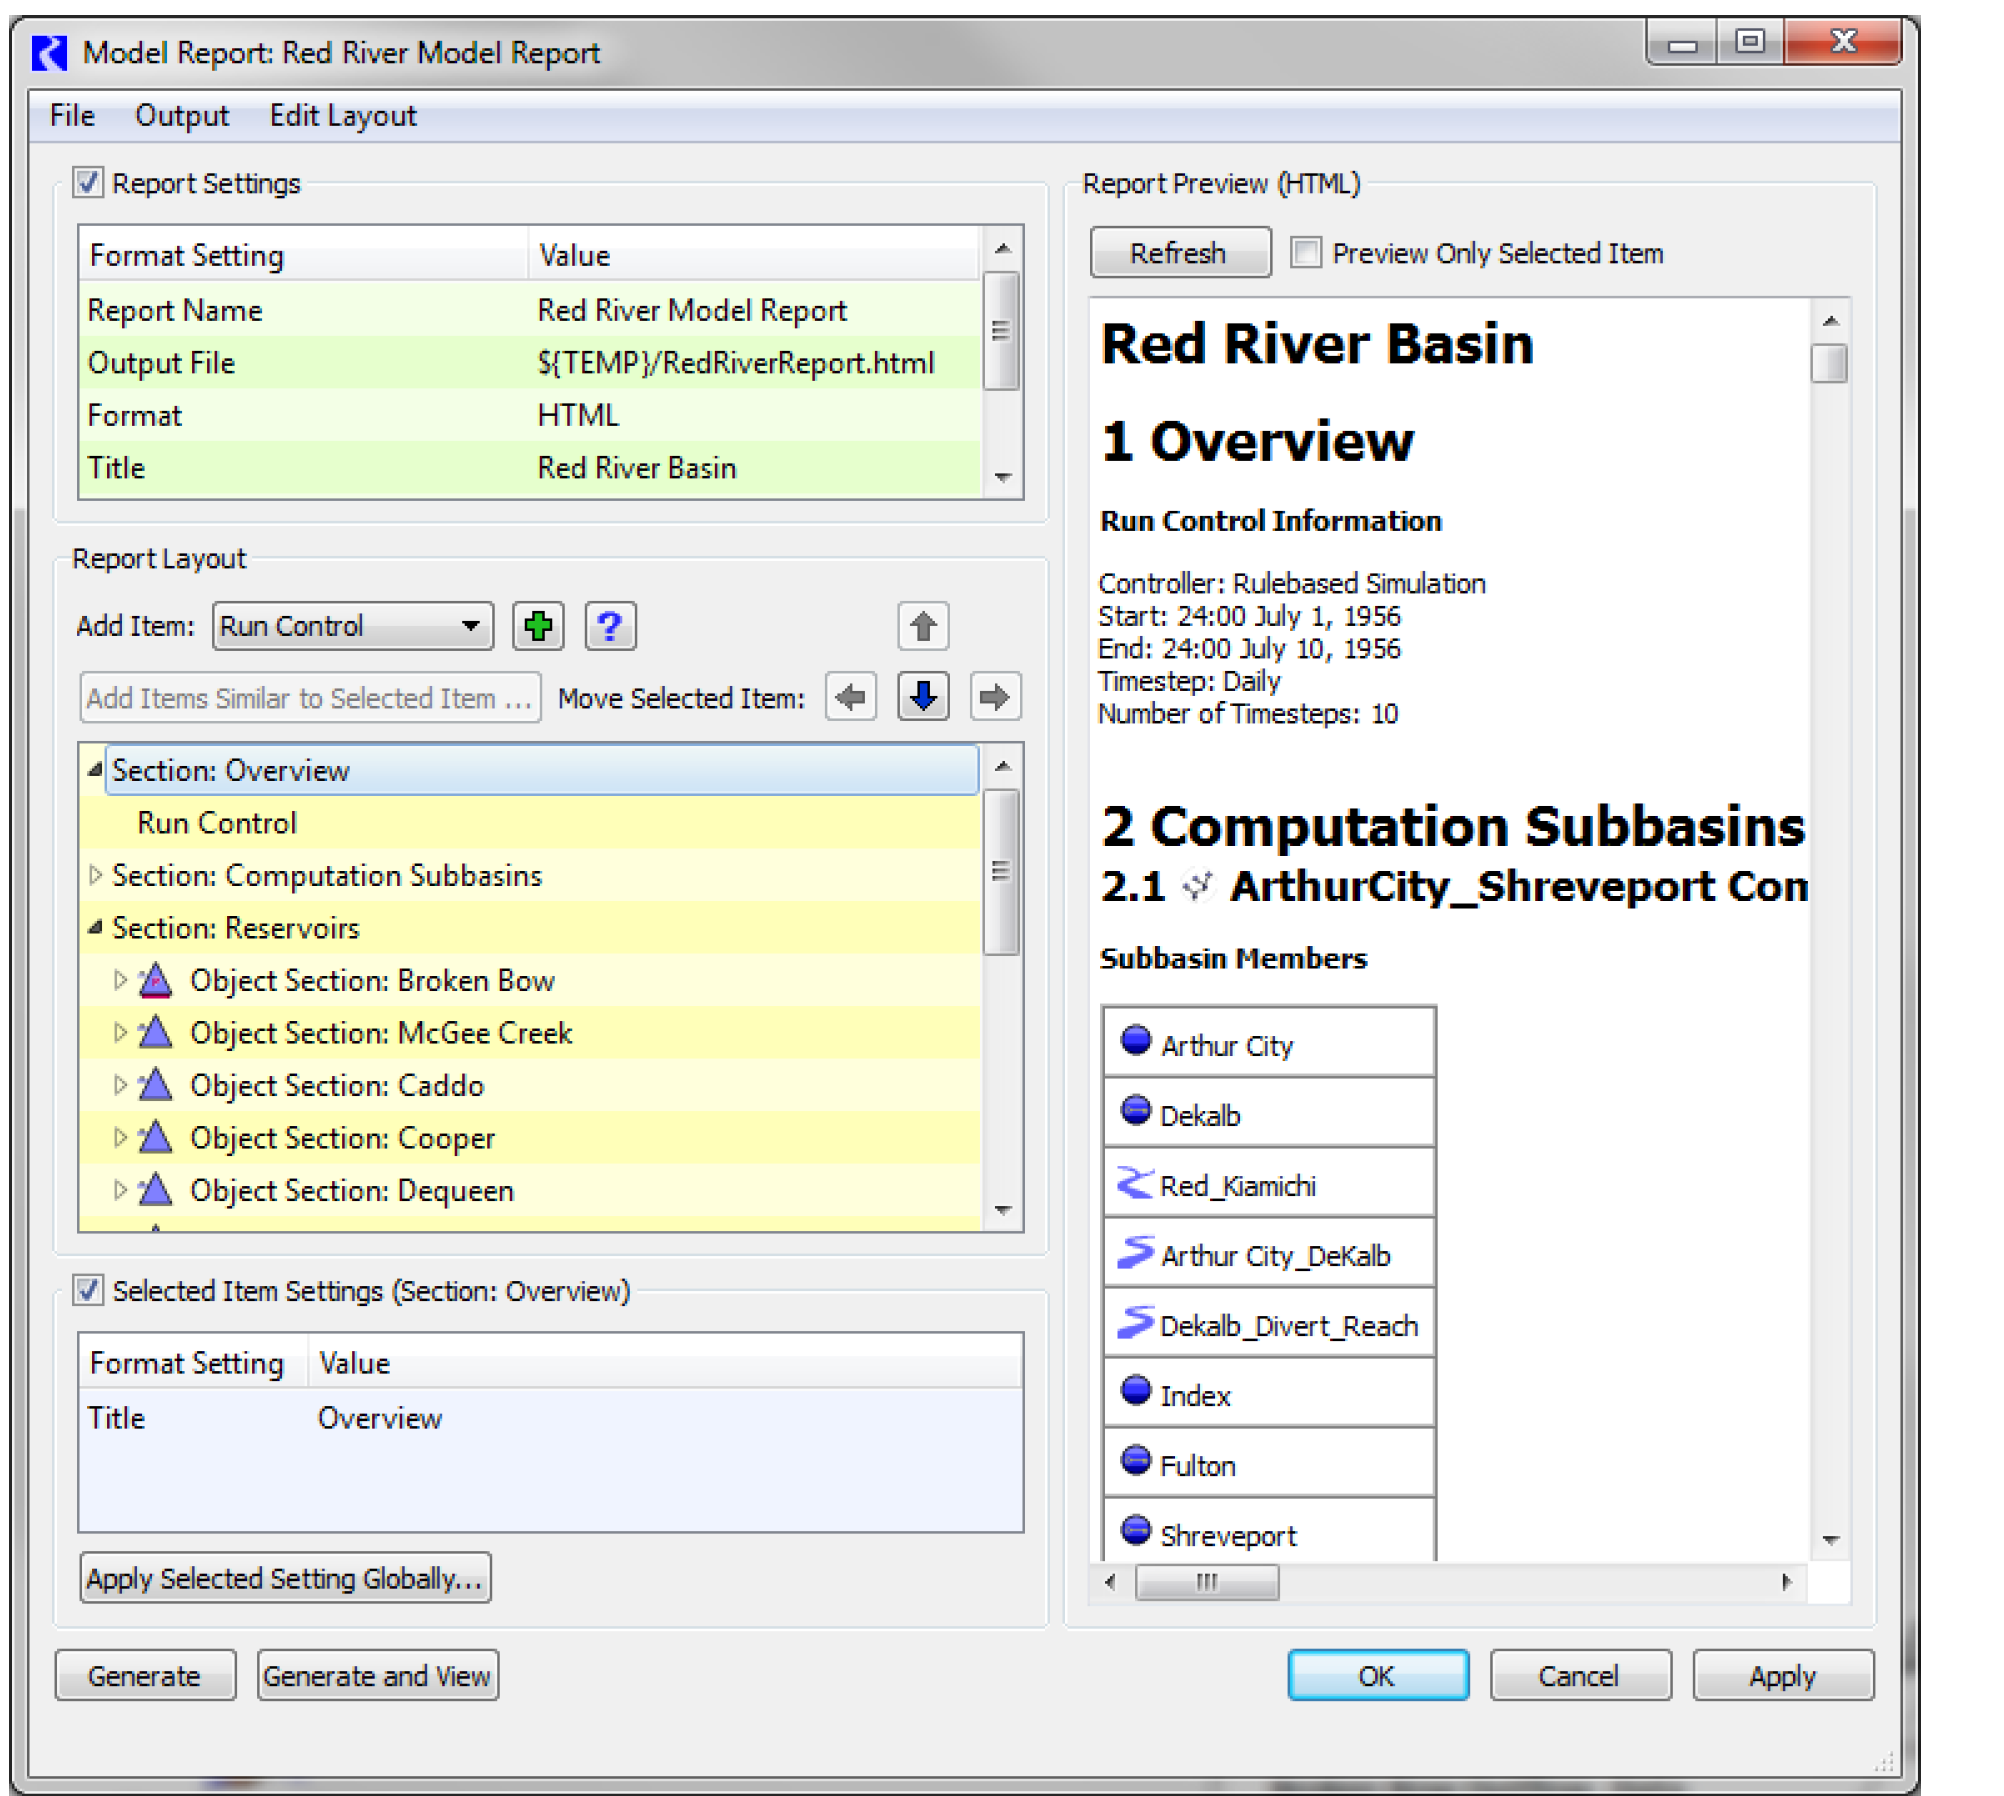
A new output device, the Model Report, was added to the Output Manager. The Model Report is an output device that generates an HTML document describing the current model. The Model Report is flexible with respect to both the contents and appearance of the report, allowing the user to configure both the information contained in the report as well as how that information is formatted.
The following screenshot shows an example configuration and a preview of a model report. See Model Report in Output Utilities and Data Visualization for more information.
Pie Charts
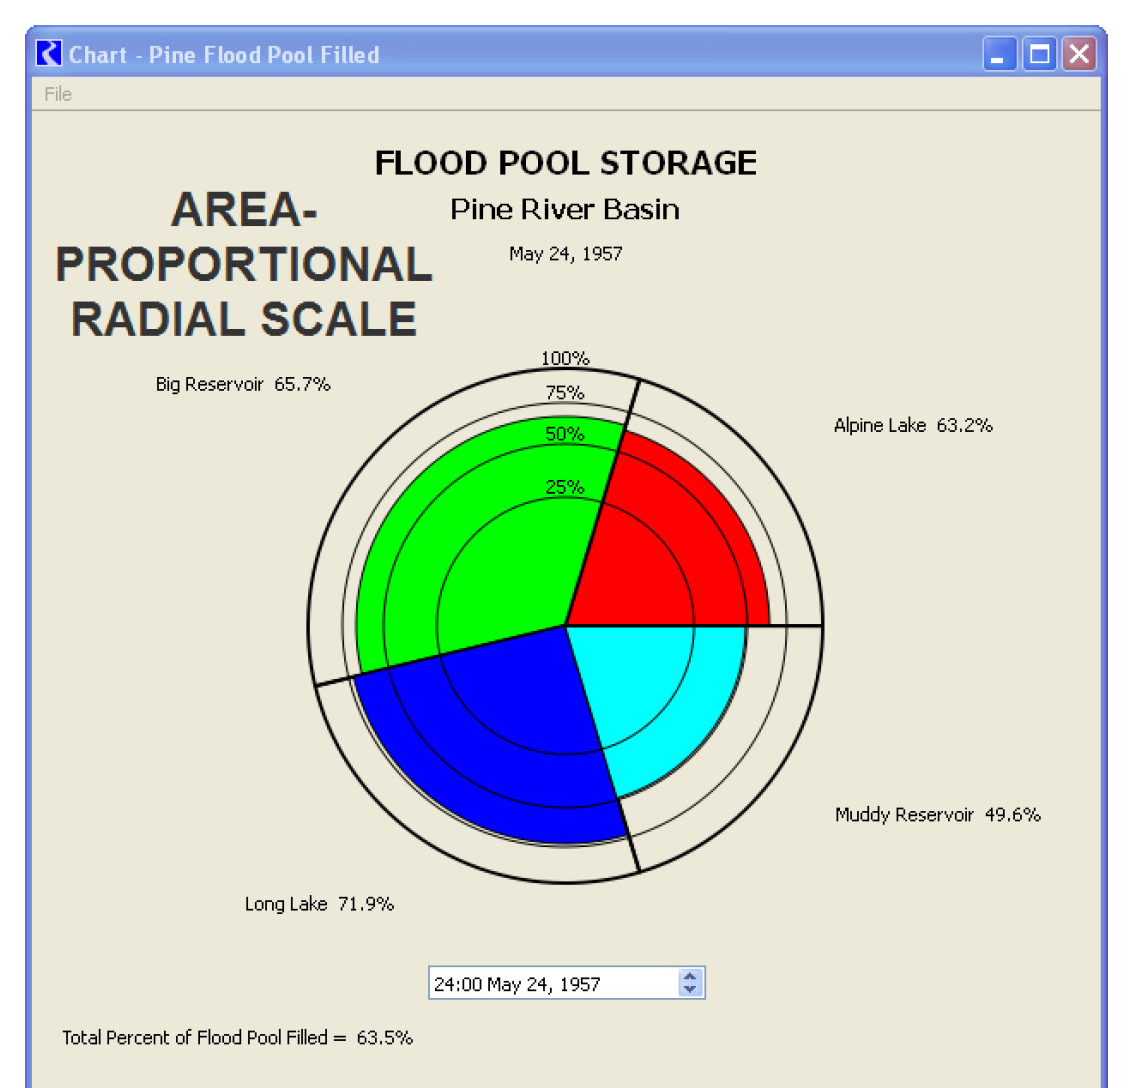
A new output device, the Chart, was added to the Output Manager. Currently, the chart supports three types of pie chart for data stored in series, periodic, and scalar slots.
• Standard: The slices are drawn and colored in proportion to each slot’s part of the total.
• Linear Radial Scale: The chart shows a radial dimension of data in addition to the data creating the pie slices. For example, the pie slices could show each reservoir’s portion of the total flood pool storage that exists in the basin if all flood pools were filled. The radial dimension could show how much of each reservoir’s flood pool is actually filled at a certain timestep. Only the actual storage part of the pie slice is colored. The radial dimension has a linear scale.
• Area-proportional Radial Scale: The final option is similar to the linear scale but displays the radial dimension as an area-proportional scale. An example of this chart is shown in the screenshot.
For more information on pie charts, see Chart in Output Utilities and Data Visualization.
Plot Dialog - Move Arrows
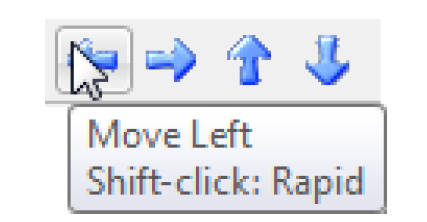
In the plotting tool, the Move buttons were improved as follows to allow you to more easily navigate through a plot page:
were improved as follows to allow you to more easily navigate through a plot page:• Holding down the button (or Left/Right/Up/Down arrow key) repeats the move allowing you to scroll.
• Use the Shift Click or (Shift arrow keys) to rapidly move through the plot. Tool tips were added to remind you of these actions.
For more information, see Zoom Tools in Output Utilities and Data Visualization.
Temporary Directory
Previously, temporary output files were always written to the folder defined by the TMP or TEMP environment variable. In Windows 7, this is not always available. Now, RiverWare will use the TMP or TEMP environment variables if defined, but will otherwise get the default directory from the operating system. This temporary file path is used by:
• The default paths for the output files from the following output devices: Comma-delimited, RDF, and Excel. The user would typically change the path for these in the user interface to where they want them to be written.
• Default path for optimization log and data files if RIVERWARE_OPT_DIR is not defined.
• Default path for Control File-Executable type DMI files if RIVERWARE_DMI_DIR is not defined.
The RiverWare System information dialog shows the path for the temporary directory used. This can be found in the Help About RiverWare menu, then select the Show System Info... button.
XMGR Output Devices Removed
The Solaris output device type XMGR Data File is no longer supported, so it was removed. A warning message is posted at model load if your model has XMGR devices.
Revised: 01/04/2021