
Chart Types
Four types of charts are available for generation from the chart device.
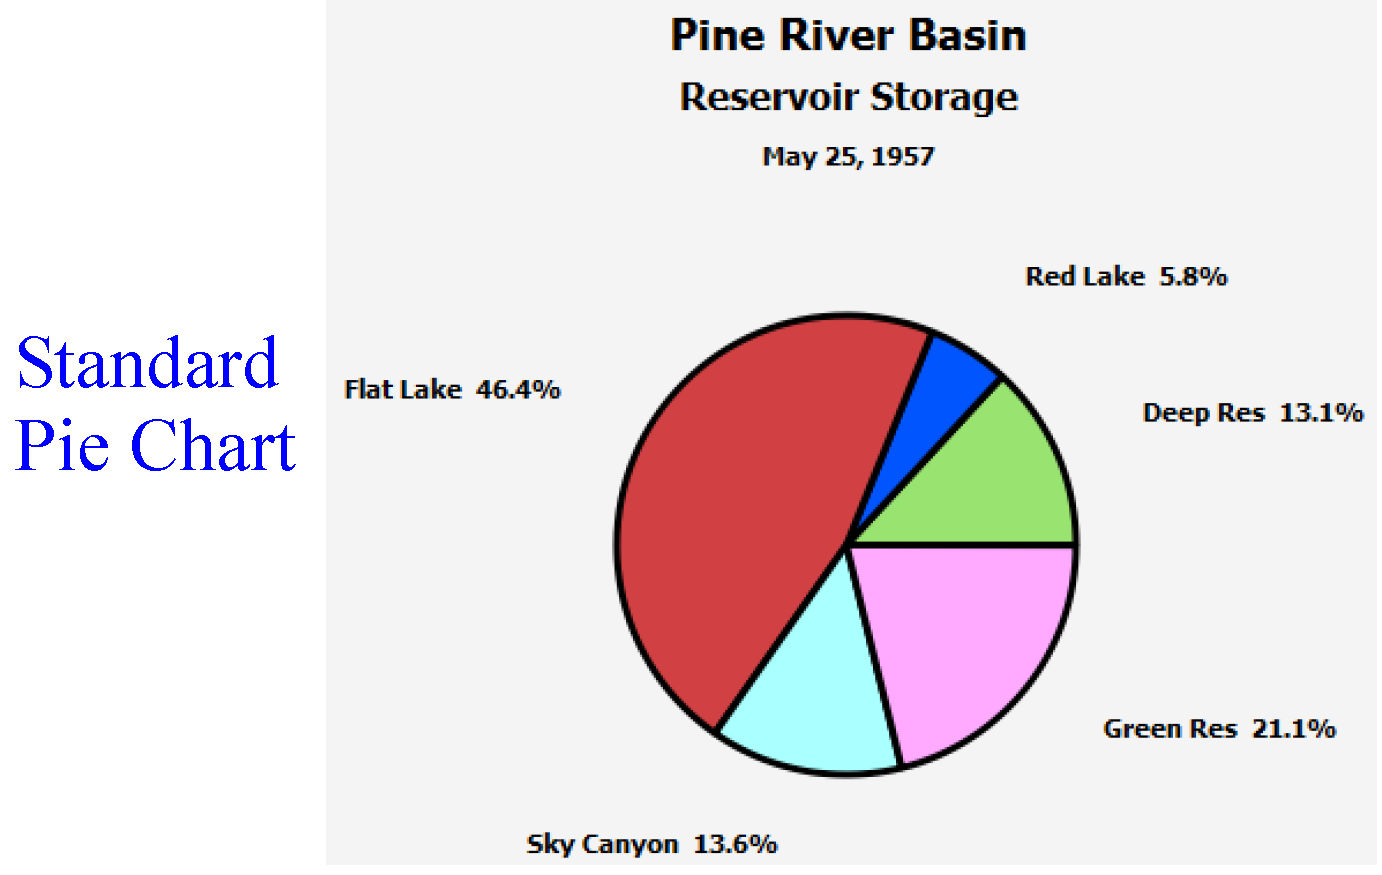
Standard Pie Chart
The slices are drawn and colored in proportion to each slot’s part of the total.
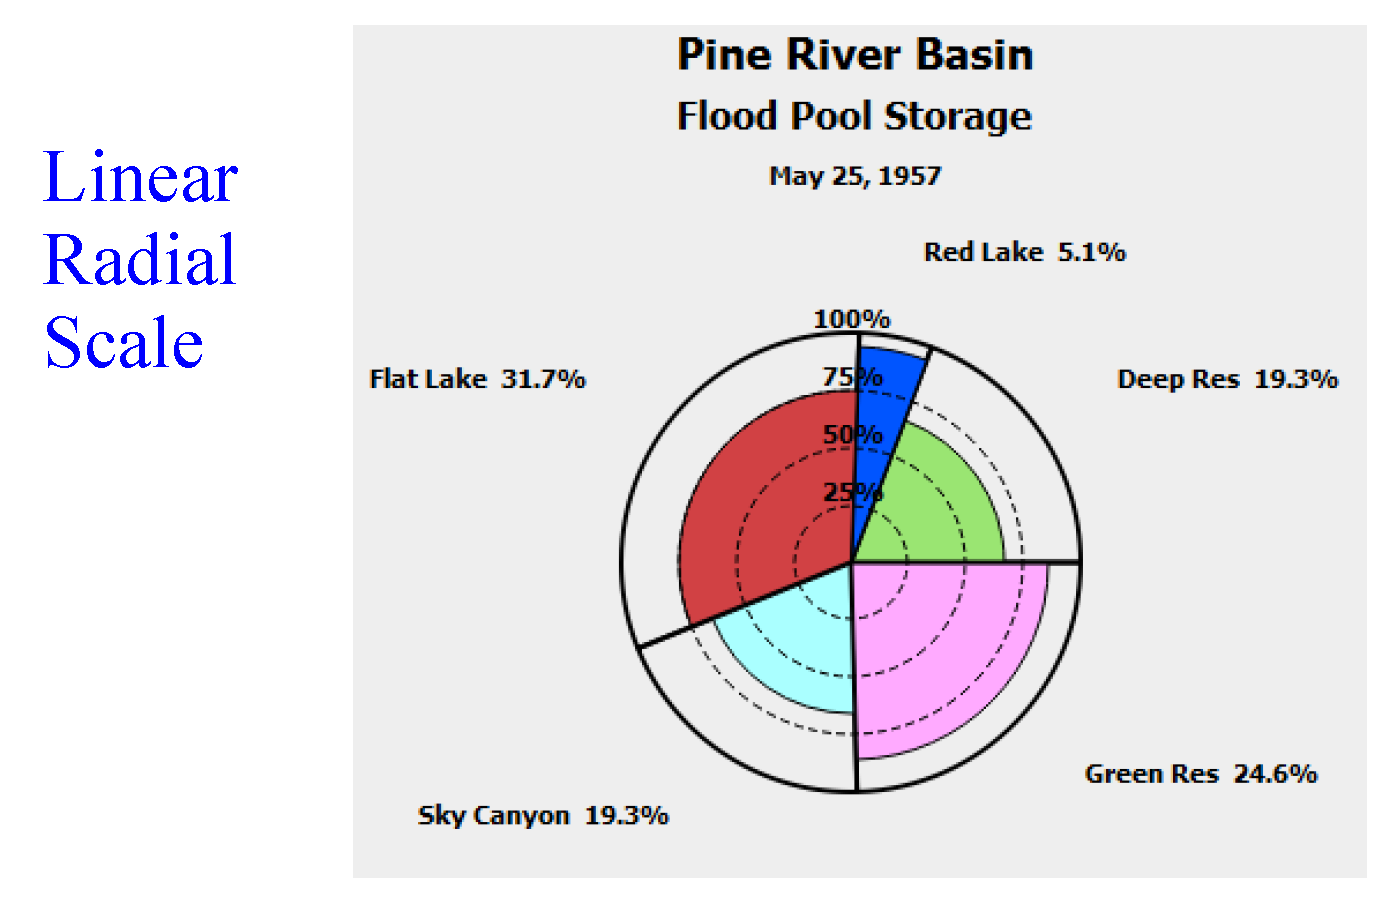
Pie Chart with Linear Radial Scale
The chart shows a radial dimension of data in addition to the data creating the pie slices. For example, the pie slices could show each reservoir’s portion of the total flood pool storage that exists in the basin if all flood pools were filled. The radial dimension could show how much of each reservoir’s flood pool is actually filled at a certain timestep. Only the actual storage part of the pie slice is colored. The radial dimension has a linear scale.
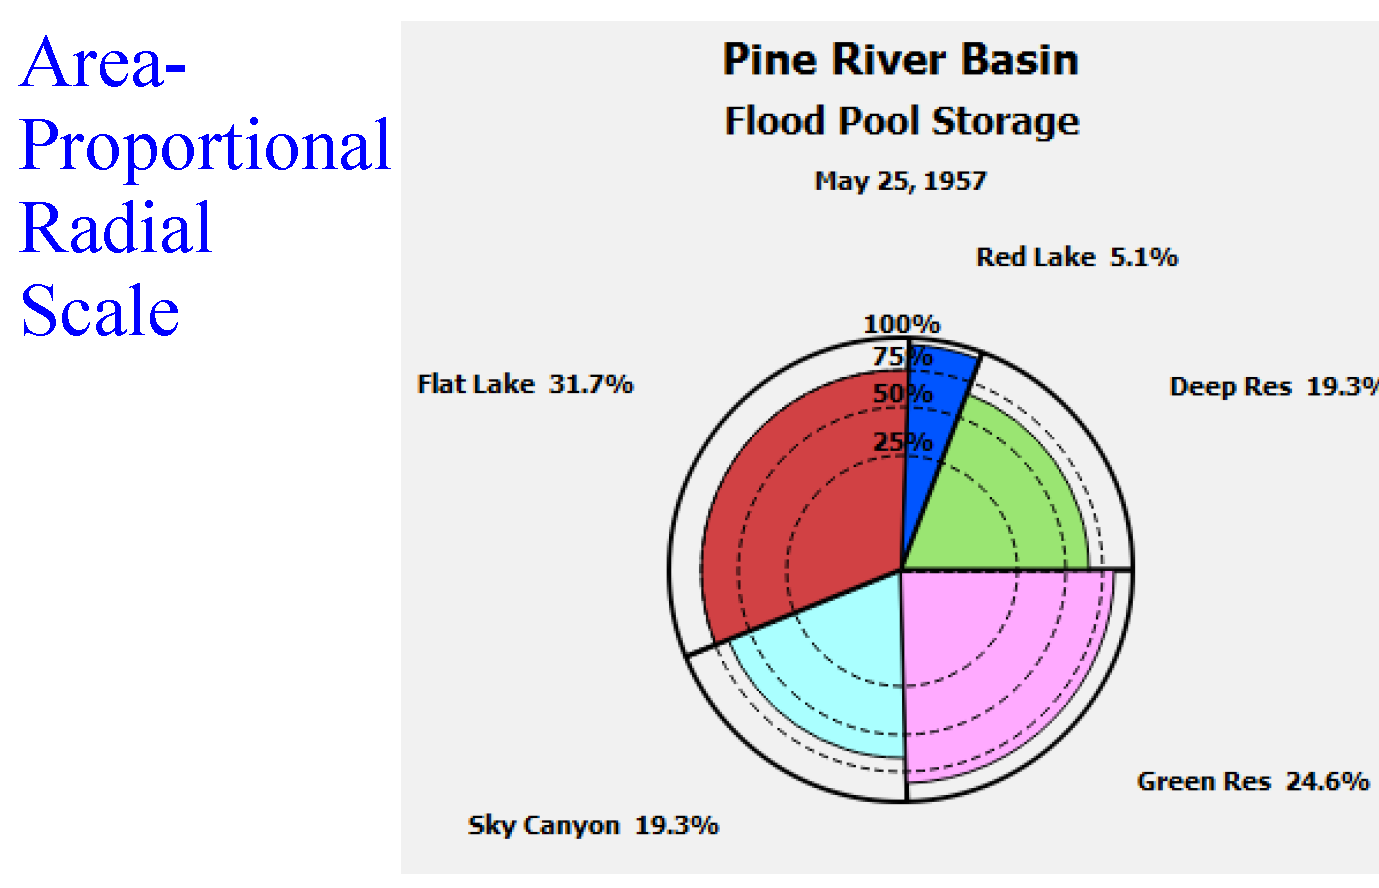
Pie Chart with Area-proportional Radial Scale
This pie chart option is similar to the linear scale but displays the radial dimension as an area-proportional scale.
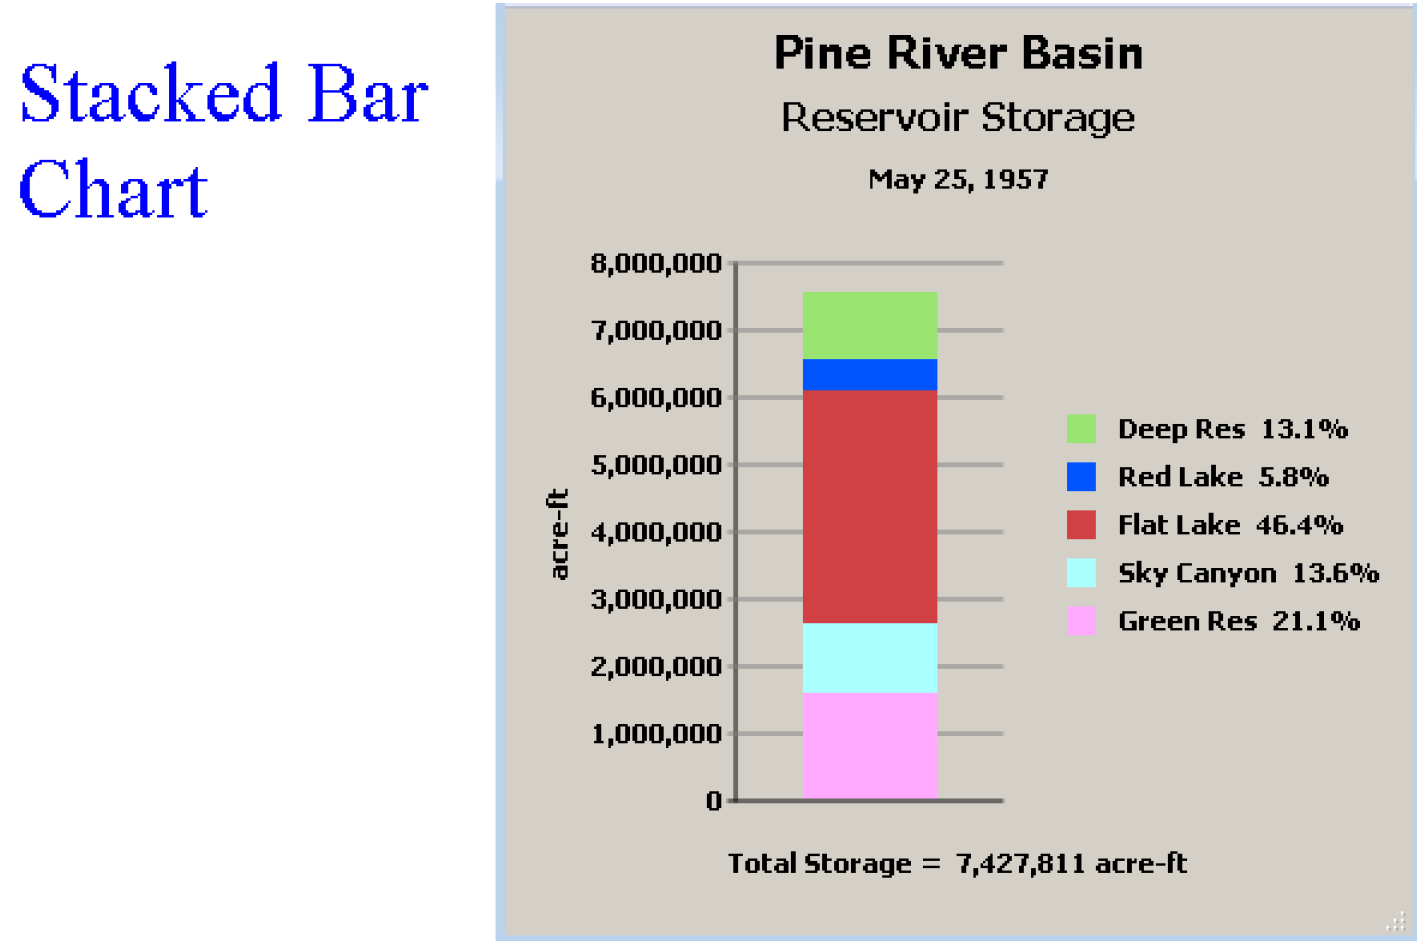
Stacked Bar Chart
A single bar is drawn and colored in proportion to each slot’s part of the total. The chart can accommodate negative values and will display values both above and below a zero line.
Revised: 01/04/2021